| |||||||||||||||||||||||||||||||||||||||||||||||||||||
26 seats on the council of the electoral county of South Dublin within Dublin County Council | |||||||||||||||||||||||||||||||||||||||||||||||||||||
---|---|---|---|---|---|---|---|---|---|---|---|---|---|---|---|---|---|---|---|---|---|---|---|---|---|---|---|---|---|---|---|---|---|---|---|---|---|---|---|---|---|---|---|---|---|---|---|---|---|---|---|---|---|
| |||||||||||||||||||||||||||||||||||||||||||||||||||||
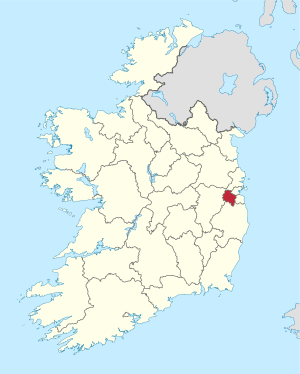
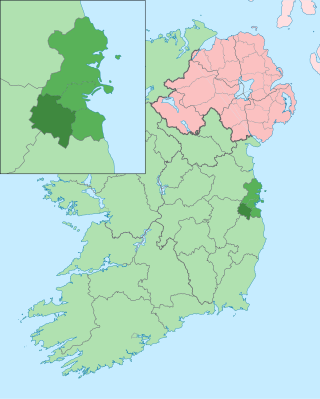
Map showing the area of South Dublin County Council | |||||||||||||||||||||||||||||||||||||||||||||||||||||
|
An election to the council of the electoral county of South Dublin within Dublin County to Dublin County Council took place on 27 June 1991 as part of that year's Irish local elections. 26 councillors were elected for a five-year term of office from five local electoral areas on the system of proportional representation by means of the single transferable vote. [1] It was one of three electoral counties within Dublin County at this election, the others being Fingal and Dún Laoghaire–Rathdown. The term was extended twice, first to 1998, then to 1999. [2] [3]
The electoral county had been established in 1985 as Dublin–Belgard and was renamed South Dublin for these local elections. [4]
From 1 January 1994, on the coming into effect of the Local Government (Dublin) Act 1993, County Dublin was disestablished as an administrative county, and in its place the electoral counties became three new counties. The councillors listed below became the councillors for South Dublin County Council from that date. [5]
Party | Seats | ± | First Pref. votes | FPv% | ±% | |
---|---|---|---|---|---|---|
Fianna Fáil | 7 | -6 | 16,179 | 29.1 | ||
Fine Gael | 6 | -2 | 10,176 | 18.3 | ||
Labour | 4 | +2 | 9,796 | 17.6 | ||
Progressive Democrats | 4 | +4 | 5,080 | 9.1 | ||
Workers' Party | 3 | +1 | 4,842 | 8.7 | ||
Green | 1 | +1 | 3,294 | 5.9 | ||
Independent | 1 | 0 | 4,294 | 7.7 | ||
Totals | 26 | 0 | 53,634 | 100.0 | — |
Party | Candidate | FPv% | Count | |||||||
---|---|---|---|---|---|---|---|---|---|---|
1 | 2 | 3 | 4 | 5 | 6 | 7 | ||||
Fine Gael | Therese Ridge * | 18.3% | 1,378 | 1,431 | 1,459 | 1,497 | 1,563 | 1,733 | 1,883 | |
Progressive Democrats | Colm Tyndall | 17.7% | 1,332 | 1,355 | 1,375 | 1,447 | 1,544 | 1,647 | 1,863 | |
Fianna Fáil | Colm McGrath* | 14.6% | 1,104 | 1,112 | 1,136 | 1,257 | 1,280 | 1,316 | 2,027 | |
Fianna Fáil | Catherine Sherwin | 13.1% | 986 | 1,004 | 1,028 | 1,182 | 1,229 | 1,259 | ||
Workers' Party | Donna Conlon | 8.9% | 671 | 729 | 809 | 813 | 943 | 1,292 | 1,356 | |
Labour | Robert Dowds | 8.3% | 626 | 679 | 711 | 721 | 794 | |||
Fianna Fáil | Pat Smyth | 5.7% | 431 | 436 | 441 | |||||
Green | Conor Delaney | 5.3% | 400 | 436 | 496 | 518 | ||||
Sinn Féin | Vincent Coffey | 4.2% | 315 | 340 | ||||||
Independent | Maurice Duffy | 2.4% | 178 | |||||||
Independent | Maire O'Connor | 1.6% | 123 | |||||||
Electorate: 20,425 Valid: 7,544 (36.9%) Spoilt: 63 Quota: 1,887 Turnout: 7,607 (37.2%) |
Party | Candidate | FPv% | Count | |||||||||
---|---|---|---|---|---|---|---|---|---|---|---|---|
1 | 2 | 3 | 4 | 5 | 6 | 7 | 8 | 9 | ||||
Labour | Mervyn Taylor TD* | 24.1% | 1,576 | |||||||||
Workers' Party | Don Tipping* | 13.9% | 912 | 966 | 995 | 1,020 | 1,107 | 1,138 | 1,306 | 1,357 | ||
Fine Gael | Michael Keating | 11% | 720 | 745 | 754 | 875 | 919 | 946 | 1,066 | 1,126 | 1,170 | |
Independent | Bob Byrne | 9.3% | 611 | 628 | 645 | 651 | 713 | 736 | ||||
Fianna Fáil | Geraldine O'Connor | 8.8% | 577 | 584 | 586 | 607 | 626 | 767 | 819 | |||
Fianna Fáil | Margaret Farrell | 8.1% | 525 | 537 | 549 | 555 | 580 | 828 | 943 | 1,412 | ||
Labour | Denis Mackin | 8% | 522 | 634 | 648 | 667 | 737 | 755 | 881 | 1,040 | 1,089 | |
Fianna Fáil | Michael Hanrahan | 7.2% | 468 | 479 | 505 | 511 | 523 | |||||
Green | Alison Larkin | 4.6% | 298 | 308 | 345 | 363 | ||||||
Fine Gael | Michael O'Brien | 3.4% | 224 | 228 | 228 | |||||||
Sinn Féin | Dessie Early | 2.4% | 157 | 162 | ||||||||
Electorate: 16,819 Valid: 6,540 (38.9%) Spoilt: 50 Quota: 1,319 Turnout: 6,590 (39.2%) |
Party | Candidate | FPv% | Count | |||||||||||
---|---|---|---|---|---|---|---|---|---|---|---|---|---|---|
1 | 2 | 3 | 4 | 5 | 6 | 7 | 8 | 9 | 10 | 11 | ||||
Independent | Guss O'Connell | 14.2% | 1,406 | 1,477 | 1,532 | 1,649 | 1,894 | 2,032 | ||||||
Fine Gael | Peter Brady | 13.5% | 1,336 | 1,346 | 1,472 | 1,549 | 1,587 | 1,612 | 1,619 | 1,775 | 1,812 | 1,987 | ||
Fianna Fáil | Finbarr Hanrahan* | 11.3% | 1,119 | 1,126 | 1,145 | 1,182 | 1,215 | 1,440 | 1,459 | 1,514 | 1,607 | 2,362 | ||
Fianna Fáil | Liam Lawlor TD* | 9.1% | 905 | 910 | 919 | 934 | 950 | 1,110 | 1,123 | 1,173 | 1,246 | |||
Labour | Eamon Tuffy | 8.3% | 826 | 829 | 834 | 927 | 1,000 | 1,026 | 1,030 | 1,211 | 1,263 | 1,315 | 1,430 | |
Sinn Féin | John McCann | 7.9% | 783 | 789 | 797 | 808 | 815 | 828 | 830 | 919 | ||||
Labour | John O'Halloran | 7.8% | 775 | 781 | 795 | 815 | 884 | 898 | 901 | 1,058 | 1,379 | 1,467 | 1,553 | |
Workers' Party | Anne Finnegan | 6.7% | 665 | 671 | 677 | 748 | 777 | 799 | 803 | |||||
Fianna Fáil | Deirdre Doherty-Ryan | 5.9% | 580 | 591 | 609 | 630 | 675 | |||||||
Labour | Michael Brennan | 5% | 497 | 534 | 563 | 598 | ||||||||
Green | Bridin O'Connor | 5% | 492 | 512 | 531 | |||||||||
Fine Gael | Tom Kavanagh | 3.1% | 311 | 316 | ||||||||||
Independent | Michael Kirwan | 2% | 200 | |||||||||||
Electorate: 20,266 Valid: 9,895 (48.8%) Spoilt: 75 Quota: 1,980 Turnout: 9,970 (49.2%) |
Party | Candidate | FPv% | Count | |||||||
---|---|---|---|---|---|---|---|---|---|---|
1 | 2 | 3 | 4 | 5 | 6 | 7 | ||||
Fianna Fáil | Ann Ormonde * | 19% | 1,582 | 1,584 | 1,601 | 1,872 | ||||
Fine Gael | Alan Shatter TD* | 14.3% | 1,191 | 1,202 | 1,241 | 1,286 | 1,303 | 1,538 | 1,671 | |
Green | Máire Mullarney | 14% | 1,163 | 1,176 | 1,289 | 1,313 | 1,327 | 1,511 | 1,877 | |
Fine Gael | Mary Muldoon* | 13.96% | 1,161 | 1,166 | 1,194 | 1,206 | 1,213 | 1,355 | 1,622 | |
Fianna Fáil | Damien Fee | 10.4% | 862 | 884 | 897 | 989 | 1,142 | 1,223 | 1,325 | |
Independent | Vincent Kenny | 9.1% | 760 | 767 | 832 | 842 | 849 | 944 | ||
Progressive Democrats | Ronnie McBrien | 8.6% | 719 | 721 | 760 | 778 | 788 | |||
Fianna Fáil | Stephen Riney* | 5.8% | 479 | 479 | 485 | |||||
Labour | Billy Byrne | 2.7% | 227 | 339 | ||||||
Labour | Graham Corcoran | 1.9% | 154 | |||||||
Electorate: 20,175 Valid: 8,318 (41.2%) Spoilt: 35 Quota: 1,664 Turnout: 8,353 (41.4%) |
Party | Candidate | FPv% | Count | ||||||||||
---|---|---|---|---|---|---|---|---|---|---|---|---|---|
1 | 2 | 3 | 4 | 5 | 6 | 7 | 8 | 9 | 10 | ||||
Fianna Fáil | John Hannon* | 22.3% | 1,572 | 1,579 | 1,590 | 1,663 | 1,684 | 1,915 | |||||
Workers' Party | Pat Rabbitte TD* | 13.5% | 947 | 967 | 980 | 994 | 1,066 | 1,102 | 1,125 | 1,255 | 1,472 | 1,736 | |
Progressive Democrats | Breda Cass* | 12.7% | 892 | 900 | 916 | 920 | 969 | 998 | 1,021 | 1,062 | 1,131 | 1,501 | |
Fine Gael | Senator Larry McMahon* | 11.2% | 789 | 799 | 889 | 912 | 942 | 964 | 988 | 1,009 | 1,083 | ||
Labour | Eamonn Maloney | 9.5% | 667 | 677 | 689 | 703 | 741 | 748 | 756 | 801 | |||
Labour | Ned Gibbons | 9.4% | 663 | 667 | 673 | 676 | 706 | 762 | 775 | 885 | 1,271 | 1,415 | |
Sinn Féin | Seán Crowe | 5.7% | 399 | 436 | 438 | 441 | 461 | 480 | 496 | ||||
Fianna Fáil | Jim Barry* | 5.5% | 389 | 394 | 395 | 430 | 434 | ||||||
Green | Malachy Murphy | 3.7% | 259 | 271 | 279 | 280 | |||||||
Fianna Fáil | Frank Dwan | 2.5% | 178 | 179 | 179 | ||||||||
Fine Gael | Paul Ringland | 2.2% | 158 | 159 | |||||||||
Republican Sinn Féin | Peter Cunningham | 1.8% | 125 | ||||||||||
Electorate: 14,687 Valid: 6,388 (43.5%) Spoilt: 89 Quota: 1,598 Turnout: 6,477 (44.1%) |
Party | Candidate | FPv% | Count | |||||||||
---|---|---|---|---|---|---|---|---|---|---|---|---|
1 | 2 | 3 | 4 | 5 | 6 | 7 | 8 | 9 | ||||
Workers' Party | Mick Billane | 20.3% | 1217 | 1,228 | 1,264 | 1,306 | 1,368 | 1,488 | 1,554 | |||
Fianna Fáil | Charlie O'Connor | 15.4% | 922 | 987 | 996 | 1,019 | 1,144 | 1,182 | 1,216 | 1,220 | 1,656 | |
Progressive Democrats | Catherine Quinn | 13.1% | 785 | 786 | 796 | 889 | 934 | 982 | 1,199 | 1,208 | 1,421 | |
Fianna Fáil | Jim Daly* | 12.3% | 741 | 757 | 759 | 764 | 783 | 832 | 904 | 914 | ||
Labour | Maria Ingle | 11.6% | 694 | 700 | 712 | 741 | 815 | 886 | 936 | 954 | 1,028 | |
Sinn Féin | Tony Flannery | 6.4% | 386 | 390 | 397 | 409 | 429 | |||||
Fine Gael | Pat Corcoran | 6.4% | 384 | 388 | 451 | 463 | 484 | 519 | ||||
Independent | John O'Mahony | 6% | 359 | 363 | 374 | 389 | ||||||
Progressive Democrats | Martin Smith | 3.7% | 224 | 226 | 248 | |||||||
Fine Gael | Jim Lovett | 2.9% | 177 | 178 | ||||||||
Fianna Fáil | Mary Morton | 1.9% | 114 | |||||||||
Electorate: 15,744 Valid: 6,003 (38.1%) Spoilt: 80 Quota: 1,501 Turnout: 6,083 (38.6%) |
Party | Candidate | FPv% | Count | ||||||||
---|---|---|---|---|---|---|---|---|---|---|---|
1 | 2 | 3 | 4 | 5 | 6 | 7 | 8 | ||||
Fine Gael | Stanley Laing* | 14.4% | 1,488 | 1,503 | 1,541 | 1,566 | 1,585 | 1,630 | 1,685 | 1,768 | |
Labour | Éamonn Walsh | 12.4% | 1,278 | 1,382 | 1,384 | 1,527 | 1,625 | 1,656 | 1,678 | 1,845 | |
Labour | Senator Pat Upton | 11.3% | 1,169 | 1,309 | 1,352 | 1,424 | 1,454 | 1,492 | 1,520 | 1,780 | |
Progressive Democrats | Cáit Keane | 10.9% | 1,128 | 1,159 | 1,173 | 1,218 | 1,267 | 1,317 | 1,376 | 1,542 | |
Fianna Fáil | Sean Ardagh * | 10.4% | 1,070 | 1,075 | 1,268 | 1,311 | 1,540 | 2,082 | |||
Fine Gael | Martin Lynch* | 9.5% | 981 | 992 | 1,014 | 1,037 | 1,051 | 1,081 | 1,096 | 1,163 | |
Green | Jim Murphy | 6.6% | 682 | 751 | 761 | 851 | 880 | 904 | 940 | ||
Fianna Fáil | Michael J. Stokes | 5.4% | 555 | 564 | 641 | 675 | 848 | ||||
Fianna Fáil | Molly Tighe | 5.3% | 550 | 559 | 615 | 671 | |||||
Independent | Seamus Ashe* | 5.1% | 532 | 561 | 566 | ||||||
Fianna Fáil | Gerry Mullally | 4.5% | 470 | 472 | |||||||
Workers' Party | Deirdre O'Connell | 4.2% | 430 | ||||||||
Electorate: 24,148 Valid: 10,333 (42.8%) Spoilt: 85 Quota: 1,723 Turnout: 10,418 (43.1%) |
South Dublin is a county in Ireland, within the province of Leinster and the Eastern and Midland Region. It is one of three successor counties to County Dublin, which was disestablished for administrative purposes in 1994. South Dublin County Council is the local authority for the county. The county contains both dense suburbs of Dublin and stretches of unpopulated mountain. In 2016 it had a population of 278,767, making it the third most populous county in the state.
Dublin County Council was a local authority for the administrative county of County Dublin in Ireland.
Dún Laoghaire–Rathdown is a county in Ireland. It is in the province of Leinster and the Eastern and Midland Region. It is one of three successor counties to County Dublin, which was disestablished in 1994. It is named after the former borough of Dún Laoghaire and the barony of Rathdown. Dún Laoghaire–Rathdown County Council is the local authority for the county. The population of the county was 218,018 at the time of the 2016 census.
Dublin South was a parliamentary constituency represented in Dáil Éireann, the lower house of the Irish parliament or Oireachtas, from 1981 to 2016 representing an area in the south of County Dublin. The method of election was proportional representation by means of the single transferable vote (PR-STV).
Dublin South-Central is a parliamentary constituency represented in Dáil Éireann, the lower house of the Irish parliament or Oireachtas. The constituency elects 4 deputies on the system of proportional representation by means of the single transferable vote (PR-STV).
Dublin South-West is a parliamentary constituency represented in Dáil Éireann, the lower house of the Irish parliament or Oireachtas. The constituency elects 5 deputies on the system of proportional representation by means of the single transferable vote (PR-STV).
Dún Laoghaire–Rathdown County Council is the authority responsible for local government in the county of Dún Laoghaire–Rathdown, Ireland. It is one of three local authorities that succeeded the former Dublin County Council on its abolition on 1 January 1994 and one of four councils in the old County Dublin. As a county council, it is governed by the Local Government Act 2001. The council is responsible for housing and community, roads and transportation, urban planning and development, amenity and culture, and environment. The council has 40 elected members. Elections are held every five years and are by single transferable vote. The head of the council has the title of Cathaoirleach (chairperson). The county administration is headed by a Chief Executive, Frank Curran. The county town is Dún Laoghaire. It serves a population of approximately 206,260.
Fingal County Council is the local authority of the county of Fingal, Ireland. It is one of three local authorities that succeeded the former Dublin County Council on abolition on 1 January 1994 and is one of four local authorities in County Dublin. As a county council, it is governed by the Local Government Act 2001. The council is responsible for housing and community, roads and transport, urban planning and development, amenity and culture, and environment. The council has 40 elected members. Elections are held every five years and are by single transferable vote. The head of the council has the title of Mayor. The county administration is headed by a Chief Executive, AnnMarie Farrelly. The county town is Swords.
South Dublin County Council is the authority responsible for local government in the county of South Dublin, Ireland. It is one of three local authorities created by the Local Government (Dublin) Act 1993 to succeed the former Dublin County Council before its abolition on 1 January 1994 and one of four councils in County Dublin. As a county council, it is governed by the Local Government Act 2001. The council is responsible for housing and community, roads and transportation, urban planning and development, amenity and culture, and environment. The council has 40 elected members. Elections are held every five years and are by single transferable vote. The head of the council has the title of Mayor. The county administration is headed by a Chief Executive, Daniel McLoughlin. The county town is Tallaght, with a civic centre at Monastery Road, Clondalkin. It serves a population of approximately 192,000.
The 1999 Irish local elections were held in all the counties, cities and towns of Ireland on Friday, 11 June 1999, on the same day as the European elections.
An election to Limerick County Council took place on 27 June 1991 as part of that year's Irish local elections. 28 councillors were elected from five local electoral areas (LEAs) for a five-year term of office on the electoral system of proportional representation by means of the single transferable vote (PR-STV). This term was extended twice, first to 1998, then to 1999.
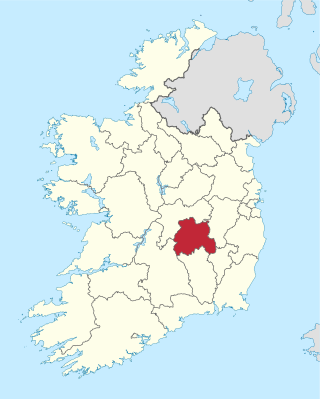
An election to Laois County Council took place on 27 June 1991 as part of that year's Irish local elections. 25 councillors were elected from five local electoral areas (LEAs) for a five-year term of office on the electoral system of proportional representation by means of the single transferable vote (PR-STV). This term was extended twice, first to 1998, then to 1999.
An election to South Tipperary County Council took place on 27 June 1991 as part of that year's Irish local elections. 26 councillors were elected from five local electoral areas (LEAs) for a five-year term of office on the electoral system of proportional representation by means of the single transferable vote (PR-STV). This term was extended twice, first to 1998, then to 1999.
An election to North Tipperary County Council took place on 27 June 1991 as part of that year's Irish local elections. 21 councillors were elected from four local electoral areas (LEAs) for a five-year term of office on the electoral system of proportional representation by means of the single transferable vote (PR-STV). This term was extended twice, first to 1998, then to 1999.
An election to Dublin County Council in the electoral county of Dún Laoghaire–Rathdown within Dublin County took place on 27 June 1991 as part of that year's Irish local elections. 28 councillors were elected from 7 local electoral areas on the system of proportional representation by means of the single transferable vote for a five-year term of office. It was one of three electoral counties within Dublin County at this election, the others being Fingal and South Dublin.
An election to Dublin City Council took place on 27 June 1991 as part of that year's Irish local elections. 52 councillors were elected from twelve local electoral areas (LEAs) for a five-year term of office on the electoral system of proportional representation by means of the single transferable vote (PR-STV). This term was extended twice, first to 1998, then to 1999.
An election to the electoral county of Fingal within Dublin County to Dublin County Council took place on 27 June 1991 as part of that year's Irish local elections. 24 councillors were elected for a five-year term of office from six local electoral areas (LEAs) on the system of proportional representation by means of the single transferable vote (PR-STV). It was one of three electoral counties within Dublin County at this election, the others being Dún Laoghaire–Rathdown and South Dublin. The term was extended twice, first to 1998, then to 1999.
An election to Dublin County Council took place on 20 June 1985 as part of that year's Irish local elections. Councillors were elected from local electoral areas by PR-STV voting for a six-year term of office.
An election to Dublin County Council took place on 27 June 1991 as part of that year's Irish local elections. Councillors were elected for a five-year term of office from local electoral areas (LEAs) on the system of proportional representation by means of the single transferable vote (PR-STV). It was the last election held for Dublin County Council.
Local government in Dublin, the capital city of Ireland, is currently administered through the local authorities of four local government areas. The historical development of these councils dates back to medieval times.