1991 Dublin City Council election

Last updated

1991 Dublin City Council election
Flag of Ireland.svg
  1985 27 June 1991 1999  

52 seats on Dublin City Council
 First partySecond partyThird party
 
Party Fianna Fáil Labour Fine Gael
Seats won20106
Seat changeDecrease2.svg 6Increase2.svg 8Decrease2.svg 7

 Fourth partyFifth partySixth party
 
Party Workers' Party Green Sinn Féin
Seats won541
Seat changeDecrease2.svg 1Increase2.svg 4Steady2.svg 0

 Seventh partyEighth party
 
Party Progressive Democrats Independent
Seats won15
Seat changeIncrease2.svg 1Increase2.svg 1

Dublin City in Ireland.svg
Map showing the area of Dublin City Council

Council control after election

Fianna Fáil
Workers Party

An election to Dublin City Council took place on 27 June 1991 as part of that year's Irish local elections. 52 councillors were elected from twelve local electoral areas (LEAs) for a five-year term of office on the electoral system of proportional representation by means of the single transferable vote (PR-STV). This term was extended twice, first to 1998, then to 1999. [1] [2]

Contents

Results by party

PartySeats±First Pref. votesFPv%±%
Fianna Fáil 20Decrease2.svg 649,21032.5
Labour 10Increase2.svg 819,38412.8
Fine Gael 6Decrease2.svg 721,94214.5
Workers' Party 5Decrease2.svg 114,2249.4
Green 4Increase2.svg 48,8865.9
Sinn Féin 1Steady2.svg 07,1044.7
Progressive Democrats 1Increase2.svg 15,0713.4
Independent 5Increase2.svg 125,44916.8
Totals52Steady2.svg 0151,270100.0

Results by local electoral area

Artane

Artane - 4 seats
PartyCandidateFPv%Count
123456789101112
Fianna Fáil Senator Seán Haughey *27.3%2,976           
Labour Paddy Bourke 11.3%1,2361,268 1,280 1,294 1,306 1,322 1,347 1,356 1,490 1,601 1,729 1,969
Sinn Féin Larry O'Toole10.4%1,1371,158 1,168 1,174 1,181 1,193 1,206 1,252 1,274 1,305 1,419 1,606
Labour Tommy Broughan 9.9%1,0831,124 1,140 1,164 1,174 1,195 1,262 1,282 1,373 1,445 1,583 2,073
Workers' Party John Curry8.2%896919 932 949 952 961 1,012 1,050 1,094 1,185 1,327  
Fianna Fáil Ita Green*7.5%8151,221 1,226 1,252 1,253 1,308 1,331 1,719 1,773 1,883 1,999 2,089
Independent Finian McGrath 4.7%509527 537 567 569 605 659 678 740 881   
Green Bronwen Maher 4.5%493505 516 534 537 581 620 638 720    
Fine Gael Kathy Moore3.2%354366 368 379 576 602 621 626     
Fianna Fáil Jim Howard3.2%348539 541 554 558 567 581      
Independent Joe Dowling2.5%277288 299 327 331 346       
Independent John O'Gorman2.3%248253 263 269 271       
Fine Gael Philip Marsh2.1%225231 233 249         
Independent Austin McCoy1.9%209217 222          
Independent Vincent Quinn1%110116           
Electorate: 26,692  Valid: 10,916 (40.9%)  Spoilt: 154  Quota: 2,184  Turnout: 11,070 (41.5%)  

    Ballyfermot

    Ballyfermot - 4 seats
    PartyCandidateFPv%Count
    123456789101112
    Labour Michael Conaghan 18.7%2,1302,137 2,197 2,240 2,270 2,297      
    Fianna Fáil Senator Olga Bennett *15.6%1,7741,852 1,896 1,906 1,943 2,220 2,263 2,322    
    Independent Vincent Jackson 13.8%1,5751,607 1,624 1,632 1,737 1,774 2,100 2,275 2,276 2,282  
    Workers' Party Tomas MacGiolla TD*8.3%949973 1,008 1,336 1,408 1,431 1,516 1,675 1,678 1,683 1,782 1,948
    Fine Gael Tom Corcoran6.1%694700 711 720 736 746 767 781 787 790 1,316 1,416
    Fine Gael Charlie McManus*6%680692 712 713 722 734 738 753 756 757   
    Fianna Fáil Gregg Craig5.5%627657 667 672 690 832 848 885 888 910 940  
    Sinn Féin Noel Kavanagh5%569578 590 605 629 636 678      
    Independent Marian Doyle4.3%495504 529 542 582 591       
    Fianna Fáil Michael Delaney*4.3%493536 541 544 569        
    Workers' Party Linda Kavanagh 3.7%423425 446          
    Independent Paul Guiden3.7%419440 451 457         
    Green Cecilia Armelin2.5%286287           
    Fianna Fáil Robert Ryan2%232           
    Independent Reginald Norton0.4%47           
    Electorate: 26,145  Valid: 11,393 (43.6%)  Spoilt: 138  Quota: 2,279  Turnout: 11,531 (44.1%)  

      Cabra

      Cabra- 3 seats
      PartyCandidateFPv%Count
      12345678910111213
      Fianna Fáil Dr. Dermot Fitzpatrick TD*16.5%1,8021,807 1,815 1,833 1,855 1,891 1,921 1,962 2,025 2,464 2,574 2,989 
      Fianna Fáil Patrick Farry*13.9%1,5161,518 1,524 1,541 1,557 1,571 1,591 1,628 1,693 2,033 2,154 2,433 2,600
      Fine Gael Jim Mitchell TD10.7%1,1641,169 1,175 1,188 1,206 1,455 1,497 1,558 1,584 1,618 1,698 2,004 2,071
      Independent Sean Clerkin10.4%1,1361,142 1,146 1,161 1,177 1,194 1,217 1,302 1,361 1,388 1,606   
      Fianna Fáil Willie O'Byrne8.5%922926 931 958 975 1,000 1,012 1,025 1,089     
      Labour Cecelia Rafferty7.2%786792 809 840 877 903 1,130 1,335 1,410 1,460 1,738 1,953 1,981
      Independent Sean Coultry7.1%770775 785 824 872 885 938 1,026 1,179 1,226    
      Sinn Féin Mick Finnegan5.5%603603 765 782 819 843 863 877      
      Green Joe Baker4.6%498509 514 529 569 579 638       
      Workers' Party Carol Tiernan4.2%453456 477 494 524 532        
      Fine Gael John Kearney3.5%386388 395 417 441         
      Independent Ambrose O'Shea2.5%275278 279           
      Independent Gaye McEvoy2.5%273282 284 328          
      Sinn Féin Anne Speed2.3%256259            
      Independent Brendan Price0.6%65            
      Electorate: 24,124  Valid: 10,905 (45.2%)  Spoilt: 108  Quota: 2,727  Turnout: 11,013 (45.7%)  

        Clontarf

        Clontarf - 5 seats
        PartyCandidateFPv%Count
        1234567891011
        Independent Sean Dublin Bay Rockall Loftus *18.4%3,411          
        Fianna Fáil Ivor Callely TD*15%2,7922,822 2,826 2,868 2,927 2,981 3,032 3,110   
        Fine Gael Richard Bruton TD12.9%2,3932,438 2,446 2,472 2,525 2,646 2,715 2,872 3,077 4,198 
        Fianna Fáil John Stafford TD*9.4%1,7471,766 1,773 1,794 1,840 1,867 1,898 1,966 2,224 2,413 2,539
        Fianna Fáil Joe Burke*9.2%1,7131,721 1,726 1,738 1,747 1,780 1,812 1,847 2,062 2,147 2,241
        Fine Gael Pat Lee TD*7.3%1,3611,387 1,394 1,411 1,446 1,469 1,490 1,558 1,721   
        Labour Derek McDowell 6.6%1,2251,247 1,254 1,287 1,315 1,374 1,792 2,156 2,343 2,461 2,827
        Independent Dominic Noonan5.6%1,0481,065 1,079 1,101 1,146 1,219 1,257 1,435    
        Workers' Party Triona Dooney4.1%767780 786 819 835 919      
        Green Steve Rawson3.9%725768 779 841 923 1,055 1,241     
        Independent Patricia Coonagh3%559576 586 625 670       
        Independent Gavin O Fiachain2%376413 417 470        
        Independent Kate Nugent1.9%348384 397         
        Independent Michael Reeves0.5%96100          
        Electorate: 37,155  Valid: 18,561 (50%)  Spoilt: 126  Quota: 3,094  Turnout: 18,687 (50.3%)  

          Crumlin

          Crumlin- 4 seats
          PartyCandidateFPv%Count
          12345678
          Fine Gael Gay Mitchell TD*21.8%2,287       
          Workers' Party Eric Byrne TD*19.9%2,0812,100      
          Labour Joe Connolly14.9%1,5571,573 1,585 1,648 1,759 1,879 1,912 2,328
          Fianna Fáil Ben Briscoe TD*14.1%1,4771,490 1,597 1,622 1,669 1,720 1,906 2,027
          Green Mary Bowers6%623631 633 727 774 930 946  
          Fianna Fáil Etain O'Moore5.9%617622 739 758 780 812 1,101 1,218
          Fianna Fáil Damien Murray4.3%453459 519 535 549 579   
          Independent Seamus Concannon3.8%401405 412 452 505    
          Sinn Féin Martin McGovern3.3%342345 349      
          Fianna Fáil Pat Tuffy3.2%332334       
          Fine Gael Ruairi McGinley2.9%299416 427 440     
          Electorate: 28,341  Valid: 10,469 (36.9%)  Spoilt: 138  Quota: 2,094  Turnout: 10,607 (37.4%)  

            Donaghmede

            Donaghmede - 5 seats
            PartyCandidateFPv%Count
            12345678910111213
            Fianna Fáil Liam Fitzgerald TD*19.6%2,894            
            Labour Seán Kenny *14.2%2,0972,147 2,177 2,205 2,211 2,295 2,709      
            Fianna Fáil Martin Brady 14.1%2,0862,247 2,304 2,567         
            Workers' Party Pat McCartan TD*8.3%1,2331,256 1,277 1,289 1,292 1,340 1,421 1,503 1,559 1,769 2,407 2,535 
            Green Sadhbh O'Neill 5.5%809820 861 886 891 1,036 1,086 1,140 1,230 1,395 1,503 1,755 1,787
            Fine Gael Brian Monaghan5.2%773840 874 994 1,071 1,130 1,148 1,156 1,219 1,307 1,357   
            Workers' Party Angela Loscher4.8%704707 720 736 737 753 818 871 886 946    
            Fine Gael Niamh Cosgrave 4.7%691700 716 733 734 838 886 906 1,376 1,487 1,548 1,751 1,785
            Independent Gerry Clerkin4.6%686699 745 754 755 779 811 828 847     
            Labour Ann Carter4.6%675689 700 718 720 751        
            Progressive Democrats Eamon Pitts4.4%648655 674 691 692         
            Fine Gael Barney McLoughlin4.3%643649 667 696 699 810 817 825      
            Fianna Fáil Rose Daly3.3%487547 567           
            Independent James Connolly2.5%372375            
            Electorate: 36,307  Valid: 14,798 (40.8%)  Spoilt: 146  Quota: 2,467  Turnout: 14,944 (41.2%)  

              Drumcondra

              Drumcondra - 5 seats
              PartyCandidateFPv%Count
              1234567891011121314
              Fianna Fáil Noel Ahern *19.4%2,745             
              Fianna Fáil Michael Barrett TD*13.4%1,9022,123 2,139 2,143 2,254 2,293 2,576       
              Labour Roisin Shortall 11.1%1,5791,593 1,603 1,615 1,623 1,673 1,697 1,711 1,749 1,806 1,852 2,446  
              Workers' Party Eamonn O'Brien*7.7%1,0911,096 1,106 1,328 1,352 1,370 1,376 1,379 1,397 1,423 1,581 1,861 1,913 2,012
              Fine Gael Brendan Brady6.8%964985 998 1,000 1,009 1,067 1,083 1,102 1,344 1,763 1,778 1,812 1,823 2,181
              Labour Desmond O'Malley6.7%942944 952 963 988 1,008 1,011 1,013 1,019 1,038 1,209    
              Independent Alice Glenn*6.4%909928 961 966 976 1,048 1,079 1,118 1,158 1,218 1,287 1,313 1,320  
              Green Dermot Hamilton6.4%900909 960 966 978 1,044 1,069 1,092 1,122 1,166 1,288 1,343 1,358 1,705
              Sinn Féin Eileen Murphy4.9%700713 715 721 743 748 759 767 771 773     
              Fine Gael Eddie Nolan3.7%518523 527 530 538 560 571 578 670      
              Fine Gael Tom Farrell3%432438 446 446 452 487 493 499       
              Progressive Democrats Terry Fitzpatrick2.9%407413 417 420 425          
              Fianna Fáil Mary Foley2.3%319375 376 377 440 453         
              Fianna Fáil Peter Lydon2.1%294309 312 313           
              Workers' Party Seán Ó Cionnaith 1.9%273274 280            
              Independent Brian Gormley0.7%105106             
              Independent Eamon Murphy0.6%7474             
              Electorate: 33,237  Valid: 14,164 (42.6%)  Spoilt: 144  Quota: 2,361  Turnout: 14,308 (43.1%)  

                Finglas

                Finglas - 4 seats
                PartyCandidateFPv%Count
                12345678910111213
                Fianna Fáil Pat Carey *23.1%2,774            
                Fine Gael Mary Flaherty TD*11.3%1,3591,393 1,399 1,408 1,471 1,492 1,542 1,588 1,604 1,689 1,741 1,887 2,237
                Fianna Fáil Tony Taaffe10.2%1,2281,312 1,318 1,323 1,332 1,344 1,377 1,446 1,462 1,506 1,616 2,147 2,393
                Labour Dr. Bill Tormey9.1%1,0901,113 1,115 1,118 1,129 1,152 1,167 1,181 1,208 1,306 1,444 1,513 1,808
                Progressive Democrats Barney Rock 7.8%940959 963 968 988 1,015 1,045 1,075 1,094 1,188 1,301 1,423  
                Sinn Féin Harry Fleming7.7%921942 945 954 955 962 967 983 997 1,032    
                Workers' Party Lucia O'Neill7.3%880896 897 908 915 921 933 941 1,295 1,459 1,655 1,758 1,889
                Fianna Fáil Pat Grant7.1%852923 930 936 938 949 991 1,117 1,133 1,169 1,266   
                Green Aidan Meagher4.6%550559 562 569 576 595 648 654 680     
                Workers' Party Samuel Jordan3.9%465477 482 490 491 501 509 518      
                Independent Lily Fisher2.1%258263 270 276 279 296        
                Fianna Fáil Noel Cloak2.1%251317 330 332 333 338 356       
                Independent Gerard Doolan1.2%147150 165 182 183         
                Fine Gael Miriam Wilson1.1%127129 130 131          
                Independent Billy Keegan0.7%8387 90           
                Independent Brendan Atkinson0.4%4546            
                Independent Frank Clarke0.3%3235            
                Electorate: 25,496  Valid: 12,002 (47.1%)  Spoilt: 125  Quota: 2,401  Turnout: 12,127 (47.6%)  

                  North Inner City

                  North Inner City - 5 seats
                  PartyCandidateFPv%Count
                  123456789
                  Independent Tony Gregory TD*32.2%4,094        
                  Fianna Fáil Tony Kett *12.2%1,5451,708 1,709 1,727 1,751 1,806 2,136  
                  Sinn Féin Christy Burke *11.3%1,4371,870 1,881 1,909 1,953 2,015 2,116 2,189 
                  Fianna Fáil Tom Stafford9.1%1,1531,329 1,341 1,352 1,392 1,455 1,585 1,657 1,812
                  Labour Joe Costello 8.7%1,1031,451 1,462 1,483 1,526 1,622 1,675 1,899 2,246
                  Workers' Party Mike Jennings5.6%711949 957 972 1,001 1,039 1,079 1,248 1,353
                  Fine Gael Deirdre Healy4.7%603702 711 864 880 941 964 1,063  
                  Fianna Fáil Ernie Beggs4.7%593681 684 694 701 759    
                  Green Patricia McKenna 3.9%499643 660 671 756 806 830   
                  Progressive Democrats Tom Allen3.1%396497 502 509 561     
                  Independent Tony Lowth2%257357 384 392      
                  Fine Gael Dave Kearney2%253290 292       
                  Independent Erick Dillon0.6%71118        
                  Electorate: 28,917  Valid: 12,715 (44%)  Spoilt: 171  Quota: 2,120  Turnout: 12,886 (44.6%)  

                    Pembroke

                    Pembroke - 4 seats
                    PartyCandidateFPv%Count
                    123456789101112
                    Independent Senator Carmencita Hederman *23%3,126           
                    Fianna Fáil Senator Eoin Ryan Jnr *13.1%1,7761,809 1,812 1,832 1,855 2,088 2,162 2,198 3,114   
                    Fine Gael Joe Doyle TD *12.3%1,6731,744 1,752 1,754 1,766 1,808 1,871 2,450 2,536 2,662 3,081 
                    Labour Dermot Lacey 10.9%1,4781,513 1,519 1,544 1,564 1,586 1,834 1,886 1,937 1,982 2,159 2,287
                    Green Claire Wheeler7.8%1,0601,136 1,153 1,238 1,264 1,295 1,431 1,491 1,541 1,655 2,179 2,324
                    Progressive Democrats Jeananne Crowley 7.7%1,0451,130 1,137 1,142 1,152 1,203 1,235 1,331 1,366 1,451   
                    Fianna Fáil Ciaran O'Loughlin6.3%857870 874 894 903 1,189 1,209 1,239     
                    Fine Gael William Egan6%814853 853 855 858 878 900      
                    Fianna Fáil Kathryn Byrne5.1%687710 714 726 730        
                    Workers' Party Tom Crilly3.6%486495 497 512 736 754       
                    Workers' Party Angie Murphy2.4%321327 329 339         
                    Sinn Féin Aengus O Snodaigh 1.6%220222 222          
                    Independent Jim Merriman0.3%4258           
                    Electorate: 33,502  Valid: 13,585 (40.5%)  Spoilt: 112  Quota: 2,740  Turnout: 13,697 (40.9%)  

                      Rathmines

                      Rathmines - 4 seats
                      PartyCandidateFPv%Count
                      123456789
                      Fianna Fáil Michael Donnelly *17.9%1,9851,994 1,996 2,036 2,158 2,209 2,262  
                      Progressive Democrats Liz O'Donnell 14.7%1,6351,641 1,650 1,671 1,695 1,723 1,797 1,890 2,154
                      Green John Gormley 11.7%1,3021,312 1,356 1,427 1,435 1,457 1,511 1,801 1,974
                      Labour Mary Freehill 10.7%1,1881,194 1,213 1,261 1,268 1,301 1,376 1,942 2,082
                      Workers' Party Jim Allen10%1,1131,116 1,130 1,173 1,182 1,211 1,242   
                      Fianna Fáil Mary Hanafin*9.7%1,0831,086 1,090 1,097 1,225 1,249 1,282 1,381  
                      Fine Gael Senator Maurice Manning*7%777777 778 788 791 999 1,559 1,605 1,742
                      Fine Gael Terry Cosgrave6.8%757760 764 784 787 901    
                      Fine Gael Michael McShane*4.6%507508 509 518 522     
                      Fianna Fáil Derek Mooney2.8%309312 312 317      
                      Independent Padraig Chambers2.3%256283 304       
                      Independent Mick Canning1.1%118122        
                      Independent Harry Richards0.73%81        
                      Electorate: 30,397  Valid: 11,111 (36.6%)  Spoilt: 103  Quota: 2,223  Turnout: 11,214 (36.9%)  

                        South Inner City

                        South Inner City - 5 seats
                        PartyCandidateFPv%Count
                        123456789
                        Fianna Fáil Michael Mulcahy *11.5%1,2231,224 1,228 1,250 1,387 1,430 1,488 1,602 1,688
                        Labour Ruairi Quinn TD11.4%1,2151,216 1,221 1,261 1,276 1,369 1,456 1,595 1,880
                        Independent Brendan Lynch *10.9%1,1651,171 1,181 1,208 1,221 1,230 1,405 1,518 1,663
                        Green Ciarán Cuffe 10.7%1,1411,143 1,150 1,186 1,197 1,227 1,350 1,550 1,789
                        Fianna Fáil Mary Mooney *10.3%1,1021,104 1,106 1,136 1,355 1,398 1,523 1,616 1,717
                        Sinn Féin Micheal O Muireagain8.5%909909 915 918 924 966 1,042   
                        Fine Gael Peter Burke*7.6%812812 817 1,024 1,030 1,050 1,102 1,136  
                        Independent John Gallagher*7.4%788789 800 808 820 823    
                        Workers' Party Brian O'Connor7.3%778779 781 789 792 1,112 1,194 1,359 1,422
                        Workers' Party Andrew Smith*5.6%600601 604 610 611     
                        Fianna Fáil Gerry Dunne4%429432 434 444      
                        Fine Gael Bernadette Gray3.7%396396 405       
                        Independent Christy Doyle0.7%7173        
                        Independent Jim Merriman0.2%22        
                        Electorate: 28,161  Valid: 10,651 (37.8%)  Spoilt: 204  Quota: 1,776  Turnout: 10,855 (38.6%)  

                          Related Research Articles

                          <span class="mw-page-title-main">1991 Sligo County Council election</span> Part of the 1991 Irish local elections

                          An election to Sligo County Council took place on 27 June 1991 as part of that year's Irish local elections. 25 councillors were elected from five local electoral areas (LEAs) for a five-year term of office on the electoral system of proportional representation by means of the single transferable vote (PR-STV). This term was extended twice, first to 1998, then to 1999.

                          <span class="mw-page-title-main">1991 Leitrim County Council election</span> Part of the 1991 Irish local elections

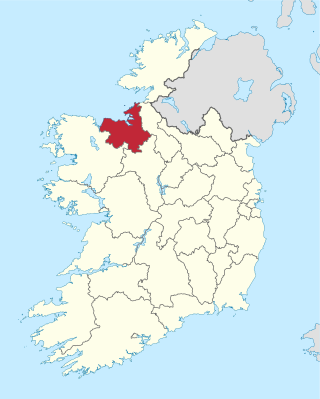
                          An election to Leitrim County Council took place on 27 June 1991 as part of that year's Irish local elections. 22 councillors were elected from four local electoral areas (LEAs) for a five-year term of office on the electoral system of proportional representation by means of the single transferable vote (PR-STV). This term was extended twice, first to 1998, then to 1999.

                          <span class="mw-page-title-main">1991 Roscommon County Council election</span> Part of the 1991 Irish local elections

                          An election to Roscommon County Council took place on 27 June 1991 as part of that year's Irish local elections. 26 councillors were elected from six local electoral areas (LEAs) for a five-year term of office on the electoral system of proportional representation by means of the single transferable vote (PR-STV). This term was extended twice, first to 1998, then to 1999.

                          <span class="mw-page-title-main">1991 Galway County Council election</span> Part of the 1991 Irish local elections

                          An election to Galway County Council took place on 27 June 1991 as part of that year's Irish local elections. 30 councillors were elected from five local electoral areas (LEAs) for a five-year term of office on the electoral system of proportional representation by means of the single transferable vote (PR-STV). This term was extended twice, first to 1998, then to 1999.

                          <span class="mw-page-title-main">1991 Mayo County Council election</span> Part of the 1991 Irish local elections

                          An election to Mayo County Council took place on 27 June 1991 as part of that year's Irish local elections. 31 councillors were elected from seven local electoral areas (LEAs) for a five-year term of office on the electoral system of proportional representation by means of the single transferable vote (PR-STV). This term was extended twice, first to 1998, then to 1999.

                          <span class="mw-page-title-main">1991 Monaghan County Council election</span> Part of the 1991 Irish local elections

                          An election to Monaghan County Council took place on 27 June 1991 as part of that year's Irish local elections. 20 councillors were elected from four local electoral areas (LEAs) for a five-year term of office on the electoral system of proportional representation by means of the single transferable vote (PR-STV). This term was extended twice, first to 1998, then to 1999.

                          <span class="mw-page-title-main">1991 Clare County Council election</span> Part of the 1991 Irish local elections

                          An election to Clare County Council took place on 10 June 1999 as part of that year's Irish local elections. 32 councillors were elected from six local electoral areas (LEAs) for a five-year term of office on the electoral system of proportional representation by means of the single transferable vote (PR-STV). This term was extended twice, first to 1998, then to 1999.

                          <span class="mw-page-title-main">1991 Limerick City Council election</span> Part of the 1991 Irish local elections

                          An election to Limerick City Council took place on 27 June 1991 as part of that year's Irish local elections. 17 councillors were elected from four local electoral areas (LEAs) for a five-year term of office on the electoral system of proportional representation by means of the single transferable vote (PR-STV). This term was extended twice, first to 1998, then to 1999.

                          <span class="mw-page-title-main">1991 Kerry County Council election</span> Part of the 1991 Irish local elections

                          An election to Kerry County Council took place on 27 June 1991 as part of that year's Irish local elections. 27 councillors were elected from five local electoral areas (LEAs) for a five-year term of office on the electoral system of proportional representation by means of the single transferable vote (PR-STV). This term was extended twice, first to 1998, then to 1999.

                          <span class="mw-page-title-main">1991 Offaly County Council election</span> Part of the 1991 Irish local elections

                          An election to Offaly County Council took place on 27 June 1991 as part of that year's Irish local elections. 21 councillors were elected from five local electoral areas (LEAs) for a five-year term of office on the electoral system of proportional representation by means of the single transferable vote (PR-STV). This term was extended twice, first to 1998, then to 1999.

                          <span class="mw-page-title-main">1991 Westmeath County Council election</span> Part of the 1991 Irish local elections

                          An election to Westmeath County Council took place on 27 June 1991 as part of that year's Irish local elections. 23 councillors were elected from five local electoral areas (LEAs) for a five-year term of office on the electoral system of proportional representation by means of the single transferable vote (PR-STV). This term was extended twice, first to 1998, then to 1999.

                          <span class="mw-page-title-main">1991 Meath County Council election</span> Part of the 1991 Irish local elections

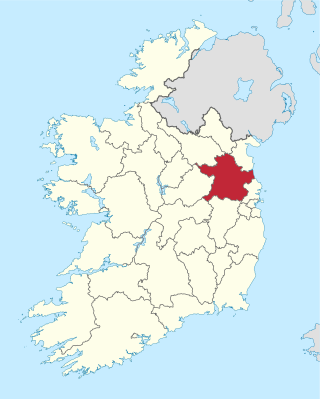
                          An election to Meath County Council took place on 27 June 1991 as part of that year's Irish local elections. 29 councillors were elected from five local electoral areas (LEAs) for a five-year term of office on the electoral system of proportional representation by means of the single transferable vote (PR-STV). This term was extended twice, first to 1998, then to 1999.

                          <span class="mw-page-title-main">1991 Kildare County Council election</span> Part of the 1991 Irish local elections

                          An election to Kildare County Council took place on 27 June 1991 as part of that year's Irish local elections. 25 councillors were elected from six local electoral areas (LEAs) for a five-year term of office on the electoral system of proportional representation by means of the single transferable vote (PR-STV). This term was extended twice, first to 1998, then to 1999.

                          <span class="mw-page-title-main">1991 Carlow County Council election</span> Part of the 1991 Irish local elections

                          An election to Carlow County Council took place on 27 June 1991 as part of that year's Irish local elections. 21 councillors were elected from four local electoral areas (LEAs) for a five-year term of office on the electoral system of proportional representation by means of the single transferable vote (PR-STV). This term was extended twice, first to 1998, then to 1999.

                          <span class="mw-page-title-main">1991 Kilkenny County Council election</span> Part of the 1991 Irish local elections

                          An election to Kilkenny County Council took place on 27 June 1991 as part of that year's Irish local elections. 26 councillors were elected from five local electoral areas (LEAs) for a five-year term of office on the electoral system of proportional representation by means of the single transferable vote (PR-STV). This term was extended twice, first to 1998, then to 1999.

                          <span class="mw-page-title-main">1991 Dublin County Council election in Dún Laoghaire–Rathdown</span> Part of the 1991 Irish local elections

                          An election to Dublin County Council in the electoral county of Dún Laoghaire–Rathdown within Dublin County took place on 27 June 1991 as part of that year's Irish local elections. 28 councillors were elected from 7 local electoral areas on the system of proportional representation by means of the single transferable vote for a five-year term of office. It was one of three electoral counties within Dublin County at this election, the others being Fingal and South Dublin.

                          <span class="mw-page-title-main">1991 Dublin County Council election in South Dublin</span> Part of the 1991 Irish local elections

                          An election to the council of the electoral county of South Dublin within Dublin County to Dublin County Council took place on 27 June 1991 as part of that year's Irish local elections. 26 councillors were elected for a five-year term of office from five local electoral areas on the system of proportional representation by means of the single transferable vote. It was one of three electoral counties within Dublin County at this election, the others being Fingal and Dún Laoghaire–Rathdown. The term was extended twice, first to 1998, then to 1999.

                          <span class="mw-page-title-main">1991 Dublin County Council election in Fingal</span> Part of the 1991 Irish local elections

                          An election to the electoral county of Fingal within Dublin County to Dublin County Council took place on 27 June 1991 as part of that year's Irish local elections. 24 councillors were elected for a five-year term of office from six local electoral areas (LEAs) on the system of proportional representation by means of the single transferable vote (PR-STV). It was one of three electoral counties within Dublin County at this election, the others being Dún Laoghaire–Rathdown and South Dublin. The term was extended twice, first to 1998, then to 1999.

                          <span class="mw-page-title-main">1991 Cork City Council election</span> Part of the 1991 Irish local elections

                          An election to Cork City Council took place on 27 June 1991 as part of that year's Irish local elections. 31 councillors were elected from six local electoral areas (LEAs) for a five-year term of office on the electoral system of proportional representation by means of the single transferable vote (PR-STV). This term was extended twice, first to 1998, then to 1999.

                          An election to Dublin County Council took place on 27 June 1991 as part of that year's Irish local elections. Councillors were elected for a five-year term of office from local electoral areas (LEAs) on the system of proportional representation by means of the single transferable vote (PR-STV). It was the last election held for Dublin County Council.

                          References

                          1. Local Government Act 1994, s. 20: Year of elections to all local authorities ( No. 8 of 1994, s. 20 ). Enacted on 29 April 1994. Act of the Oireachtas .Retrieved from Irish Statute Book .
                          2. Local Government Act 1998, s. 10: Amendment of section 20 of Act of 1994 ( No. 16 of 1998, s. 10 ). Enacted on 29 May 1998. Act of the Oireachtas .Retrieved from Irish Statute Book .