Elections in Mexico are held every 6 years to elect a president and every 3 years to elect a legislature. These elections determine who, on the national level, takes the position of the head of state – the president – as well as the legislature.

In the politics of the United States, elections are held for government officials at the federal, state, and local levels. At the federal level, the nation's head of state, the president, is elected indirectly by the people of each state, through an Electoral College. Today, these electors almost always vote with the popular vote of their state. All members of the federal legislature, the Congress, are directly elected by the people of each state. There are many elected offices at state level, each state having at least an elective governor and legislature. There are also elected offices at the local level, in counties, cities, towns, townships, boroughs, and villages; as well as for special districts and school districts which may transcend county and municipal boundaries.
At a national level, Greece holds elections for its legislature, the Hellenic Parliament.

Elections in Spain encompass four different types: general elections, regional elections, local elections, and elections to the European Parliament. General elections and regional elections are typically conducted at the conclusion of the national or regional legislative mandate, which usually spans four years since the previous election. However, early elections can be called in certain circumstances. On the other hand, local council elections and elections to the European Parliament follow fixed dates, although some local government bodies, such as provincial councils, are not directly elected. In most elections, a party-list proportional representation (PR) system is employed, while the Senate utilizes the plurality system.
In electoral systems, voter registration is the requirement that a person otherwise eligible to vote must register on an electoral roll, which is usually a prerequisite for being entitled or permitted to vote.

Romania elects on a national level a head of state – the president – and a legislature. The president is elected for a five-year term by the people. The Romanian Parliament has two chambers. The Chamber of Deputies has currently 330 members, elected for a four-year term by party-list proportional representation on closed lists. The Senate has currently 136 members, elected for a four-year term by party-list proportional representation on closed lists.
Under the Iraqi constitution of 1925, Iraq was a constitutional monarchy, with a bicameral legislature consisting of an elected House of Representatives and an appointed Senate. The lower house was elected every four years by manhood suffrage. The first Parliament met in 1925. Ten general elections were held before the overthrow of the monarchy in 1958.

Elections in Portugal are free, fair, and regularly held, in accordance with election law.

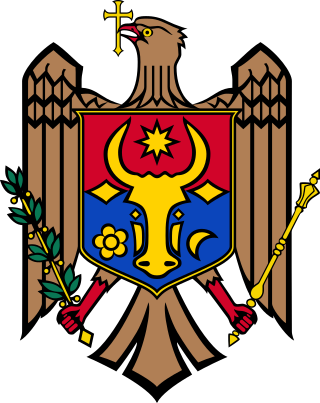
Moldova elects a legislature at national level. The Parliament (Parlamentul) has 101 members, elected for a four-year term by proportional representation with a 6% electoral threshold. The President used to be elected for a four-year term by a constitutional majority of 60% members of the Parliament, but a Constitutional Court's ruling on 4 March 2016, reverted the election method of the President to a two-round system direct election.

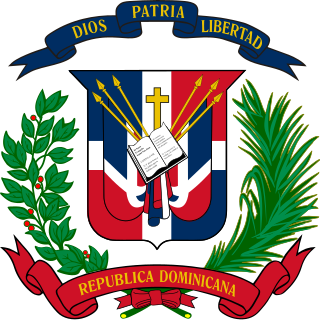
The Dominican Republic is a unitary state with elected officials at the national and local levels. On a national level, head of state, the President, is elected directly by the people. All members of a national legislature, The Congress of the Republic divided in two chambers. The Chamber of Deputies and the Senate. There are also elected offices at the local level. It is estimated that across the whole country, over four thousand offices are filled in every electoral cycle.
An electoral roll is a compilation that lists persons who are entitled to vote for particular elections in a particular jurisdiction. The list is usually broken down by electoral districts, and is primarily prepared to assist election officials at polling places. Most jurisdictions maintain permanent electoral rolls, which are updated continuously or periodically, while some jurisdictions compile new electoral rolls before each election. Electoral rolls are the result of a process of voter registration. In most jurisdictions, voter registration is a prerequisite for voting at an election. Some jurisdictions do not require voter registration, and do not use electoral rolls, such as the state of North Dakota in the United States. In those jurisdictions a voter must provide identification and proof of entitlement to vote before being permitted to vote.
In various parliamentary systems, a returning officer is responsible for overseeing elections in one or more constituencies.
The wards and electoral divisions in the United Kingdom are electoral districts at sub-national level, represented by one or more councillors. The ward is the primary unit of English electoral geography for civil parishes and borough and district councils, the electoral ward is the unit used by Welsh principal councils, while the electoral division is the unit used by English county councils and some unitary authorities. Each ward/division has an average electorate of about 5,500 people, but ward population counts can vary substantially. As of 2021 there are 8,694 electoral wards/divisions in the UK. An average area of wards in the United Kingdom is 27 km2.

The election of the president and the vice president of the United States is an indirect election in which citizens of the United States who are registered to vote in one of the fifty U.S. states or in Washington, D.C., cast ballots not directly for those offices, but instead for members of the Electoral College. These electors then cast direct votes, known as electoral votes, for president, and for vice president. The candidate who receives an absolute majority of electoral votes is then elected to that office. If no candidate receives an absolute majority of the votes for president, the House of Representatives elects the president; likewise if no one receives an absolute majority of the votes for vice president, then the Senate elects the vice president.

There are five types of elections in the United Kingdom: elections to the House of Commons of the United Kingdom, elections to devolved parliaments and assemblies, local elections, mayoral elections, and Police and Crime Commissioner elections. Within each of those categories, there may also be by-elections. Elections are held on Election Day, which is conventionally a Thursday, and under the provisions of the Dissolution and Calling of Parliament Act 2022 the timing of general elections can be held at the discretion of the prime minister during any five-year period. All other types of elections are held after fixed periods, though early elections to the devolved assemblies and parliaments can occur in certain situations. The five electoral systems used are: the single member plurality system (first-past-the-post), the multi-member plurality, the single transferable vote, the additional member system, and the supplementary vote.

The 2012 United Kingdom local elections were held across England, Scotland and Wales on 3 May 2012. Elections were held in 128 English local authorities, all 32 Scottish local authorities and 21 of the 22 Welsh unitary authorities, alongside three mayoral elections including the London mayoralty and the London Assembly. Referendums were also held in 11 English cities to determine whether or not to introduce directly elected mayors.
Council elections for the City of Preston, Lancashire were held on 22 May 2014 as part of the 2014 United Kingdom local elections. The elections have been moved from earlier on in May to coincide with the North West component of the 2014 European Parliament election. Nineteen electoral wards were fought with those councillors elected in the corresponding elections in 2010 defending their seats due to the "in thirds" system employed in Preston local elections. The previous elections to Preston council occurred in 2012 but due to the "in thirds" system employed by Preston council, councillors are elected for four-year terms. This means gains, losses, and vote share comparisons this year are with those fought in 2010.

An election to Derbyshire County Council took place on 4 May 2017 as part of the 2017 United Kingdom local elections. 64 councillors were elected from 61 electoral divisions which returned either one or two county councillors each by first-past-the-post voting for a four-year term of office. No elections were held in the City of Derby, which is a unitary authority outside the area covered by the County Council. The Conservative Party won back control of the council, taking thirty-seven of the authority's sixty-four seats.

The 2017 Hertfordshire County Council election took place on 4 May 2017 as part of the 2017 local elections in the United Kingdom. All 78 councillors were elected from electoral divisions which returned one county councillor each by first-past-the-post voting for a four-year term of office.

The 2019 United Kingdom local elections took place on Thursday 2 May 2019, with 248 English local councils, six directly elected mayors in England, and all 11 local councils in Northern Ireland being contested.


