2004 Galway County Council election

Last updated

2004 Galway County Council election
Flag of Ireland.svg
  1999 11 June 2004 2009  

All 30 seats on Galway County Council
 First partySecond partyThird party
 
Party Fianna Fáil Fine Gael Progressive Democrats
Seats won10103
Seat change-6+1+1

 Fourth partyFifth partySixth party
 
Party Sinn Féin Labour Independent
Seats won115
Seat change+1+1+2

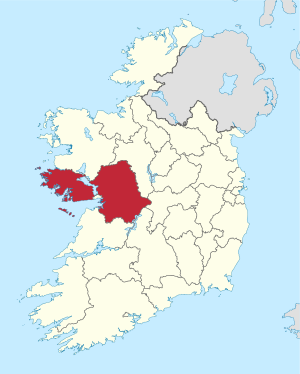
Galway in Ireland.svg
Map showing the area of Galway County Council

Council control after election

TBD

An election to Galway County Council took place on 11 June 2004 as part of that year's Irish local elections. 30 councillors were elected from five local electoral areas by PR-STV voting for a five-year term of office.

Contents

Results by party

PartySeats±First Pref. votesFPv%±%
Fianna Fáil 10-626,01734.54
Fine Gael 10+121,13328.06
Progressive Democrats 3+16,8009.03
Sinn Féin 1+13,0404.04
Labour 1+12,5423.37
Independent 5+214,16418.81
Totals30-75,320100.00

Results by local electoral area

Ballinasloe

Ballinasloe - 5 seats
PartyCandidateFPv%Count
1234567
Fine Gael Michael Mullins *15.111,7251,772 1,914    
Fianna Fáil Tomás Mannion*12.531,4311,520 1,536 1,682 1,868 2,298 
Fianna Fáil James Joyce*10.671,2191,244 1,274 1,299 1,496 1,782 1,915
Sinn Féin Dermot Connolly9.681,1051,164 1,288 1,327 1,491 1,658 1,693
Independent Padraic McGann9.481,0831,169 1,204 1,350 1,405 1,524 1,591
Fine Gael Joe Tierney9.071,0361,059 1,099 1,380 1,530 1,651 1,680
Fianna Fáil Martin Gormally*8.689911,055 1,075 1,190 1,387   
Fianna Fáil Pat O'Sullivan*7.78889921 1,061 1,096    
Fine Gael Michael Kilgannon7.36841873 881     
Independent Johnny Walsh5.17590613      
Fianna Fáil Anne Ruane-Devilly2.38272      
Independent Ann Marie Kelly2.08238      
Electorate: 18,346  Valid: 11,420 (62.25%)  Spoilt: 202  Quota: 1,904  Turnout: 11,622 (63.35%)  

    Connemara

    Connemara - 7 seats
    PartyCandidateFPv%Count
    12345678910111213141516
    Independent Seamus Walsh*9.061,5111,517 1,528 1,533 1,561 1,607 1,702 1,766 1,814 1,985 2,109     
    Fianna Fáil Seán Ó Tuairisg*8.261,3771,378 1,409 1,412 1,416 1,441 1,518 1,783 1,811 1,837 1,891 2,080 2,080 2,248  
    Independent Seosamh Ó Cuaig 7.971,3281,331 1,404 1,409 1,428 1,518 1,619 1,623 1,693 1,720 1,962 1,974 1,983 2,253  
    Fianna Fáil Connie Ní Fhatharta*7.501,2501,252 1,294 1,299 1,320 1,360 1,460 1,495 1,515 1,551 1,627 1,785 1,788 1,993 2,038 2,082
    Fianna Fáil Josie Conneely*7.291,2161,269 1,283 1,323 1,329 1,333 1,338 1,390 1,503 1,517 1,527 1,618 1,618 1,652 1,661 1,673
    Progressive Democrats Thomas Welby 6.661,1101,114 1,121 1,130 1,149 1,156 1,256 1,310 1,337 1,441 1,488 1,809 1,814 1,915 1,932 1,941
    Fine Gael Eileen Mannion-Mullen6.621,1041,141 1,146 1,267 1,282 1,328 1,338 1,390 1,503 1,517 1,527 1,618 1,618 1,652 1,661 1,673
    Republican Sinn Féin Tomás Ó Curraoin6.461,0761,077 1,084 1,084 1,100 1,122 1,145 1,150 1,203 1,228 1,284 1,343 1,345    
    Fianna Fáil Pierce O'Malley*5.56927930 943 951 962 964 971 1,047 1,068 1,178 1,191      
    Fine Gael Seán Kyne 5.18864866 869 918 945 1,004 1,014 1,024 1,042 1,307 1,386 1,530 1,533 1,673 1,688 1,700
    Independent Seamus Gavin*4.82804808 811 811 847 849 854 859 885        
    Fianna Fáil Michael Walsh3.94657658 665 678 682 683 684          
    Labour Trevor Ó Clochartaigh 3.71619621 638 644 749 798 854 858 931 962       
    Sinn Féin Pam Conroy3.66610629 632 695 722 727 738 752         
    Progressive Democrats Jimi Ó Lorcáin3.46577578 587 590 608 652           
    Fine Gael Caroline Uí Rainne2.72454454 456 463 472            
    Green Diarmuid Mulcahy2.32387389 392 399             
    Fine Gael Ronan Conboy2.18364369 370              
    Fianna Fáil Tomás Ó Briain1.61271274               
    Independent Joseph Joyce0.98163               
    Electorate: 28,882  Valid: 16,669 (57.71%)  Spoilt: 336  Quota: 2,084  Turnout: 17,005 (58.88%)  

      Loughrea

      Loughrea - 7 seats
      PartyCandidateFPv%Count
      123456789
      Fianna Fáil Michael (Stroke) Fahy *11.592,0042,041 2,127 2,170     
      Independent Pat Hynes*10.951,8942,030 2,114 2,283     
      Fine Gael Bridie Willers10.031,7351,792 1,935 1,971 2,001 2,022 2,102 2,402 
      Independent Willie Burke9.781,6921,719 1,782 1,830 2,060 2,067 2,100 2,165 
      Fine Gael Peter Feeney *8.261,4281,449 1,491 1,498 1,508 1,508 1,807 1,854 1,878
      Progressive Democrats Ciarán Cannon 7.561,3071,353 1,384 1,477 1,523 1,548 1,744 1,837 1,874
      Fine Gael Jimmy McClearn*7.401,2801,297 1,303 1,326 1,503 1,514 1,533 1,548 1,577
      Fianna Fáil Michael Regan*6.531,1291,154 1,165 1,304 1,535 1,582 1,764 2,207 
      Fianna Fáil Michael Cunningham*6.221,0761,095 1,180 1,195 1,235 1,237 1,440   
      Fianna Fáil Moira Coen5.66978999 1,034 1,111 1,166 1,174    
      Fianna Fáil Adrian Cummins4.70813821 830 909      
      Fianna Fáil Gabriel Burke4.28741772 779       
      Independent Adrian Feeney3.74647695        
      Sinn Féin Eoghan Mac Cormaic3.30570        
      Electorate: 28,098  Valid: 17,294 (61.55%)  Spoilt: 278  Quota: 2,162  Turnout: 17,572 (62.54%)  

        Oranmore

        Oranmore - 4 seats
        PartyCandidateFPv%Count
        1234
        Fianna Fáil Mary Hoade*21.712,567   
        Fine Gael Jarlath McDonagh *16.972,0062,027 2,202 2,496
        Progressive Democrats Jim Cuddy*16.421,9411,959 2,081 2,203
        Fine Gael Fidelma Healy Eames 13.801,6321,644 1,782 2,288
        Fianna Fáil Tim Rabbitt*13.581,6061,678 1,810 1,950
        Fine Gael Michael Carey10.651,2591,327 1,388  
        Independent David Collins3.46409414   
        Sinn Féin Cillian Morris3.41403409   
        Electorate: 19,286  Valid: 11,823 (61.30%)  Spoilt: 159  Quota: 2,365  Turnout: 11,982 (62.13%)  

          Tuam

          Tuam - 7 seats
          PartyCandidateFPv%Count
          123456789
          Fine Gael Sinead Connaughton*11.212,0302,103 2,404      
          Labour Colm Keaveney 10.601,9232,042 2,057 2,061 2,115 2,171 2,382  
          Fine Gael Tiernan Walsh*10.041,8181,835 1,880 1,893 1,977 1,990 2,065 2,068 2,440
          Fine Gael Tom McHugh *8.601,5571,583 1,600 1,615 1,668 1,742 1,963 2,000 2,073
          Fianna Fáil Michael Connolly*8.441,5281,569 1,657 1,681 2,089 2,198 2,264 2,271 
          Independent Seán Canney *8.191,4831,542 1,565 1,568 1,644 1,886 2,008 2,031 2,113
          Independent Peter Roche 7.091,2841,377 1,399 1,403 1,485 1,524 1,607 1,622 1,677
          Fianna Fáil Tom Reilly6.091,1041,135 1,141 1,142 1,159 1,325 1,489 1,519 1,862
          Fianna Fáil Patrick O'Brien5.601,0141,029 1,039 1,042 1,057     
          Progressive Democrats Seamus Quinn*5.38974999 1,096 1,107 1,133 1,207    
          Fianna Fáil Kathleen Quinn*5.28957967 1,100 1,143 1,220 1,376 1,437 1,439  
          Progressive Democrats Pat Gilmore4.92891901        
          Independent Pat Donnellan4.74858914 973 991      
          Sinn Féin Caitlin Glavey1.94352        
          Independent Seán Hehir0.99180        
          Green Siobhan Nevin0.89161        
          Electorate: 28,853  Valid: 18,114 (62.78%)  Spoilt: 283  Quota: 2,265  Turnout: 18,397 (63.76%)  

            Related Research Articles

            In many countries, a mayor is the highest-ranking official in a municipal government such as that of a city or a town. Worldwide, there is a wide variance in local laws and customs regarding the powers and responsibilities of a mayor as well as the means by which a mayor is elected or otherwise mandated. Depending on the system chosen, a mayor may be the chief executive officer of the municipal government, may simply chair a multi-member governing body with little or no independent power, or may play a solely ceremonial role. A mayor's duties and responsibilities may be to appoint and oversee municipal managers and employees, provide basic governmental services to constituents, and execute the laws and ordinances passed by a municipal governing body. Options for selection of a mayor include direct election by the public, or selection by an elected governing council or board.

            <span class="mw-page-title-main">Member of the Senedd</span> Representative in the devolved parliament of Wales

            A member of the Senedd is a representative elected to the Senedd. There are sixty members, with forty members chosen to represent individual Senedd constituencies, and twenty to represent the five electoral regions of the Senedd in Wales.
            <span class="mw-page-title-main">Elections in Mauritania</span>

            Elections in Mauritania encompass four different types: presidential elections, parliamentary elections, regional elections and local elections.

            <span class="mw-page-title-main">Elections in Mexico</span>

            Elections in Mexico are held for officials at federal, state, and municipal levels. At the federal level, the nation's head of state, the president, is directly elected with the popular vote by all Mexican citizens for a six-year non-renewable term. All members of the bicameral federal legislature, the Congress of the Union, are also elected by all Mexican citizens. At the state level, each state has an elective governor and unicameral congress. At the municipal level, the municipal presidents are also elected by their citizens. Since 2016, a constitutional amendment has designed Mexico City to be a fully autonomous entity on par with the states. Its city mayor, city congress, and borough mayors are elected by their citizens in a similar fashion to those states.

            Romania elects on a national level a head of state – the president – and a legislature. The president is elected for a five-year term by the people. The Romanian Parliament has two chambers. The Chamber of Deputies has currently 330 members, elected for a four-year term by party-list proportional representation on closed lists. The Senate has currently 136 members, elected for a four-year term by party-list proportional representation on closed lists.

            <span class="mw-page-title-main">Elections in Portugal</span>

            Elections in Portugal are free, fair, and regularly held, in accordance with election law.

            Elections in Tanzania occur on both the local and national levels. The local government holds elections for street or village chair people. General elections at the national level elect the President and the members of the National Assembly. The president is elected for a five-year term.

            <span class="mw-page-title-main">Elections in South Korea</span>

            Elections in South Korea are held on a national level to select the President and the National Assembly. Local elections are held every four years to elect governors, metropolitan mayors, municipal mayors, and provincial and municipal legislatures.

            <span class="mw-page-title-main">Elections in Malta</span>

            Malta elects on a national level 6 MEPs representing Malta in the European Parliament, on a district level the legislature, on a local level the local councils, and on a community level the Administrative Committees.

            The Isle of Man partially elects its legislature at the national level. The High Court of Tynwald consists of two chambers. The House of Keys has 24 members, elected in a general election for a five-year term in 12 two-seat constituencies. Each voter has two votes and in each constituency the two candidates with the most votes are elected. The Legislative Council has 11 members: three ex-officio members and eight other members who are elected by the House of Keys for a five-year term. Political parties do not play an important role on the Island. The Isle of Man lowered its voting age from 18 to 16 in 2006.

            <span class="mw-page-title-main">Elections in Turkey</span>

            Elections in Turkey are held for six functions of government: presidential elections (national), parliamentary elections (national), municipality mayors (local), district mayors (local), provincial or municipal council members (local) and muhtars (local). Apart from elections, referendums are also held occasionally.

            Apart from general elections and by-elections, a midterm election refers to a type of election where the people can elect their representatives and other subnational officeholders in the middle of the term of the executive. This is usually used to describe elections to a governmental body that are staggered so that the number of offices of that body would not be up for election at the same time. Only a fraction of a body seats are up for election while others are not until the terms of the next set of members are to expire. The legislators may have the same or longer fixed term of office as the executive, which facilitates an election midterm of the tenure of the higher office.

            <span class="mw-page-title-main">2012 Plymouth City Council election</span> 2012 UK local government election

            The 2012 Plymouth City Council election took place on 3 May 2012 to elect members of Plymouth City Council in England. This was on the same day as other local elections. The election was won by the Labour Party, who gained control of the council from the Conservative Party.

            <span class="mw-page-title-main">2012 Newport City Council election</span> 2012 Welsh local government election

            2012 Elections to Newport City Council were held on 3 May 2012 along with elections to the other 21 local authorities in Wales, community council elections in Wales and 2012 United Kingdom local elections.

            <span class="mw-page-title-main">2014 United Kingdom local elections</span>

            The 2014 United Kingdom local elections were held on 22 May 2014. Usually these elections are held on the first Thursday in May but were postponed to coincide with the 2014 European Parliament Elections. Direct elections were held for all 32 London boroughs, all 36 metropolitan boroughs, 74 district/borough councils, 19 unitary authorities and various mayoral posts in England and elections to the new councils in Northern Ireland.

            The 1971 Havering Council election took place on 13 May 1971 to elect members of Havering London Borough Council in London, England. The whole council was up for election and the Labour Party gained overall control of the council.

            The 1974 Havering Council election took place on 2 May 1974 to elect members of Havering London Borough Council in London, England. The whole council was up for election and the council went in no overall control.
            <span class="mw-page-title-main">2021 United Kingdom local elections</span> Elections to local councils and mayoralties

            The 2021 United Kingdom local elections were held on Thursday 6 May 2021. More than 145 English local councils, around 5,000 councillor seats, thirteen directly elected mayors in England, and 39 police and crime commissioners in England and Wales were contested. On the same day, the 2021 Hartlepool by-election took place, and there were also elections to the Scottish Parliament, Senedd and London Assembly, the last in conjunction with the London mayoral election.

            <span class="mw-page-title-main">2022 Bolton Metropolitan Borough Council election</span> 2022 local election in Bolton

            The 2022 Bolton Metropolitan Borough Council election took place on 5 May 2022. One third of councillors—20 out of 60—were to be elected. The election took place alongside other local elections across the United Kingdom.

            <span class="mw-page-title-main">2022 Oldham Metropolitan Borough Council election</span> 2022 local election in Oldham

            The 2022 Oldham Metropolitan Borough Council election took place on 5 May 2022. One third—20 out of 60—of councillors on Oldham Council was elected. The election took place alongside other local elections across the United Kingdom.