| |||||||||||||||||||||||||||||||||
All 28 seats to Limerick County Council | |||||||||||||||||||||||||||||||||
---|---|---|---|---|---|---|---|---|---|---|---|---|---|---|---|---|---|---|---|---|---|---|---|---|---|---|---|---|---|---|---|---|---|
| |||||||||||||||||||||||||||||||||
Map showing the area of Limerick County Council | |||||||||||||||||||||||||||||||||
|
An election to Limerick County Council took place on 11 June 2004 as part of that year's Irish local elections. 28 councillors were elected from five electoral divisions by PR-STV voting for a five-year term of office. [1]
Party | Seats | ± | First Pref. votes | FPv% | ±% | |
---|---|---|---|---|---|---|
Fianna Fáil | 12 | -2 | 23,157 | 39.13 | ||
Fine Gael | 12 | +2 | 22,841 | 38.60 | ||
Progressive Democrats | 3 | - | 4,681 | 7.91 | ||
Labour | 1 | +1 | 2,279 | 3.85 | ||
Independent | 0 | -1 | 4,121 | 6.96 | ||
Totals | 28 | - | 59,175 | 100.0 | — |
Party | Candidate | FPv% | Count | ||||||||||||
---|---|---|---|---|---|---|---|---|---|---|---|---|---|---|---|
1 | 2 | 3 | 4 | 5 | 6 | 7 | 8 | 9 | 10 | 11 | 12 | ||||
Fine Gael | Richard Butler* | 14.04 | 1,954 | ||||||||||||
Fianna Fáil | Niall Collins | 11.49 | 1,600 | 1,637 | 1,648 | 1,657 | 1,673 | 1,685 | 1,698 | 1,768 | |||||
Fine Gael | Cormac Hurley* | 7.96 | 1,108 | 1,144 | 1,148 | 1,175 | 1,264 | 1,362 | 1,453 | 1,457 | 1,489 | 1,555 | 1,744 | ||
Fianna Fáil | Leonard Enright * | 7.72 | 1,075 | 1,086 | 1,096 | 1,101 | 1,108 | 1,114 | 1,123 | 1,197 | 1,298 | 1,350 | 1,438 | 1,510 | |
Fianna Fáil | John Clifford* | 6.61 | 920 | 922 | 1,004 | 1,009 | 1,011 | 1,017 | 1,023 | 1,086 | 1,169 | 1,207 | 1,222 | 1,454 | |
Progressive Democrats | Rose Brennan* | 6.49 | 904 | 911 | 921 | 925 | 929 | 960 | 965 | 1,113 | 1,196 | 1,440 | 1,662 | 1,855 | |
Labour | Deirdre Ní Chinneide | 6.34 | 883 | 908 | 912 | 938 | 954 | 970 | 1,220 | 1,225 | 1,270 | 1,407 | 1,440 | 1,566 | |
Fianna Fáil | Sandra Marsh* | 5.55 | 772 | 778 | 784 | 798 | 828 | 935 | 981 | 999 | 1,025 | 1,100 | 1,131 | 1,174 | |
Fine Gael | Gerard Murnane | 4.76 | 663 | 678 | 736 | 747 | 782 | 786 | 792 | 801 | 860 | 899 | 1,070 | ||
Fine Gael | Tom P. Healy | 4.53 | 631 | 665 | 668 | 675 | 694 | 695 | 704 | 802 | 848 | 866 | |||
Progressive Democrats | Sinead Teefy | 4.40 | 613 | 631 | 659 | 671 | 676 | 736 | 762 | 776 | 817 | ||||
Independent | Patrick Fitzgerald | 3.99 | 556 | 560 | 562 | 623 | 636 | 642 | 658 | 680 | |||||
Fianna Fáil | James Cavanagh | 3.99 | 555 | 557 | 559 | 559 | 559 | 562 | 563 | ||||||
Labour | Karan O'Loughlin | 3.08 | 429 | 432 | 437 | 468 | 508 | 545 | |||||||
Progressive Democrats | Pat Hennessy* | 2.79 | 388 | 391 | 398 | 413 | 428 | ||||||||
Fine Gael | Tina O'Gorman | 2.41 | 335 | 342 | 343 | 351 | |||||||||
Independent | Denis Riordan | 1.95 | 271 | 274 | 277 | ||||||||||
Progressive Democrats | George O'Leary | 1.90 | 264 | 264 | |||||||||||
Electorate: 23,618 Valid: 13,921 (58.94%) Spoilt: 253 Quota: 1,741 Turnout: 14,174 (60.01%) |
Party | Candidate | FPv% | Count | |||||||||
---|---|---|---|---|---|---|---|---|---|---|---|---|
1 | 2 | 3 | 4 | 5 | 6 | 7 | 8 | 9 | ||||
Fine Gael | Mary Jackman * | 14.60 | 2,119 | |||||||||
Fianna Fáil | Eddie Wade * | 14.35 | 2,083 | |||||||||
Progressive Democrats | Brigid Teefy* | 10.25 | 1,487 | 1,516 | 1,599 | 1,606 | 1,648 | 1,675 | 1,715 | 1,829 | ||
Fianna Fáil | Joe Meagher* | 9.08 | 1,318 | 1,322 | 1,347 | 1,350 | 1,366 | 1,461 | 1,470 | 1,485 | 1,534 | |
Fianna Fáil | Noel Gleeson | 8.92 | 1,294 | 1,300 | 1,336 | 1,344 | 1,360 | 1,414 | 1,430 | 1,467 | 1,692 | |
Fine Gael | Kieran O'Donnell | 8.01 | 1,163 | 1,259 | 1,274 | 1,289 | 1,316 | 1,329 | 1,390 | 1,528 | 1,776 | |
Fianna Fáil | Noreen Ryan* | 8.01 | 1,163 | 1,184 | 1,220 | 1,226 | 1,289 | 1,311 | 1,342 | 1,405 | 1,601 | |
Fine Gael | Mary Harty* | 7.43 | 1,079 | 1,128 | 1,143 | 1,156 | 1,163 | 1,253 | 1,293 | 1,419 | 1,732 | |
Fine Gael | Paddy Hourigan* | 7.37 | 1,069 | 1,111 | 1,125 | 1,131 | 1,140 | 1,154 | 1,180 | 1,231 | ||
Green | Trish Forde-Brennan | 3.71 | 539 | 564 | 569 | 604 | 619 | 624 | 842 | |||
Labour | Manus Bree | 3.27 | 474 | 490 | 494 | 522 | 538 | 546 | ||||
Fianna Fáil | Tim Long | 2.24 | 325 | 328 | 344 | 347 | 360 | |||||
Fianna Fáil | Ursula Stokes | 1.62 | 235 | 246 | 262 | 266 | ||||||
Independent | Seán Gilmour | 1.14 | 166 | 168 | 171 | |||||||
Electorate: 25,025 Valid: 14,514 (58.00%) Spoilt: 253 Quota: 1,815 Turnout: 14,767 (59.01%) |
Party | Candidate | FPv% | Count | ||||||||
---|---|---|---|---|---|---|---|---|---|---|---|
1 | 2 | 3 | 4 | 5 | 6 | 7 | 8 | ||||
Fianna Fáil | John Gallahue* | 17.43 | 1,715 | 1,725 | 1,803 | 1,835 | 1,896 | 1,916 | 2,196 | ||
Fine Gael | Jim Houlihan* | 14.25 | 1,402 | 1,427 | 1,468 | 1,745 | 2,105 | ||||
Fianna Fáil | Pat McAuliffe* | 13.78 | 1,356 | 1,376 | 1,424 | 1,470 | 1,562 | 1,600 | 1,858 | 1,928 | |
Progressive Democrats | Eddie Creighton* | 13.10 | 1,289 | 1,296 | 1,338 | 1,386 | 1,414 | 1,435 | 1,616 | 1,668 | |
Fianna Fáil | Eddie Ryan | 12.58 | 1,238 | 1,242 | 1,293 | 1,327 | 1,345 | 1,367 | 1,549 | 1,603 | |
Independent | Pat Heffernan | 9.32 | 917 | 950 | 1,073 | 1,146 | 1,266 | 1,301 | |||
Independent | Brendan Danaher | 7.17 | 706 | 723 | 753 | 813 | |||||
Fine Gael | Thomas Blackburne | 5.73 | 564 | 577 | 604 | ||||||
Sinn Féin | Noel Hanley | 2.91 | 286 | 303 | |||||||
Labour | Thomas Rea | 2.03 | 200 | 207 | |||||||
Independent | James Coll | 1.71 | 168 | ||||||||
Electorate: 15,225 Valid: 9,841 (64.64%) Spoilt: 161 Quota: 1,969 Turnout: 10,002 (65.69%) |
Party | Candidate | FPv% | Count | ||||||||||
---|---|---|---|---|---|---|---|---|---|---|---|---|---|
1 | 2 | 3 | 4 | 5 | 6 | 7 | 8 | 9 | 10 | ||||
Fine Gael | Patrick O'Donovan * | 13.26 | 1,485 | 1,492 | 1,518 | 1,552 | 1,566 | 1,654 | 1,707 | 1,757 | 1,932 | ||
Fine Gael | Liam Galvin | 11.74 | 1,315 | 1,335 | 1,346 | 1,406 | 1,412 | 1,459 | 1,489 | 1,523 | 1,576 | 1,959 | |
Fianna Fáil | Michael J. Collins | 10.72 | 1,200 | 1,212 | 1,233 | 1,251 | 1,284 | 1,390 | 1,460 | 1,610 | 1,762 | 1,818 | |
Fianna Fáil | Seamus Ahern* | 10.20 | 1,142 | 1,149 | 1,152 | 1,161 | 1,170 | 1,200 | 1,223 | 1,275 | 1,305 | 1,386 | |
Fianna Fáil | Francis Foley | 9.35 | 1,047 | 1,056 | 1,063 | 1,102 | 1,110 | 1,153 | 1,180 | 1,261 | 1,358 | 1,574 | |
Fine Gael | Jerome Scanlan | 9.24 | 1,035 | 1,038 | 1,045 | 1,058 | 1,160 | 1,202 | 1,327 | 1,455 | 1,557 | 1,681 | |
Fine Gael | Maurice Hartnett | 7.78 | 871 | 890 | 893 | 943 | 963 | 996 | 1,014 | 1,036 | 1,075 | ||
Independent | Joseph Mullane | 5.19 | 581 | 588 | 602 | 617 | 641 | 720 | 800 | 842 | |||
Fianna Fáil | Vincent Kiely | 4.88 | 547 | 548 | 551 | 555 | 606 | 624 | 661 | ||||
Independent | Marian Collins | 4.47 | 501 | 517 | 527 | 542 | 564 | ||||||
Independent | John Leahy | 3.78 | 423 | 425 | 427 | 433 | |||||||
Sinn Féin | Coireall MacCurtain | 3.66 | 410 | 416 | 497 | 510 | 605 | 623 | |||||
Labour | Denis Hobson | 2.62 | 293 | 310 | 311 | ||||||||
Sinn Féin | Mike MacDomhnaill | 1.75 | 196 | 201 | |||||||||
Green | Eamon Collins | 1.37 | 153 | ||||||||||
Electorate: 17,522 Valid: 11,199 (63.91%) Spoilt: 182 Quota: 1,867 Turnout: 11,381 (64.95%) |
Party | Candidate | FPv% | Count | ||||
---|---|---|---|---|---|---|---|
1 | 2 | 3 | 4 | ||||
Fine Gael | Tom Neville* | 24.71 | 2,599 | ||||
Fine Gael | David Naughton* | 13.05 | 1,373 | 1,595 | 1,761 | ||
Fianna Fáil | Kevin Sheahan* | 12.85 | 1,352 | 1,434 | 1,525 | 1,824 | |
Fianna Fáil | John Griffin* | 10.80 | 1,136 | 1,208 | 1,283 | 1,527 | |
Fianna Fáil | John Cregan* | 10.30 | 1,084 | 1,131 | 1,252 | ||
Fine Gael | John Sheahan | 10.26 | 1,079 | 1,205 | 1,381 | 1,789 | |
Fine Gael | Stephen Keary | 9.48 | 997 | 1,210 | 1,346 | 1,408 | |
Green | Pat Culhane | 4.87 | 512 | 576 | |||
Independent | Paudie Mulvihil | 3.69 | 388 | 407 | |||
Electorate: 16,697 Valid: 10,520 (63.01%) Spoilt: 174 Quota: 1,754 Turnout: 10,694 (64.05%) |
Sinn Féin is an Irish republican and democratic socialist political party in both the Republic of Ireland and Northern Ireland.
The Workers' Party is a Marxist–Leninist political party active in both the Republic of Ireland and Northern Ireland.
The Northern Ireland Unionist Party (NIUP) was a small unionist political party in Northern Ireland. It was formed in January 1999 as a splinter party from the UK Unionist Party (UKUP). This split was caused by disagreement between the five UKUP members of the Northern Ireland Assembly. Four of the members disagreed with UKUP leader Robert McCartney's policy of resigning from the Assembly should Sinn Féin become part of the power-sharing executive. Cedric Wilson, Patrick Roche, Norman Boyd and Roger Hutchinson disagreed with McCartney, wanting to remain in the Assembly to challenge unionists in favour of the Belfast Agreement. McCartney disciplined these members in their absence and, in response, they left the UKUP and formed the NIUP. Led by Wilson, the new party argued that it had the support of the grassroots membership of the UKUP, but McCartney disputed this.
Northern Ireland is divided into 11 districts for local government purposes. In Northern Ireland, local councils do not carry out the same range of functions as those in the rest of the United Kingdom; for example they have no responsibility for education, road-building or housing. Their functions include planning, waste and recycling services, leisure and community services, building control and local economic and cultural development. The collection of rates is handled centrally by the Land and Property Services agency of the Northern Ireland Executive.
The Socialist Party is a political party in Ireland, active in both the Republic of Ireland and Northern Ireland. Internationally, it is affiliated to the Trotskyist International Socialist Alternative. The party has been involved in various populist campaigns including the Anti-Bin Tax Campaign and the Campaign Against Home and Water Taxes. Members of the party were jailed for their part in the former, while members have been arrested for their role in the latter. It had a seat in the European Parliament from 2009 to 2014. In 2015, the party received state funding of €132,000.
The Twenty-seventh Amendment of the Constitution Act 2004 amended the Constitution of Ireland to limit the constitutional right to Irish citizenship of individuals born on the island of Ireland to the children of Irish citizens. It was approved by referendum on 11 June 2004 and signed into law on 24 June of the same year. It affected in part changes made to the Constitution by the Nineteenth Amendment of the Constitution of Ireland which was passed as part of the Good Friday Agreement.
There are four types of elections in Wales: elections to the House of Commons of the United Kingdom, elections to the devolved Senedd, local elections to the 22 principal areas, and the Police and Crime Commissioner elections, in addition to by-elections for each aforementioned election. Elections are held on Election Day, which is conventionally a Thursday. Since the passing of the Fixed-term Parliaments Act 2011 for UK general elections, all four types of elections are held after fixed periods, though early elections to the UK parliament can occur in certain situations, with Senedd elections being postponed to avoid elections to the UK parliament and Senedd coinciding with each other.
Barry Cogan is a retired Irish Fianna Fáil politician who served as a Teachta Dála (TD) for 4 years and a Senator for less than one year.
Timothy Conway is a former Irish politician from Naas in County Kildare. An accountant and long-serving local councillor, he served for six years as a senator in the 1980s and later contested two general elections. In the course of his political career he switched party twice, moving from the Labour Party to the Progressive Democrats and then to Fine Gael.
There are five types of elections in the United Kingdom: elections to the House of Commons of the United Kingdom, elections to devolved parliaments and assemblies, local elections, mayoral elections, and Police and Crime Commissioner elections. Within each of those categories, there may also be by-elections. Elections are held on Election Day, which is conventionally a Thursday, and under the provisions of the Dissolution and Calling of Parliament Act 2022 the timing of general elections can be held at the discretion of the prime minister during any five-year period. All other types of elections are held after fixed periods, though early elections to the devolved assemblies and parliaments can occur in certain situations. The five electoral systems used are: the single member plurality system (first-past-the-post), the multi-member plurality, the single transferable vote, the additional member system, and the supplementary vote.
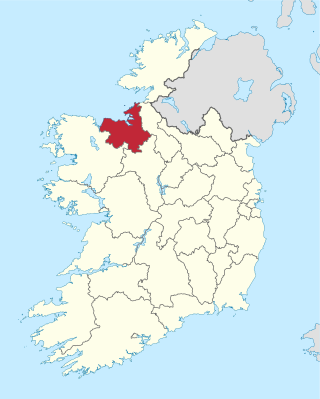
An election to Sligo County Council took place on 11 June 2004 as part of that year's Irish local elections. 25 councillors were elected from five electoral divisions by PR-STV voting for a five-year term of office.
An election to Dublin City Council took place on 11 June 2004 as part of that year's Irish local elections. 52 councillors were elected from thirteen electoral divisions by PR-STV voting for a five-year term of office.
An election to Fingal County Council took place on 11 June 2004 as part of that year's Irish local elections. 24 councillors were elected from six electoral divisions by PR-STV voting for a five-year term of office.
An election to South Dublin County Council took place on 11 June 2004 as part of that year's Irish local elections. 26 councillors were elected from five electoral divisions using the Single transferable vote system for a five-year term of office.
An election to Dún Laoghaire–Rathdown County Council took place on 11 June 2004 as part of that year's Irish local elections. 28 councillors were elected from six electoral divisions by PR-STV voting for a five-year term of office.
An election to Offaly County Council took place on 11 June 2004 as part of that year's Irish local elections. 21 councillors were elected from five electoral divisions by PR-STV voting for a five-year term of office.
An election to Kilkenny County Council took place on 11 June 2004 as part of that year's Irish local elections. 26 councillors were elected from five electoral divisions by PR-STV voting for a five-year term of office.
An election to Waterford County Council took place on 11 June 2004 as part of that year's Irish local elections. 23 councillors were elected from five electoral divisions by PR-STV voting for a five-year term of office.
An election to South Tipperary County Council took place on 11 June 2004 as part of that year's Irish local elections. 26 councillors were elected from five electoral divisions by PR-STV voting for a five-year term of office.
An election to Kerry County Council took place on 11 June 2004 as part of that year's Irish local elections. 27 councillors were elected from five electoral divisions by PR-STV voting for a five-year term of office.
Preceded by 1999 Limerick County Council election | Limerick County Council elections | Succeeded by 2009 Limerick County Council election |