Clare is a parliamentary constituency represented in Dáil Éireann, the lower house of the Irish parliament or Oireachtas. The constituency elects four deputies on the system of proportional representation by means of the single transferable vote (PR-STV).

Wicklow is a parliamentary constituency represented in Dáil Éireann, the lower house of the Irish parliament or Oireachtas. The constituency elects 5 deputies on the electoral system of proportional representation by means of the single transferable vote (PR-STV).

Laois–Offaly is a parliamentary constituency which is represented in Dáil Éireann, the lower house of the Irish parliament or Oireachtas. The constituency elects 5 deputies on the system of proportional representation by means of the single transferable vote (PR-STV). It was previously a constituency from 1921 to 2016.

Kildare South is a parliamentary constituency represented in Dáil Éireann, the lower house of the Irish parliament or Oireachtas. The constituency elects 4 deputies on the electoral system of proportional representation by means of the single transferable vote (PR-STV).

Dublin is a constituency of the European Parliament in Ireland. It elects 4 Members of the European Parliament (MEPs) using proportional representation by means of the single transferable vote (STV).
Tipperary is a parliamentary constituency that has been represented in Dáil Éireann, the lower house of the Irish parliament or Oireachtas, since the 2016 general election. The constituency elects 5 deputies on the system of proportional representation by means of the single transferable vote (PR-STV). A constituency of the same name existed between 1923 and 1948.

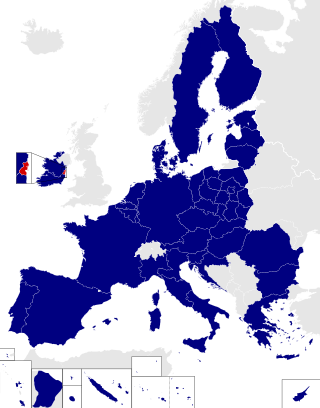
Connacht–Ulster was a constituency of the European Parliament in Ireland between 1979 and 2004. Throughout its history, it elected 3 Members of the European Parliament (MEPs) using the single transferable vote (STV) system.
Laois was a parliamentary constituency represented in Dáil Éireann, the lower house of the Irish parliament or Oireachtas, from 2016 to 2020. The constituency elected 3 deputies. The method of election was proportional representation by means of the single transferable vote (PR-STV).
Offaly was a parliamentary constituency represented in Dáil Éireann, the lower house of the Irish parliament or Oireachtas, from 2016 to 2020. The constituency elected three deputies. The method of election was proportional representation by means of the single transferable vote (PR-STV).

An election to all 33 seats on Kerry County Council took place on 23 May 2014 as part of the 2014 Irish local elections, an increase from 27 seats at the 2009 election. County Kerry was divided into four local electoral areas (LEAs) to elect councillors for a five-year term of office on the electoral system of proportional representation by means of the single transferable vote (PR-STV). In addition, the town councils of Killarney, Listowel and Tralee were abolished.

An election to Kerry County Council took place on 10 June 1999 as part of that year's Irish local elections. 27 councillors were elected from five local electoral areas on the system of proportional representation by means of the single transferable vote (PR-STV) for a five-year term of office.

An election to Offaly County Council took place on 10 June 1999 as part of that year's Irish local elections. 21 councillors were elected from five local electoral areas for a five-year term of office on the system of proportional representation by means of the single transferable vote (PR-STV).

An election to Kerry County Council took place on 5 June 2009 as part of that year's Irish local elections. 27 councillors were elected from five local electoral areas (LEAs) for a five-year term of office on the electoral system of proportional representation by means of the single transferable vote (PR-STV).

An election to Kerry County Council took place on 27 June 1991 as part of that year's Irish local elections. 27 councillors were elected from five local electoral areas (LEAs) for a five-year term of office on the electoral system of proportional representation by means of the single transferable vote (PR-STV). This term was extended twice, first to 1998, then to 1999.

An election to all 29 seats on Donegal County Council took place on 20 June 1985 as part of the 1985 Irish local elections. County Donegal was divided into six local electoral areas (LEAs) to elect councillors for a five-year term of office on the electoral system of proportional representation by means of the single transferable vote (PR-STV). This term was extended for a further year, to 1991.

An election to Dublin City Council took place on 20 June 1985 as part of that year's Irish local elections. 52 councillors were elected from twelve local electoral areas (LEAs) for a five-year term of office on the electoral system of proportional representation by means of the single transferable vote (PR-STV). This term was extended for a further year, to 1991.

An election to Wicklow County Council took place on 7 June 1979 as part of that year's Irish local elections. 21 councillors were elected from four local electoral area divisions by PR-STV voting for a six-year term of office.

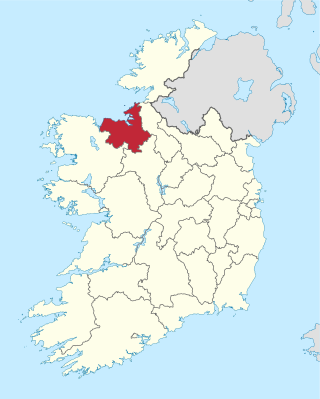
An election to Sligo County Council took place on 7 June 1979 as part of that year's Irish local elections. 24 councillors were elected from four local electoral areas (LEAs) for a six-year term of office on the electoral system of proportional representation by means of the single transferable vote (PR-STV).

An election to all 28 seats on Donegal County Council took place on 7 June 1979 as part of the 1979 Irish local elections. County Donegal was divided into five county local electoral areas to elect councillors for a five-year term of office on the electoral system of proportional representation by means of the single transferable vote (PR-STV). This term was extended for a further year, to 1985.

An election to all 29 seats on Donegal County Council took place on 18 June 1974 as part of the Irish local elections. Councillors were elected from five local electoral areas for a five-year term of office on the electoral system of proportional representation by means of the single transferable vote (PR-STV).


