2004 Dublin City Council election

Last updated

2004 Dublin City Council election
Flag of Ireland.svg
  1999 11 June 2004 2009  

All 52 seats on Dublin City Council
 First partySecond partyThird party
 
Party Labour Fianna Fáil Sinn Féin
Seats won161210
Seat changeIncrease2.svg 2Decrease2.svg 8Increase2.svg 6

 Fourth partyFifth partySixth party
 
Party Fine Gael Green Progressive Democrats
Seats won911
Seat changeSteady2.svg 0Decrease2.svg 1Increase2.svg 1

 Seventh party
 
Party Independent
Seats won3
Seat changeSteady2.svg 0

Dublin City in Ireland.svg
Map showing the area of Dublin City Council

Council control before election

Labour Party
Fine Gael
Green Party

Council control after election

Labour Party
Fine Gael

An election to Dublin City Council took place on 11 June 2004 as part of that year's Irish local elections. 52 councillors were elected from thirteen local electoral areas (LEAs) for a five-year term of office on the electoral system of proportional representation by means of the single transferable vote (PR-STV).

Contents

Results by party

PartySeats±First Pref. votesFPv%±%
Labour 16Increase2.svg 236,05720.57
Fianna Fáil 12Decrease2.svg 839,86522.74
Sinn Féin 10Increase2.svg 632,63918.62
Fine Gael 9Steady2.svg 029,87317.04
Green 1Decrease2.svg 111,3146.46
Progressive Democrats 1Increase2.svg 16,4043.65
Socialist Workers 0Steady2.svg 02,9041.66
Workers' Party 0Steady2.svg 01,5640.89
Socialist Party 0Steady2.svg 05790.33
Christian Solidarity 0Steady2.svg 02140.12
Independent 3Steady2.svg 013,8617.90
Totals52Steady2.svg 0175,274100.00

Results by local electoral area

Artane

Artane - 4 seats
PartyCandidateFPv%Count
1234567
Sinn Féin Larry O'Toole*32.114,497      
Fine Gael Terence Flanagan 18.522,5942,776 2,944    
Fianna Fáil Seán Paul Mahon*12.301,7231,883 1,895 1,963 2,789 2,800 2,945
Labour Paddy Bourke 9.311,3041,501 1,519 1,687 1,771 1,815 2,217
Fianna Fáil Brian Taylor8.111,1361,219 1,239 1,301    
Labour Sinead Seery7.089911,262 1,304 1,486 1,607 1,657 2,027
Socialist Workers Ritchie Browne5.657921,328 1,341 1,568 1,629 1,634  
Green Simon Herbert4.93691915 937     
Fine Gael Dan Sullivan1.98278320      
Electorate: 26,316  Valid: 14,006 (53.22%)  Spoilt: 424  Quota: 2,802  Turnout: 14,430 (54.83%)  

    Ballyfermot

    Ballyfermot - 3 seats
    PartyCandidateFPv%Count
    1234
    Sinn Féin Tony Smithers21.171,9702,037 2,112 2,256
    Labour Michael Conaghan *20.701,9262,049 2,205 2,668
    Independent Vincent Jackson *20.631,9202,043 2,265 2,453
    Socialist Workers Bríd Smith 11.761,0941,166 1,199 1,256
    Fine Gael Peter O'Neill10.569831,043 1,187  
    Fianna Fáil Marian McGennis*8.61801866   
    Green Sinead Ni Bhroin2.35219   
    Progressive Democrats Ben Doyle2.20205   
    Workers' Party Andrew McGuinness2.02188   
    Electorate: 19,463  Valid: 9,306 (47.81%)  Spoilt: 264  Quota: 2,327  Turnout: 9,570 (49.17%)  

      Ballymun-Whitehall

      Ballymun-Whitehall - 3 seats
      PartyCandidateFPv%Count
      1234567
      Sinn Féin Ray Corcoran24.202,2702,324 2,355    
      Labour Andrew Montague 17.891,6781,721 1,807 1,987 2,057 2,486 
      Fianna Fáil Julia Carmichael16.171,5171,534 1,562 1,585 1,867 1,934 2,463
      Fine Gael Brendan Brady12.251,1491,155 1,200 1,240 1,286 1,365 1,457
      Fianna Fáil Sheila Gallogly*6.54613616 629 651 809 812  
      Labour Eamonn O'Brien*6.44604626 645 710 725   
      Fianna Fáil Padraig Johnston6.32593597 611 624    
      Workers' Party John Dunne4.04379442 474     
      Green Dermot Hamilton3.42321346      
      Socialist Workers Kevin Wingfield2.73256      
      Electorate: 19,188  Valid: 9,380 (48.88%)  Spoilt: 279  Quota: 2,346  Turnout: 9,659 (50.34%)  

        Cabra-Glasnevin

        Cabra-Glasnevin - 5 seats
        PartyCandidateFPv%Count
        12345678910
        Sinn Féin Nicky Kehoe*19.883,609         
        Labour Brendan Carr*11.122,0192,042 2,053 2,435 2,525 3,021 3,208   
        Fianna Fáil Mary Fitzpatrick *10.181,8481,872 1,902 1,917 1,952 2,005 2,108 2,114 2,753 2,815
        Independent Ciaran Perry9.651,7531,843 1,931 1,955 2,142 2,346 2,421 2,434 2,579 2,612
        Fianna Fáil Maurice Ahern *9.591,7421,761 1,785 1,806 1,846 1,917 2,035 2,052 2,668 2,705
        Fine Gael Paschal Donohoe 9.381,7031,712 1,722 1,766 1,796 1,928 2,795 2,886 3,159 
        Fianna Fáil John Stephens8.891,6151,632 1,661 1,676 1,705 1,757 1,876 1,884   
        Fine Gael Chris Giblin*7.661,3911,397 1,417 1,487 1,518 1,620     
        Green Thomas Simpson6.181,1221,135 1,168 1,229 1,342      
        Labour Fintan Gibney3.62658667 675        
        Sinn Féin Aine Ni Gabhann2.19397766 778 798       
        Independent Pat Talbot1.65300303         
        Electorate: 32,485  Valid: 18,157 (55.89%)  Spoilt: 480  Quota: 3,027  Turnout: 18,637 (57.37%)  

          Clontarf

          Clontarf - 5 seats
          PartyCandidateFPv%Count
          123456789
          Fianna Fáil Deirdre Heney*21.794,487        
          Fine Gael Gerry Breen *15.513,1933,270 3,289 3,536     
          Fine Gael Naoise O Muiri 9.862,0292,112 2,156 2,322 2,379 2,416 2,606 2,789 2,937
          Green Bronwen Maher 7.651,5761,645 1,716 1,815 1,914 1,924 2,335 2,445 2,976
          Sinn Féin Peter Lawlor7.181,4781,516 1,549 1,578 1,649 1,651 1,865 1,940  
          Fianna Fáil Eibhlin Byrne *6.901,4211,776 1,789 1,903 1,960 1,974 2,090 3,107 3,346
          Labour Orla Farrell*6.751,3891,419 1,444 1,523 2,198 2,217 2,491 2,584 2,935
          Independent Fintan Cassidy*6.521,3431,383 1,474 1,526 1,586 1,594    
          Fianna Fáil John Stafford*6.061,2481,531 1,549 1,651 1,706 1,720 1,819   
          Labour Willie Hamilton5.321,0921,114 1,137 1,157      
          Progressive Democrats Dennis McIntyre4.58942984 992       
          Independent Kevin O'Hare1.89390406        
          Electorate: 35,703  Valid: 20,588 (57.66%)  Spoilt: 460  Quota: 3,432  Turnout: 21,048 (58.95%)  

            Crumlin-Kimmage

            Crumlin-Kimmage - 5 seats
            PartyCandidateFPv%Count
            123456789
            Labour Eric Byrne *20.084,045        
            Sinn Féin Robbie Sargent16.013,2253,280 3,465      
            Independent Joan Collins 13.782,7772,863 3,046 3,079 3,251 3,389   
            Fianna Fáil Charlie Ardagh*12.202,4592,511 2,662 2,668 2,758 3,664   
            Fine Gael Anne Marie Martin*8.031,6171,691 1,809 1,819 2,024 2,135 2,257 2,270 2,854
            Fianna Fáil David Gaynor*7.101,4301,456 1,553 1,559 1,614     
            Fine Gael Ruairi McGinley*7.011,4131,457 1,525 1,531 1,680 1,761 1,861 1,865 2,182
            Green Kristina McElroy5.771,1621,222 1,343 1,366 1,672 1,759 1,842 1,855  
            Labour Gearoid O Maoilmhichill4.519091,161 1,258 1,280      
            Progressive Democrats Brian McElroy3.83771796        
            Workers' Party Brendan Phelan1.69341353        
            Electorate: 38,646  Valid: 20,149 (52.14%)  Spoilt: 563  Quota: 3,359  Turnout: 20,712 (53.59%)  

              Donaghmede

              Donaghmede - 5 seats
              PartyCandidateFPv%Count
              123456789
              Sinn Féin Killian Forde17.153,509        
              Labour Seán Kenny *16.843,445        
              Fianna Fáil Tom Brabazon*12.792,6162,746 2,754 2,756 3,142 3,220 4,032  
              Labour Anne Carter*9.211,8841,975 1,998 2,015 2,080 2,463 2,541 2,615 2,901
              Independent Tom Brennan8.731,7861,834 1,856 1,858 1,901 2,153 2,290 2,412 2,563
              Fine Gael Patrick Crimmins8.041,6451,728 1,733 1,737 1,790 1,863 1,920 1,988  
              Fine Gael Niamh Cosgrave *7.881,6121,721 1,728 1,732 1,781 1,934 2,014 2,108 3,162
              Green Donna Cooney5.511,1271,192 1,217 1,220 1,275     
              Fianna Fáil John Clare*4.739671,090 1,094 1,096      
              Progressive Democrats Aidan Kennedy2.59529        
              Fianna Fáil Michael McPherson1.47301        
              Electorate: 36,800  Valid: 20,459 (55.60%)  Spoilt: 610  Quota: 3,410  Turnout: 21,069 (57.25%)  

                Finglas

                Finglas - 4 seats
                PartyCandidateFPv%Count
                1234567
                Sinn Féin Dessie Ellis *29.844,300      
                Labour Mary Murphy*13.781,9852,082 2,196 2,309 2,617 2,899 
                Fine Gael Dr. Bill Tormey12.101,7431,812 1,866 1,924 2,126 2,296 2,569
                Fianna Fáil Liam Kelly*11.601,6721,729 1,760 1,779 1,952 2,025 2,962
                Fianna Fáil Conor Sludds*10.031,4451,513 1,532 1,555 1,705 1,785  
                Progressive Democrats Paul McAuliffe 7.161,0311,090 1,143 1,185    
                Independent John O'Neill5.86845978 1,066 1,209 1,314   
                Green Aiden Meagher3.35483515      
                Workers' Party Owen Martin3.18458560 596     
                Sinn Féin Sandra Sludds3.104461,247 1,295 1,388 1,479 1,812 2,008
                Electorate: 27,146  Valid: 14,408 (53.08%)  Spoilt: 367  Quota: 2,882  Turnout: 14,775 (54.43%)  

                  North Inner City

                  North Inner City - 5 seats
                  PartyCandidateFPv%Count
                  123456789101112
                  Sinn Féin Christy Burke *14.781,8691,878 1,881 1,998 2,443       
                  Labour Emer Costello *14.491,8321,838 1,848 1,910 1,945 2,002 2,211     
                  Labour Aodhán Ó Ríordáin 11.171,4121,417 1,428 1,454 1,474 1,503 1,660 1,726 2,086 2,329  
                  Independent Mick Rafferty8.681,0971,105 1,137 1,211 1,233 1,300 1,332 1,339 1,461 1,787 1,888 2,050
                  Fianna Fáil Margeurite Fitzpatrick8.131,0281,029 1,046 1,085 1,101 1,120 1,175 1,181 1,218 1,265 1,275 1,468
                  Fianna Fáil Tom Stafford*8.011,0131,013 1,037 1,066 1,076 1,091 1,116 1,118 1,134 1,200 1,219 1,712
                  Fianna Fáil Nial Ring7.86994996 1,010 1,037 1,038 1,046 1,092 1,093 1,117 1,163 1,189  
                  Independent Joe Mooney5.60708721 730 792 801 830 850 854 943    
                  Green Phil Kearney5.23661662 677 712 722 751 810 827     
                  Fine Gael Valerie Ni Fhaolain4.84612612 630 648 653 661       
                  Sinn Féin Ciaran MacAnnraoi4.63585586 592 623         
                  Independent Paul Kangley2.18276282 291          
                  Independent Ernie Beggs2.17274281 296          
                  Christian Solidarity Paul O'Loughlin1.69214217           
                  Independent Michael Gallagher0.5367           
                  Electorate: 31,067  Valid: 12,642 (40.69%)  Spoilt: 489  Quota: 2,108  Turnout: 13,131 (42.27%)  

                    Pembroke

                    Pembroke - 3 seats
                    PartyCandidateFPv%Count
                    123456
                    Labour Dermot Lacey *18.871,7961,878 2,370 2,561  
                    Progressive Democrats Wendy Hederman16.621,5821,640 1,843 1,991 2,189 2,252
                    Fine Gael Lucinda Creighton 16.461,5671,617 1,800 2,644  
                    Fianna Fáil Chris Andrews*16.161,5381,767 1,865 1,973 2,039 2,079
                    Fine Gael Paddy McCartan13.211,2571,285 1,379    
                    Green Claire Wheeler*11.821,1251,260     
                    Sinn Féin Sinead Pembroke3.47330     
                    Fianna Fáil Michael Turley3.39323     
                    Electorate: 18,914  Valid: 9,518 (50.32%)  Spoilt: 177  Quota: 2,380  Turnout: 9,695 (36.31%)  

                      Rathmines

                      Rathmines - 4 seats
                      PartyCandidateFPv%Count
                      123456
                      Labour Mary Freehill *15.941,7571,835 1,930 1,984 2,141 2,284
                      Labour Oisin Quinn 13.381,4751,497 1,575 1,700 1,784 2,003
                      Fianna Fáil Michael Donnelly *12.601,3891,405 1,468 1,896 1,971 2,280
                      Fine Gael Brian Gillen12.281,3541,361 1,383 1,438 2,027 2,342
                      Green Ryan Meade*10.981,2101,310 1,475 1,519 1,571 1,699
                      Progressive Democrats Tony Williams9.251,0201,028 1,050 1,171 1,267  
                      Fine Gael Edie Wynne9.181,0121,023 1,041 1,094   
                      Fianna Fáil Jim O'Callaghan 8.18902908 941    
                      Sinn Féin Eoin O Sé5.29583632     
                      Socialist Workers Terry Connolly1.95215183 189    
                      Independent Eoin Tierney0.9710773     
                      Electorate: 24,594  Valid: 11,024 (44.82%)  Spoilt: 228  Quota: 2,205  Turnout: 11,252 (45.75%)  

                        South-East Inner City

                        South-East Inner City - 3 seats
                        PartyCandidateFPv%Count
                        12345678910
                        Labour Kevin Humphreys *24.861,9801,987 2,001       
                        Sinn Féin Daithí Doolan 24.111,9211,928 1,972 2,032      
                        Fianna Fáil Garry Keegan*14.351,1431,145 1,161 1,172 1,175 1,193 1,275 1,327 1,704 1,878
                        Green Pauline O'Shea8.35665675 692 728 737 876 931 979 1,025 1,294
                        Fianna Fáil Pat Bunce6.63528531 536 557 564 583 634 663   
                        Fine Gael John Barry5.10406408 410 411 414 423 456 686 749  
                        Fine Gael Conor Delaney4.32344347 351 356 356 365 417    
                        Progressive Democrats John Kenny4.07324324 326 334 336 353     
                        Socialist Workers Shay Ryan3.00239249 265 305 318      
                        Workers' Party Angie Murphy2.49198205 213        
                        Independent Linda Poole1.83146155         
                        Independent Noel Ivory0.9072         
                        Electorate: 18,360  Valid: 7,966 (43.39%)  Spoilt: 256  Quota: 1,992  Turnout: 8,222 (44.78%)  

                          South-West Inner City

                          South-West Inner City - 3 seats
                          PartyCandidateFPv%Count
                          123456
                          Fine Gael Catherine Byrne *22.641,9711,990 2,111 2,165 2,178 
                          Labour John Gallagher*21.551,8761,940 1,986 2,230  
                          Sinn Féin Andrew O'Connell18.961,6501,703 1,734 1,894 1,909 2,108
                          Green Patricia Gardiner10.94952993 1,025 1,118 1,139 1,485
                          Fianna Fáil Mary Mooney*9.12794804 1,102 1,124 1,128  
                          Fianna Fáil Tom Brunkard6.65579584     
                          Socialist Party Diarmuid Naessens6.59579658 663    
                          Socialist Workers Brendan Donohoe3.54308     
                          Electorate: 20,603  Valid: 8,704 (42.25%)  Spoilt: 287  Quota: 2,177  Turnout: 8,991 (43.64%)  

                            Related Research Articles

                            Estonia elects a legislature on the national level. The Riigikogu has 101 members, elected for a four-year term by proportional representation. A head of state – the president – is elected for a five-year term by parliament or an electoral college. Locally, Estonia elects local government councils, which vary in size. Election law states the minimum size of a council depending on the size of municipality. Local government councils are elected by proportional representation too.

                            <span class="mw-page-title-main">Elections in Malta</span>

                            Malta elects on a national level 6 MEPs representing Malta in the European Parliament, on a district level the legislature, On a local level the Local Councils and on a community level the Administrative Committees.

                            <span class="mw-page-title-main">Elections in Namibia</span> Political elections for public offices in Namibia

                            Elections in Namibia determine who holds public political offices in the country. Namibia is a semi-presidential representative democratic republic. It runs direct elections every five years for the position of the president and seats in the National Assembly, and every six years for the Regional Councils and the distribution of seats in local authorities. The National Council is elected indirectly by the constituency councillors of Namibia's 14 regions.

                            In various parliamentary systems, a returning officer is responsible for overseeing elections in one or more constituencies.

                            <span class="mw-page-title-main">2007 United Kingdom local elections</span>

                            The 2007 United Kingdom local elections were held on Thursday 3 May 2007. These elections took place in most of England and all of Scotland. There were no local government elections in Wales though the Welsh Assembly had a general election on the same day. There were no local government elections in Northern Ireland. Just over half of English councils and almost all the Scottish councils began the counts on Friday, rather than Thursday night, because of more complex arrangements regarding postal votes.

                            <span class="mw-page-title-main">2009 Essex County Council election</span>

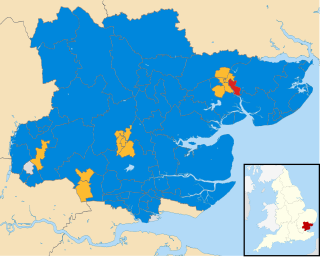
                            An election to Essex County Council took place on 4 June 2009 as part of the 2009 United Kingdom local elections. The elections had been delayed from 7 May, to coincide with elections to the European Parliament. 75 councillors were elected from various electoral divisions, which returned either one or two county councillors each by first-past-the-post voting for a four-year term of office. The electoral divisions were the same as those used at the previous election in 2005.

                            <span class="mw-page-title-main">2010 Waltham Forest London Borough Council election</span>

                            Elections for London Borough of Waltham Forest were held on 6 May 2010. The 2010 General Election and other local elections took place on the same day.

                            <span class="mw-page-title-main">2012 United Kingdom local elections</span> Elections that were held across England, Scotland and Wales

                            The 2012 United Kingdom local elections were held across England, Scotland and Wales on 3 May 2012. Elections were held in 128 English local authorities, all 32 Scottish local authorities and 21 of the 22 Welsh unitary authorities, alongside three mayoral elections including the London mayoralty and the London Assembly. Referendums were also held in 11 English cities to determine whether or not to introduce directly elected mayors.

                            <span class="mw-page-title-main">2013 Cumbria County Council election</span>

                            An election to Cumbria County Council took place on 2 May 2013 as part of the 2013 United Kingdom local elections. All 84 councillors were elected from electoral divisions which returned one county councillor each by first-past-the-post voting for a four-year term of office. Following an electoral review carried out by the Local Government Boundary Commission for England, newly drawn electoral divisions were used without change in the number of county councillors.

                            <span class="mw-page-title-main">2013 Leicestershire County Council election</span>

                            An election to Leicestershire County Council took place on 2 May 2013 as part of the 2013 United Kingdom local elections. 55 councillors were elected from 52 electoral divisions, which returned either one or two county councillors each by first-past-the-post voting for a four-year term of office. The Conservatives held control of the council with a reduced majority of 5 seats. Despite a strong challenge from UKIP, the party only gained 2 seats whilst the Liberal Democrats lost one seat and Labour recouped some of their 2009 losses, gaining 6 seats.

                            <span class="mw-page-title-main">2013 Surrey County Council election</span>

                            The Surrey County Council election, 2013 took place on 2 May 2013 as part of the 2013 United Kingdom local elections. 81 electoral divisions returned one county councillor each by first-past-the-post voting for a four-year term of office. Following a review, new electoral division boundaries were introduced for this election, increasing the number of councillors from 80 to 81.

                            <span class="mw-page-title-main">2013 Hertfordshire County Council election</span>

                            An election to Hertfordshire County Council took place on 2 May 2013, as part of the 2013 United Kingdom local elections. 77 electoral divisions elected one county councilor each by first-past-the-post voting for a four-year term of office. The electoral divisions were the same as those used at the previous election in 2009.

                            Council elections for the City of Preston, Lancashire were held on 22 May 2014 as part of the 2014 United Kingdom local elections. The elections have been moved from earlier on in May to coincide with the North West component of the 2014 European Parliament election. Nineteen electoral wards were fought with those councillors elected in the corresponding elections in 2010 defending their seats due to the "in thirds" system employed in Preston local elections. The previous elections to Preston council occurred in 2012 but due to the "in thirds" system employed by Preston council, councillors are elected for four-year terms. This means gains, losses, and vote share comparisons this year are with those fought in 2010.

                            <span class="mw-page-title-main">2017 United Kingdom local elections</span>

                            The 2017 United Kingdom local elections were held on Thursday 4 May 2017. Local elections were held across Great Britain, with elections to 35 English local authorities and all councils in Scotland and Wales.

                            <span class="mw-page-title-main">2017 Derbyshire County Council election</span>

                            An election to Derbyshire County Council took place on 4 May 2017 as part of the 2017 United Kingdom local elections. 64 councillors were elected from 61 electoral divisions which returned either one or two county councillors each by first-past-the-post voting for a four-year term of office. No elections were held in the City of Derby, which is a unitary authority outside the area covered by the County Council. The Conservative Party won back control of the council, taking thirty-seven of the authority's sixty-four seats.

                            <span class="mw-page-title-main">2017 Lincolnshire County Council election</span>

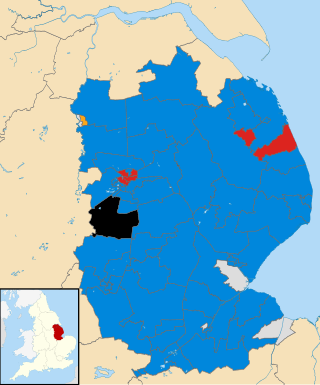
                            The 2017 Lincolnshire County Council election took place in non-metropolitan Lincolnshire on 4 May 2017 as part of the 2017 local elections in the United Kingdom. A total of 70 councillors were elected across the seven non-metropolitan districts that make up the administrative county of Lincolnshire from 70 single member electoral divisions by first-past-the-post voting for a four-year term of office. The election did not include North Lincolnshire and North East Lincolnshire as they are separate unitary authorities.

                            <span class="mw-page-title-main">2017 Staffordshire County Council election</span>

                            The 2017 Staffordshire County Council election took place on 4 May 2017 as part of 2017 local elections in the UK. All 62 councillors were elected from electoral divisions for a four-year term of office. The system used is first-past-the-post voting.

                            <span class="mw-page-title-main">2017 Cornwall Council election</span>

                            The 2017 Cornwall Council election was held on 4 May 2017 as part of the 2017 local elections in the United Kingdom. 122 councillors were elected from the 121 electoral divisions of Cornwall Council, which returned either one or two councillors each by first-past-the-post voting for a four-year term of office. Although originally scheduled to take place on the same day, the election in the Bodmin St Petroc ward was countermanded following the death of Liberal Democrat candidate Steve Rogerson and was held on 8 June.

                            <span class="mw-page-title-main">2019 United Kingdom local elections</span> Elections to local councils and mayoralties

                            The 2019 United Kingdom local elections took place on Thursday 2 May 2019, with 248 English local councils, six directly elected mayors in England, and all 11 local councils in Northern Ireland being contested.

                            <span class="mw-page-title-main">2022 Welsh local elections</span>

                            The 2022 Welsh local elections took place on 5 May 2022 to elect members of all twenty-two local authorities in Wales. They were held alongside other local elections in the United Kingdom. The previous elections were held in 2017.

                            References