2009 South Dublin County Council election

Last updated

2009 South Dublin County Council election
Flag of Ireland.svg
  2004 5 June 2009 2014  

All 26 seats on South Dublin County Council
 First partySecond partyThird party
 
Party Labour Fine Gael Fianna Fáil
Seats won984
Seat change+2+5-2

 Fourth partyFifth partySixth party
 
Party Sinn Féin People Before Profit Independent
Seats won311
Seat change0+1-1

 Seventh partyEighth partyNinth party
 
Party Green Socialist Party Progressive Democrats
Seats won000
Seat change-2-1-2

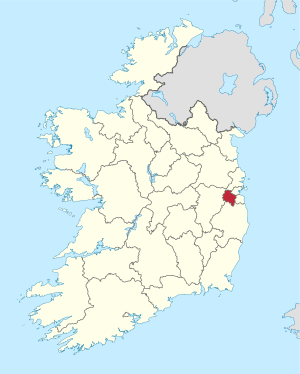
South Dublin in Ireland.svg
Map showing the area of South Dublin County Council

Council control after election

TBD

An election to South Dublin County Council took place on 5 June 2009 as part of that year's Irish local elections. 26 councillors were elected from five local electoral areas using the Single transferable vote system for a five-year term of office.

Contents

Results by party

PartySeats±First Pref. votesFPv%±%
Labour 9+221,81324.13
Fine Gael 8+523,69826.22
Fianna Fáil 4-215,29016.92
Sinn Féin 309,66110.69
People Before Profit 1+15,7216.33
Independent 1-17,9978.85
Green 0-23,3453.70
Socialist Party 0-12,1592.39
Progressive Democrats 0-2N/AN/A
Totals26090,389100.00

Results by local electoral area

Clondalkin

Clondalkin - 6 seats
PartyCandidateFPv%Count
12345678910
Labour Robert Dowds *15.662,449         
Fine Gael Tony Delaney*11.031,7251,754 1,780 1,792 1,916 2,018 2,057 2,258  
Fine Gael Therese Ridge *10.071,5751,600 1,623 1,657 1,742 1,813 1,857 2,092 2,188 2,294
Sinn Féin Matthew McDonagh9.611,5021,507 1,511 1,546 1,564 1,574 1,767 1,936 2,896 
Fianna Fáil Jim Daly*8.021,2541,256 1,267 1,268 1,372 1,531 1,541 1,568 1,595 1,617
Sinn Féin Shane O'Connor*7.811,2211,227 1,250 1,278 1,311 1,324 1,402 1,489   
People Before Profit Gino Kenny 7.271,1371,151 1,179 1,218 1,270 1,292 1,471 1,703 1,838 2,203
Fianna Fáil Trevor Gilligan*6.611,0341,046 1,079 1,104 1,174 1,476 1,513 1,587 1,652 1,713
Labour Margaret McCarthy5.909221,019 1,055 1,088 1,200 1,224 1,324    
Fianna Fáil Thyes Kavanagh4.69734740 762 769 792      
Green Dorothy Corrigan*4.37683690 718 725       
Independent John McCann4.21658663 692 897 917 932     
Independent Mark Ward 2.62410413 453        
Independent Jim McHale1.14179182         
Independent Gbemi Shogunle0.97151152         
Electorate: 36,859  Valid: 15,634 (42.42%)  Spoilt: 295  Quota: 2,234  Turnout: 15,929 (43.22%)  

    Lucan

    Lucan - 5 seats
    PartyCandidateFPv%Count
    1234567891011
    Fine Gael Derek Keating *26.884,146          
    Independent Guss O'Connell*13.892,1432,244 2,253 2,316 2,402 2,526 2,689    
    Labour Eamon Tuffy*11.661,7992,123 2,155 2,206 2,269 2,438 2,493 2,511 2,727  
    Fine Gael William Lavelle8.471,3071,939 1,957 2,022 2,057 2,122 2,191 2,207 2,340 2,608 
    Fianna Fáil Shane Moynihan 5.63868939 994 1,013 1,029 1,062 1,495 1,537 1,625 1,810 1,834
    Labour Caitriona Jones*5.55856969 1,006 1,054 1,132 1,257 1,309 1,319 1,471 1,944 2,040
    Fianna Fáil Edno Cooney4.89754783 940 946 968 985      
    Green Kevin Farrell4.77736840 865 936 994 1,057 1,125 1,139 1,310   
    Workers' Party Mick Finnegan4.57705745 752 774 871       
    Independent Jim Doyle3.71572632 638 811 885 1,037 1,081 1,088    
    Sinn Féin Robert Ballesty3.68568588 597 610        
    Independent Tom Dowling3.39523587 594         
    Fianna Fáil Shaleem Ahmed2.90448465          
    Electorate: 30,945  Valid: 15,425 (49.85%)  Spoilt: 178  Quota: 2,571  Turnout: 15,603 (50.42%)  

      Rathfarnam

      Rathfarnam - 4 seats
      PartyCandidateFPv%Count
      123456
      Fine Gael Cáit Keane *21.013,639     
      Fianna Fáil John Lahart*20.813,605     
      Labour Paddy Cosgrave*19.803,4313,460 3,482   
      Fine Gael Emma Coburn17.443,0223,138 3,158 3,230 3,330 3,516
      Independent Vincent Kenny6.311,0931,100 1,110 1,282 1,435 1,509
      Green Elizabeth Davidson5.66981992 1,006 1,056 1,172 1,348
      Fianna Fáil John Phelan3.45597603 670 687 720  
      Sinn Féin Sorcha Nic Cormaic3.18551553 556 586   
      Independent Gerard Dolan1.32228229 231    
      Independent Frank O'Gorman1.02177179 181    
      Electorate: 32,136  Valid: 17,324 (53.91%)  Spoilt: 190  Quota: 3,465  Turnout: 17,514 (54.50%)  

        Tallaght Central

        Tallaght Central - 6 seats
        PartyCandidateFPv%Count
        123456789
        Labour Mick Duff13.153,1253,151 3,206 3,287 3,373 3,460   
        Fine Gael Colm Brophy*12.983,0853,094 3,170 3,211 3,307 3,369 3,378 4,270 
        Sinn Féin Seán Crowe *11.422,7152,759 2,787 2,844 3,006 3,050 3,061 3,194 3,441
        Labour Pamela Kearns11.122,6432,664 2,733 2,808 2,925 2,986 2,998 3,181 3,275
        Labour Dermot Looney9.802,3292,346 2,382 2,418 2,849 2,894 2,902 3,105 3,318
        Socialist Party Mick Murphy*9.082,1592,205 2,226 2,320 2,628 2,684 2,692 2,883 2,940
        Fianna Fáil Eamonn Walsh7.441,7681,777 1,816 1,851 1,899 3,098 3,108 3,195 3,241
        Fine Gael Gay Kelly7.021,6681,682 1,706 1,737 1,794 1,848 1,854   
        Fianna Fáil Joe Neville*6.651,5801,594 1,621 1,653 1,700     
        People Before Profit Pat Dunne5.561,3461,357 1,404 1,495      
        Independent David Hutchinson-Edgar2.36562630 655       
        Green Arthur Doohan2.02479488        
        Independent Ray Kelly1.30309        
        Electorate: 44,783  Valid: 23,768 (53.07%)  Spoilt: 295  Quota: 3,396  Turnout: 24,063 (53.73%)  

          Tallaght South

          Tallaght South - 5 seats
          PartyCandidateFPv%Count
          12345678
          Labour Eamonn Maloney *15.402,3442,377 2,445 2,499 2,540   
          Sinn Féin Cathal King*15.192,3122,347 2,376 2,427 2,981   
          Fine Gael Brian Lawlor12.651,9261,962 1,997 2,042 2,076 2,105 2,219 2,296
          Labour Marie Corr*12.581,9152,000 2,148 2,193 2,318 2,452 2,799 
          Fine Gael Karen Warren*10.871,6551,680 1,724 1,793 1,816 1,863 2,108 2,196
          Fianna Fáil John Hannon*10.131,5421,616 1,647 2,038 2,060 2,087 2,167 2,211
          Independent Baby Perrepadan5.25799877 1,032 1,091 1,118 1,216   
          Sinn Féin Sinead Cooke5.20792817 844 878     
          Fianna Fáil Tara de Buitlear4.66710804 828      
          Green Tendai Madondo4.18636674       
          Fianna Fáil Dermot Flanagan2.60396       
          Independent Frank O'Gorman1.27193       
          Electorate: 35,234  Valid: 15,220 (43.20%)  Spoilt: 217  Quota: 2,537  Turnout: 15,437 (43.81%)  

            Related Research Articles

            In many countries, a mayor is the highest-ranking official in a municipal government such as that of a city or a town. Worldwide, there is a wide variance in local laws and customs regarding the powers and responsibilities of a mayor as well as the means by which a mayor is elected or otherwise mandated. Depending on the system chosen, a mayor may be the chief executive officer of the municipal government, may simply chair a multi-member governing body with little or no independent power, or may play a solely ceremonial role. A mayor's duties and responsibilities may be to appoint and oversee municipal managers and employees, provide basic governmental services to constituents, and execute the laws and ordinances passed by a municipal governing body. Options for selection of a mayor include direct election by the public, or selection by an elected governing council or board.

            <span class="mw-page-title-main">Member of the Senedd</span> Representative in the devolved parliament of Wales

            A member of the Senedd is a representative elected to the Senedd. There are sixty members, with forty members chosen to represent individual Senedd constituencies, and twenty to represent the five electoral regions of the Senedd in Wales.
            <span class="mw-page-title-main">Elections in Mauritania</span>

            Elections in Mauritania encompass four different types: presidential elections, parliamentary elections, regional elections and local elections.

            <span class="mw-page-title-main">Elections in Mexico</span>

            Elections in Mexico are held every 6 years to elect a president and every 3 years to elect a legislature. These elections determine who, on the national level, takes the position of the head of state – the president – as well as the legislature.

            Romania elects on a national level a head of state – the president – and a legislature. The president is elected for a five-year term by the people. The Romanian Parliament has two chambers. The Chamber of Deputies has currently 330 members, elected for a four-year term by party-list proportional representation on closed lists. The Senate has currently 136 members, elected for a four-year term by party-list proportional representation on closed lists.

            <span class="mw-page-title-main">Elections in Portugal</span>

            Elections in Portugal are free, fair, and regularly held, in accordance with election law.

            Elections in Tanzania occur on both the local and national levels. The local government holds elections for street or village chair people. General elections at the national level elect the President and the members of the National Assembly. The president is elected for a five-year term.

            <span class="mw-page-title-main">Elections in South Korea</span>

            Elections in South Korea are held on a national level to select the President and the National Assembly. Local elections are held every four years to elect governors, metropolitan mayors, municipal mayors, and provincial and municipal legislatures.

            <span class="mw-page-title-main">Elections in Malta</span>

            Malta elects on a national level 6 MEPs representing Malta in the European Parliament, on a district level the legislature, on a local level the local councils, and on a community level the Administrative Committees.

            The Isle of Man partially elects its legislature at the national level. The High Court of Tynwald consists of two chambers. The House of Keys has 24 members, elected in a general election for a five-year term in 12 two-seat constituencies. Each voter has two votes and in each constituency the two candidates with the most votes are elected. The Legislative Council has 11 members: three ex-officio members and eight other members who are elected by the House of Keys for a five-year term. Political parties do not play an important role on the Island. The Isle of Man lowered its voting age from 18 to 16 in 2006.

            <span class="mw-page-title-main">Elections in Turkey</span>

            Elections in Turkey are held for six functions of government: presidential elections (national), parliamentary elections (national), municipality mayors (local), district mayors (local), provincial or municipal council members (local) and muhtars (local). Apart from elections, referendums are also held occasionally.

            Apart from general elections and by-elections, a midterm election refers to a type of election where the people can elect their representatives and other subnational officeholders in the middle of the term of the executive. This is usually used to describe elections to a governmental body that are staggered so that the number of offices of that body would not be up for election at the same time. Only a fraction of a body seats are up for election while others are not until the terms of the next set of members are to expire. The legislators may have the same or longer fixed term of office as the executive, which facilitates an election midterm of the tenure of the higher office.
            <span class="mw-page-title-main">Municipalities of Denmark</span> Type of administrative division in Denmark

            Denmark is divided into five regions, which contain 98 municipalities. The Capital Region has 29 municipalities, Southern Denmark 22, Central Denmark 19, Zealand 17 and North Denmark 11. The government intends to merge R. Hovedstaden with R. Sjælland 1 January 2027 to form Region Østdanmark. The regional council will have 41 members, and will be elected Tuesday 18 November 2025 in the ordinary 2025 Danish local elections.

            <span class="mw-page-title-main">2012 Plymouth City Council election</span> 2012 UK local government election

            The 2012 Plymouth City Council election took place on 3 May 2012 to elect members of Plymouth City Council in England. This was on the same day as other local elections. The election was won by the Labour Party, who gained control of the council from the Conservative Party.

            <span class="mw-page-title-main">2014 United Kingdom local elections</span>

            The 2014 United Kingdom local elections were held on 22 May 2014. Usually these elections are held on the first Thursday in May but were postponed to coincide with the 2014 European Parliament Elections. Direct elections were held for all 32 London boroughs, all 36 metropolitan boroughs, 74 district/borough councils, 19 unitary authorities and various mayoral posts in England and elections to the new councils in Northern Ireland.

            The 1971 Havering Council election took place on 13 May 1971 to elect members of Havering London Borough Council in London, England. The whole council was up for election and the Labour Party gained overall control of the council.

            The 1974 Havering Council election took place on 2 May 1974 to elect members of Havering London Borough Council in London, England. The whole council was up for election and the council went in no overall control.
            <span class="mw-page-title-main">2021 United Kingdom local elections</span> Elections to local councils and mayoralties

            The 2021 United Kingdom local elections were held on Thursday 6 May 2021. More than 145 English local councils, around 5,000 councillor seats, thirteen directly elected mayors in England, and 39 police and crime commissioners in England and Wales were contested. On the same day, the 2021 Hartlepool by-election took place, and there were also elections to the Scottish Parliament, Senedd and London Assembly, the last in conjunction with the London mayoral election.

            <span class="mw-page-title-main">2022 Bolton Metropolitan Borough Council election</span> 2022 local election in Bolton

            The 2022 Bolton Metropolitan Borough Council election took place on 5 May 2022. One third of councillors—20 out of 60—were to be elected. The election took place alongside other local elections across the United Kingdom.

            <span class="mw-page-title-main">2022 Oldham Metropolitan Borough Council election</span> 2022 local election in Oldham

            The 2022 Oldham Metropolitan Borough Council election took place on 5 May 2022. One third—20 out of 60—of councillors on Oldham Council was elected. The election took place alongside other local elections across the United Kingdom.