| |||||||||||||||||||||||||||||||||||||
24 seats to the council of the electoral county of Fingal within Dublin County Council | |||||||||||||||||||||||||||||||||||||
---|---|---|---|---|---|---|---|---|---|---|---|---|---|---|---|---|---|---|---|---|---|---|---|---|---|---|---|---|---|---|---|---|---|---|---|---|---|
| |||||||||||||||||||||||||||||||||||||
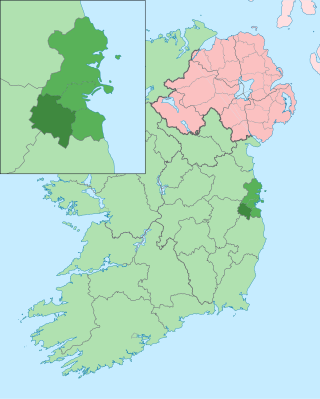
Map showing the area of Fingal County Council | |||||||||||||||||||||||||||||||||||||
|
An election to the electoral county of Fingal within Dublin County to Dublin County Council took place on 27 June 1991 as part of that year's Irish local elections. 24 councillors were elected for a five-year term of office from six local electoral areas (LEAs) on the system of proportional representation by means of the single transferable vote (PR-STV). [1] It was one of three electoral counties within Dublin County at this election, the others being Dún Laoghaire–Rathdown and South Dublin. The term was extended twice, first to 1998, then to 1999. [2] [3]
The electoral county had been established in 1985 as Dublin–Fingal and was renamed Fingal for these local elections. [4]
From 1 January 1994, on the coming into effect of the Local Government (Dublin) Act 1993, County Dublin was disestablished as an administrative county, and in its place the electoral counties became three new counties. The councillors listed below became the councillors for Fingal County Council from that date. [5]
Party | Seats | ± | First Pref. votes | FPv% | ±% | |
---|---|---|---|---|---|---|
Fianna Fáil | 8 | -5 | 15,264 | 31.7 | ||
Fine Gael | 6 | -1 | 9,753 | 20.2 | ||
Labour | 5 | +2 | 8,435 | 17.5 | ||
Green | 2 | +2 | 4,080 | 8.5 | ||
Progressive Democrats | 1 | +1 | 3,430 | 7.1 | ||
Independent | 2 | +1 | 5,012 | 10.4 | ||
Totals | 24 | 0 | 48,230 | 100.0 | — |
Party | Candidate | FPv% | Count | |||||||||||
---|---|---|---|---|---|---|---|---|---|---|---|---|---|---|
1 | 2 | 3 | 4 | 5 | 6 | 7 | 8 | 9 | 10 | 11 | ||||
Labour | Ken Farrell* | 17.5% | 1,865 | |||||||||||
Green | Trevor Sargent | 13.2% | 1,405 | 1,413 | 1,464 | 1,507 | 1,532 | 1,730 | 1,957 | |||||
Fianna Fáil | Sean Gilbride* | 10.4% | 1,104 | 1,107 | 1,114 | 1,126 | 1,204 | 1,267 | 1,306 | 1,318 | 1,463 | 1,554 | 1,671 | |
Fianna Fáil | Jim Geraghty* | 8.6% | 916 | 922 | 923 | 925 | 1,017 | 1,072 | 1,100 | 1,103 | 1,190 | 1,222 | 1,260 | |
Fine Gael | Cathal Boland* | 8.2% | 871 | 878 | 882 | 1,015 | 1,037 | 1,137 | 1,168 | 1,191 | 1,266 | 1,457 | 1,679 | |
Fianna Fáil | Jack Larkin* | 6.7% | 711 | 712 | 727 | 744 | 789 | 796 | 862 | 880 | 1,167 | 1,309 | 1,489 | |
Fianna Fáil | John Maxwell | 6.2% | 665 | 666 | 668 | 674 | 731 | 732 | 747 | 752 | ||||
Labour | Joe Davis | 5.7% | 608 | 653 | 695 | 722 | 738 | 754 | 855 | 897 | 924 | 1,108 | ||
Progressive Democrats | David Murray | 5.5% | 585 | 587 | 595 | 638 | 648 | 681 | 766 | 830 | 879 | |||
Independent | Liam Dineen | 5% | 532 | 535 | 553 | 557 | 563 | |||||||
Independent | Gertie Sheilds | 4.7% | 503 | 506 | 534 | 565 | 572 | 634 | ||||||
Fianna Fáil | Wilbur McKittrick | 3.5% | 374 | 381 | 386 | 387 | ||||||||
Fine Gael | Patricia Gallen | 2.9% | 313 | 314 | 324 | |||||||||
Workers' Party | Anne McCarthy | 1.2% | 123 | 125 | ||||||||||
Independent | Sean Brady | 0.7% | 78 | 78 | ||||||||||
Electorate: 19,705 Valid: 10,653 (54.1%) Spoilt: 100 Quota: 1,776 Turnout: 10,753 (54.6%) |
Party | Candidate | FPv% | Count | |||||||||||
---|---|---|---|---|---|---|---|---|---|---|---|---|---|---|
1 | 2 | 3 | 4 | 5 | 6 | 7 | 8 | 9 | 10 | 11 | ||||
Independent | Seán Lyons* | 18.5% | 1,378 | 1,396 | 1,412 | 1,446 | 1,523 | |||||||
Fine Gael | Tom Morrissey | 15.8% | 1,172 | 1,213 | 1,217 | 1,228 | 1,249 | 1,259 | 1,333 | 1,338 | 1,814 | |||
Progressive Democrats | Sheila Terry | 14.7% | 1,093 | 1,099 | 1,106 | 1,121 | 1,172 | 1,214 | 1,401 | 1,417 | 1,683 | |||
Fianna Fáil | Ned Ryan* | 10.9% | 807 | 812 | 815 | 818 | 823 | 942 | 978 | 981 | 1,049 | 1,124 | 1,181 | |
Fine Gael | Eithne Loftus | 10.5% | 780 | 825 | 829 | 833 | 853 | 878 | 950 | 958 | ||||
Fianna Fáil | Tom Boland* | 10.1% | 752 | 753 | 761 | 768 | 770 | 954 | 989 | 993 | 1,037 | 1,112 | 1,164 | |
Fianna Fáil | Miley Caldwell | 5.9% | 439 | 442 | 446 | 450 | 455 | |||||||
Green | Paul Gogarty | 5.3% | 391 | 391 | 394 | 448 | 549 | 576 | ||||||
Workers' Party | Patricia Condron | 2.6% | 196 | 197 | 213 | |||||||||
Labour | Joanna Tuffy | 2.2% | 167 | 169 | 239 | 316 | ||||||||
Labour | Willie Byrne | 1.8% | 136 | 137 | ||||||||||
Fine Gael | Patrick Malone | 1.7% | 123 | |||||||||||
Electorate: 15,777 Valid: 7,434 (47.1%) Spoilt: 29 Quota: 1,487 Turnout: 7,463 (47.3%) |
Party | Candidate | FPv% | Count | |||||||||
---|---|---|---|---|---|---|---|---|---|---|---|---|
1 | 2 | 3 | 4 | 5 | 6 | 7 | 8 | 9 | ||||
Fine Gael | Michael Joe Cosgrave TD* | 17.7% | 1,342 | 1,401 | 1,457 | 1,502 | 1,545 | |||||
Fine Gael | Joan Maher* | 15% | 1,141 | 1,155 | 1,204 | 1,255 | 1,300 | 1,301 | 1,541 | |||
Green | David Healy | 10.4% | 789 | 797 | 869 | 914 | 938 | 943 | 1,155 | 1,275 | 1,454 | |
Fianna Fáil | Liam Creaven* | 9.3% | 704 | 822 | 841 | 877 | 1,053 | 1,060 | 1,166 | 1,784 | ||
Workers' Party | Niall Behan | 9.2% | 695 | 711 | 908 | 923 | 953 | 955 | 1,091 | 1,131 | 1,190 | |
Fianna Fáil | Dympna Clune | 7.2% | 550 | 589 | 597 | 625 | 893 | 901 | 964 | |||
Fianna Fáil | Tom Beary | 6.8% | 519 | 569 | 611 | 617 | ||||||
Progressive Democrats | Noel Peers | 6.7% | 511 | 540 | 570 | 864 | 885 | 888 | ||||
Progressive Democrats | Michael Kenny | 6.6% | 500 | 503 | 522 | |||||||
Labour | Frank Barry | 6.5% | 497 | 502 | ||||||||
Fianna Fáil | Eugene Rudden | 4.5% | 345 | |||||||||
Electorate: 16,807 Valid: 7,593 (45.2%) Spoilt: 56 Quota: 1,519 Turnout: 7,649 (45.5%) |
Party | Candidate | FPv% | Count | ||||||||
---|---|---|---|---|---|---|---|---|---|---|---|
1 | 2 | 3 | 4 | 5 | 6 | 7 | 8 | ||||
Fianna Fáil | Senator G.V. Wright * | 23.1% | 1,929 | ||||||||
Labour | Bernie Malone MEP* | 14.4% | 1,198 | 1,217 | 1,268 | 1,298 | 1,363 | 1,475 | 1,527 | 1,702 | |
Fine Gael | Nora Owen TD* | 13.8% | 1,148 | 1,185 | 1,225 | 1,243 | 1,279 | 1,469 | 1,533 | 1,830 | |
Fianna Fáil | Michael Kennedy | 11.1% | 923 | 986 | 1,005 | 1,049 | 1,094 | 1,106 | 1,525 | 1,723 | |
Green | Alan Nagle | 9.7% | 813 | 827 | 856 | 915 | 957 | 1,047 | 1,082 | 1,222 | |
Fine Gael | Terri Jones | 8% | 670 | 672 | 705 | 732 | 826 | 848 | 870 | ||
Fianna Fáil | Pat Dunne* | 5.7% | 472 | 581 | 603 | 622 | 629 | 650 | |||
Progressive Democrats | Bill O'Brien | 4.7% | 394 | 401 | 405 | 415 | 493 | ||||
Progressive Democrats | Mary Webberley | 4.2% | 347 | 350 | 353 | 374 | |||||
Independent | Angela Keaveney | 2.9% | 241 | 244 | 252 | ||||||
Fine Gael | John Hancox | 2.5% | 211 | 213 | |||||||
Electorate: 16,431 Valid: 8,346 (50.8%) Spoilt: 37 Quota: 1,670 Turnout: 8,385 (51%) |
Party | Candidate | FPv% | Count | ||||||||
---|---|---|---|---|---|---|---|---|---|---|---|
1 | 2 | 3 | 4 | 5 | 6 | 7 | 8 | ||||
Independent | Joe Higgins | 19.6% | 1,281 | 1,294 | 1,316 | 1,347 | 1,464 | 1,581 | 1,652 | ||
Fine Gael | Marian Sheehan* | 29.2% | 906 | 920 | 933 | 1,020 | 1,025 | 1,151 | 1,200 | 1,289 | |
Fianna Fáil | Marian McGennis * | 13.8% | 903 | 955 | 969 | 1,031 | 1,054 | 1,099 | 1,536 | 1,642 | |
Labour | Joan Burton | 12.9% | 844 | 856 | 887 | 916 | 934 | 1,018 | 1,074 | 1,499 | |
Workers' Party | Ollie Lunney | 10.3% | 672 | 682 | 706 | 718 | 771 | 837 | 868 | ||
Fianna Fáil | Jim Fahey* | 9.5% | 620 | 651 | 662 | 670 | 685 | 730 | |||
Independent | Tom Reynolds | 6.9% | 450 | 459 | 491 | 507 | 527 | ||||
Sinn Féin | Jim Heffernan | 4% | 264 | 267 | 275 | 282 | |||||
Fine Gael | Jim Fleming | 3.9% | 254 | 255 | 268 | ||||||
Green | Anthony McGuinness | 2.6% | 168 | 177 | |||||||
Fianna Fáil | P.J. Leahy | 1.9% | 123 | ||||||||
Independent | Frank Clarke | 0.54% | 35 | ||||||||
Electorate: 13,768 Valid: 6,520 (47.4%) Spoilt: 72 Quota: 1,631 Turnout: 6,592 (47.9%) |
Party | Candidate | FPv% | Count | |||||||||
---|---|---|---|---|---|---|---|---|---|---|---|---|
1 | 2 | 3 | 4 | 5 | 6 | 7 | 8 | 9 | ||||
Labour | Seán Ryan TD* | 34.7% | 2,667 | |||||||||
Fianna Fáil | Cyril Gallagher* | 11.3% | 872 | 963 | 998 | 1,003 | 1,046 | 1,496 | 1,562 | |||
Fianna Fáil | Margaret O'Connor | 10.5% | 809 | 846 | 854 | 917 | 963 | 1,177 | 1,285 | 1,299 | 1,316 | |
Fianna Fáil | Larry Mulvihil | 9.5% | 727 | 821 | 840 | 857 | 887 | |||||
Fine Gael | Anne Devitt* | 9% | 689 | 783 | 875 | 893 | 988 | 1,065 | 1,268 | 1,316 | 1,324 | |
Green | Tommy Nolan | 6.7% | 514 | 608 | 640 | 718 | 893 | 937 | ||||
Labour | Tom Kelleher* | 5.9% | 453 | 1,006 | 1,034 | 1,154 | 1,251 | 1,287 | 1,599 | |||
Independent | Elaine Hobson | 5.3% | 406 | 466 | 507 | 562 | ||||||
Workers' Party | Tim O'Brien | 4% | 306 | 366 | 380 | |||||||
Fine Gael | Tom McCormack | 1.7% | 133 | 162 | ||||||||
Independent | Noel Crosbie | 1.4% | 108 | 126 | ||||||||
Electorate: 17,053 Valid: 7,684 (45%) Spoilt: 54 Quota: 1,537 Turnout: 7,738 (45.4%) |
South Dublin is a county in Ireland, within the province of Leinster and the Eastern and Midland Region. It is one of three successor counties to County Dublin, which was disestablished for administrative purposes in 1994. South Dublin County Council is the local authority for the county. The county contains both dense suburbs of Dublin and stretches of unpopulated mountain. In 2016 it had a population of 278,767, making it the third most populous county in the state.
Dublin County Council was a local authority for the administrative county of County Dublin in Ireland.
Dún Laoghaire–Rathdown is a county in Ireland. It is in the province of Leinster and the Eastern and Midland Region. It is one of three successor counties to County Dublin, which was disestablished in 1994. It is named after the former borough of Dún Laoghaire and the barony of Rathdown. Dún Laoghaire–Rathdown County Council is the local authority for the county. The population of the county was 218,018 at the time of the 2016 census.
Fingal is a county in Ireland. It is in the province of Leinster and is part of the Eastern and Midland Region. It is one of three successor counties to County Dublin, which was disestablished for administrative purposes in 1994. Its name is derived from the medieval territory of Scandinavian foreigners that settled in the area. Fingal County Council is the local authority for the county. In 2022 the population of the county was 329,000, making it the second most populated council in Dublin and the third most populous county in the state.
Dublin North was a parliamentary constituency represented in Dáil Éireann, the lower house of the Irish parliament or Oireachtas, from 1981 to 2016 representing an area in the north of County Dublin. The method of election was proportional representation by means of the single transferable vote (PR-STV).
Dublin North-West is a parliamentary constituency represented in Dáil Éireann, the lower house of the Irish parliament or Oireachtas. The constituency elects 3 deputies on the system of proportional representation by means of the single transferable vote (PR-STV).
The functions of local government in the Republic of Ireland are mostly exercised by thirty-one local authorities, termed County, City, or City and County Councils. The principal decision-making body in each of the thirty-one local authorities is composed of the members of the council, elected by universal franchise in local elections every five years from multi-seat local electoral areas using the single transferable vote. Many of the authorities' statutory functions are, however, the responsibility of ministerially appointed career officials termed Chief executives. The competencies of the city and county councils include planning, transport infrastructure, sanitary services, public safety and the provision of public libraries. Each local authority sends representatives to one of three Regional Assemblies.
Dún Laoghaire–Rathdown County Council is the authority responsible for local government in the county of Dún Laoghaire–Rathdown, Ireland. It is one of three local authorities that succeeded the former Dublin County Council on its abolition on 1 January 1994 and one of four councils in the old County Dublin. As a county council, it is governed by the Local Government Act 2001. The council is responsible for housing and community, roads and transportation, urban planning and development, amenity and culture, and environment. The council has 40 elected members. Elections are held every five years and are by single transferable vote. The head of the council has the title of Cathaoirleach (chairperson). The county administration is headed by a Chief Executive, Frank Curran. The county town is Dún Laoghaire. It serves a population of approximately 206,260.
Fingal County Council is the local authority of the county of Fingal, Ireland. It is one of three local authorities that succeeded the former Dublin County Council on abolition on 1 January 1994 and is one of four local authorities in County Dublin. As a county council, it is governed by the Local Government Act 2001. The council is responsible for housing and community, roads and transport, urban planning and development, amenity and culture, and environment. The council has 40 elected members. Elections are held every five years and are by single transferable vote. The head of the council has the title of Mayor. The county administration is headed by a Chief Executive, AnnMarie Farrelly. The county town is Swords.
South Dublin County Council is the authority responsible for local government in the county of South Dublin, Ireland. It is one of three local authorities created by the Local Government (Dublin) Act 1993 to succeed the former Dublin County Council before its abolition on 1 January 1994 and one of four councils in County Dublin. As a county council, it is governed by the Local Government Act 2001. The council is responsible for housing and community, roads and transportation, urban planning and development, amenity and culture, and environment. The council has 40 elected members. Elections are held every five years and are by single transferable vote. The head of the council has the title of Mayor. The county administration is headed by a Chief Executive, Daniel McLoughlin. The county town is Tallaght, with a civic centre at Monastery Road, Clondalkin. It serves a population of approximately 192,000.
The 1999 Irish local elections were held in all the counties, cities and towns of Ireland on Friday, 11 June 1999, on the same day as the European elections.
An election to Louth County Council took place on 27 June 1991 as part of that year's Irish local elections. 26 councillors were elected from five local electoral areas (LEAs) for a five-year term of office on the electoral system of proportional representation by means of the single transferable vote (PR-STV). This term was extended twice, first to 1998, then to 1999.
An election to Waterford County Council took place on 27 June 1991 as part of that year's Irish local elections. 23 councillors were elected from four local electoral areas (LEAs) for a five-year term of office on the electoral system of proportional representation by means of the single transferable vote (PR-STV). This term was extended twice, first to 1998, then to 1999.
An election to Dublin County Council in the electoral county of Dún Laoghaire–Rathdown within Dublin County took place on 27 June 1991 as part of that year's Irish local elections. 28 councillors were elected from 7 local electoral areas on the system of proportional representation by means of the single transferable vote for a five-year term of office. It was one of three electoral counties within Dublin County at this election, the others being Fingal and South Dublin.
An election to the council of the electoral county of South Dublin within Dublin County to Dublin County Council took place on 27 June 1991 as part of that year's Irish local elections. 26 councillors were elected for a five-year term of office from five local electoral areas on the system of proportional representation by means of the single transferable vote. It was one of three electoral counties within Dublin County at this election, the others being Fingal and Dún Laoghaire–Rathdown. The term was extended twice, first to 1998, then to 1999.
An election to Dublin City Council took place on 27 June 1991 as part of that year's Irish local elections. 52 councillors were elected from twelve local electoral areas (LEAs) for a five-year term of office on the electoral system of proportional representation by means of the single transferable vote (PR-STV). This term was extended twice, first to 1998, then to 1999.
An election to Dublin County Council took place on 20 June 1985 as part of that year's Irish local elections. Councillors were elected from local electoral areas by PR-STV voting for a six-year term of office.
An election to Dublin County Council took place on 27 June 1991 as part of that year's Irish local elections. Councillors were elected for a five-year term of office from local electoral areas (LEAs) on the system of proportional representation by means of the single transferable vote (PR-STV). It was the last election held for Dublin County Council.
An election to Dublin County Council in the electoral county of Dublin–Fingal within Dublin County took place on 20 June 1985 as part of that year's Irish local elections. Councillors were elected from local electoral areas on the system of proportional representation by means of the single transferable vote voting for a six-year term of office.
Local government in Dublin, the capital city of Ireland, is currently administered through the local authorities of four local government areas. The historical development of these councils dates back to medieval times.