This article includes a list of general references, but it lacks sufficient corresponding inline citations .(July 2021) |
| |||||||||||||||||||||||||||||||||||||
All 48 seats on Cork County Council | |||||||||||||||||||||||||||||||||||||
---|---|---|---|---|---|---|---|---|---|---|---|---|---|---|---|---|---|---|---|---|---|---|---|---|---|---|---|---|---|---|---|---|---|---|---|---|---|
| |||||||||||||||||||||||||||||||||||||
Map showing the area of Cork County Council | |||||||||||||||||||||||||||||||||||||
|
An election to Cork County Council took place on 27 June 1991 as part of that year's Irish local elections. 48 councillors were elected from eight local electoral areas (LEAs) for a five-year term of office on the electoral system of proportional representation by means of the single transferable vote (PR-STV). This term was extended twice, first to 1998, then to 1999. [1] [2]
Party | Seats | ± | First Pref. votes | FPv% | ±% | |
---|---|---|---|---|---|---|
Fine Gael | 20 | +1 | 41,742 | 35.4 | ||
Fianna Fáil | 19 | -5 | 43,211 | 36.7 | ||
Labour | 4 | +2 | 7,246 | 6.2 | ||
Progressive Democrats | 1 | +1 | 6,463 | 5.5 | ||
Workers' Party | 1 | 0 | 5,097 | 4.3 | ||
Independent | 3 | +1 | 11,205 | 9.5 | ||
Totals | 48 | 0 | 117,899 | 100.0 | — |
Party | Candidate | FPv% | Count | ||||||||||||
---|---|---|---|---|---|---|---|---|---|---|---|---|---|---|---|
1 | 2 | 3 | 4 | 5 | 6 | 7 | 8 | 9 | 10 | 11 | 12 | ||||
Fine Gael | Michael Creed TD* | 17.1% | 3,267 | ||||||||||||
Fianna Fáil | Peter Callanan * | 14.6% | 2,797 | ||||||||||||
Fianna Fáil | Donal Moynihan * | 13.2% | 2,519 | ||||||||||||
Fine Gael | Eddie Lucey* | 12.3% | 2,347 | 2,489 | |||||||||||
Fine Gael | Kevin Murphy* | 12% | 2,301 | 2,327 | 2,376 | 2,377 | 2,433 | ||||||||
Fine Gael | Frank Metcalfe | 7.1% | 1,366 | 1,730 | 1,735 | 1,739 | 1,748 | 1,778 | 1,842 | 1,917 | 2,088 | 2,438 | |||
Fianna Fáil | Jim Long* | 5.2% | 1,004 | 1,061 | 1,150 | 1,228 | 1,231 | 1,261 | 1,286 | 1,301 | 1,401 | 1,587 | 1,588 | 1,607 | |
Fianna Fáil | Alan Coleman | 4.8% | 916 | 923 | 1,091 | 1,106 | 1,121 | 1,244 | 1,248 | 1,403 | 1,497 | 1,585 | 1,596 | 1,614 | |
Green | Paula Giles | 3.6% | 695 | 724 | 759 | 763 | 787 | 858 | 864 | 964 | |||||
Progressive Democrats | Jerry Kelleher | 3.5% | 672 | 905 | 910 | 932 | 936 | 951 | 965 | 1,123 | 1,294 | ||||
Progressive Democrats | John Kevin Coleman* | 3.2% | 605 | 613 | 648 | 650 | 661 | 712 | 718 | ||||||
Independent | Dermot Ryan | 2.4% | 468 | 473 | 481 | 482 | 499 | ||||||||
Independent | Frank Collins | 0.9% | 170 | 175 | 187 | 188 | |||||||||
Electorate: 30,218 Valid: 19,127 (63.3%) Spoilt: 172 Quota: 2,391 Turnout: 19,289 (63.8%) |
Party | Candidate | FPv% | Count | ||||||
---|---|---|---|---|---|---|---|---|---|
1 | 2 | 3 | 4 | 5 | 6 | ||||
Fine Gael | Tomas Ryan* | 16.9% | 1,569 | 1,604 | 1,698 | 1,741 | 2,554 | ||
Fianna Fáil | Dan Fleming* | 13.5% | 1,253 | 1,285 | 1,357 | 1,676 | 1,759 | 1,860 | |
Fianna Fáil | Annette McNamara | 12.3% | 1,137 | 1,202 | 1,297 | 1,469 | 1,516 | 1,576 | |
Fianna Fáil | Tom Joyce | 10.5% | 975 | 1,007 | 1,153 | 1,482 | 1,524 | 1,563 | |
Fianna Fáil | Donal O'Connell* | 10.5% | 968 | 986 | 1,086 | ||||
Fine Gael | George Osborne* | 10.3% | 953 | 990 | 1,143 | 1,223 | |||
Labour | Sheila O'Sullivan | 9.8% | 912 | 1,155 | 1,378 | 1,454 | 1,591 | 1,856 | |
Progressive Democrats | Michael Burns | 9.5% | 884 | 972 | |||||
Workers' Party | Patrick Corbett | 3.8% | 353 | ||||||
Green | Thomas Hyland | 2.8% | 257 | ||||||
Electorate: 19,771 Valid: 9,261 (46.8%) Spoilt: 64 Quota: 1,853 Turnout: 9,325 (47.2%) |
Party | Candidate | FPv% | Count | |||||||||||
---|---|---|---|---|---|---|---|---|---|---|---|---|---|---|
1 | 2 | 3 | 4 | 5 | 6 | 7 | 8 | 9 | 10 | 11 | ||||
Fianna Fáil | Senator Batt O'Keeffe * | 22% | 3,081 | |||||||||||
Fianna Fáil | Barry Cogan * | 11.5% | 1,614 | 1,906 | 1,918 | 1,935 | 1,965 | 2,001 | 2,400 | |||||
Labour | Paula Desmond* | 8.5% | 1,195 | 1,230 | 1,238 | 1,488 | 1,700 | 1,773 | 1,842 | 1,873 | 1,979 | 2,427 | ||
Fine Gael | Sylvester Cotter | 6.9% | 968 | 982 | 1,033 | 1,043 | 1,061 | 1,203 | 1,257 | 1,267 | 1,608 | 1,665 | 1,707 | |
Independent | Kevin Meaney | 6.9% | 966 | 996 | 1,010 | 1,024 | 1,174 | 1,204 | 1,290 | 1,320 | 1,367 | |||
Fine Gael | Braham Brennan* | 6.8% | 953 | 967 | 1,019 | 1,027 | 1,055 | 1,100 | 1,161 | 1,177 | 1,423 | 1,639 | 1,718 | |
Fine Gael | Barry O'Mahony | 5.9% | 827 | 877 | 1,003 | 1,026 | 1,048 | 1,065 | 1,074 | 1,077 | ||||
Fianna Fáil | Mary Buwalda-Wagner | 5.6% | 785 | 915 | 920 | 928 | 943 | 967 | ||||||
Progressive Democrats | Derry Canty | 5.4% | 757 | 931 | 1,029 | 1,184 | 1,213 | 1,562 | 1,616 | 1,625 | 1,748 | 1,867 | 1,918 | |
Progressive Democrats | Peter Kelly | 5.2% | 725 | 740 | 749 | 759 | 808 | |||||||
Fianna Fáil | Mary Connole | 4.7% | 656 | 850 | 854 | 860 | 922 | 981 | 1,158 | 1,378 | 1,426 | 1,513 | 1,538 | |
Workers' Party | Con O'Mahony | 4.4% | 613 | 633 | 647 | 691 | ||||||||
Labour | Tony Lancaster | 3.4% | 475 | 524 | 578 | |||||||||
Fine Gael | Liam Ward | 2.9% | 406 | 466 | ||||||||||
Electorate: 33,220 Valid: 14,021 (42.2%) Spoilt: 99 Quota: 2,004 Turnout: 14,120 (42.5%) |
Party | Candidate | FPv% | Count | |||||||
---|---|---|---|---|---|---|---|---|---|---|
1 | 2 | 3 | 4 | 5 | 6 | 7 | ||||
Fine Gael | Frank Crowley TD* | 16.7% | 2,610 | |||||||
Fianna Fáil | Jack Roche* | 13.2% | 2,067 | 2,071 | 2,096 | 2,162 | 2,307 | |||
Fianna Fáil | Laurence Kelly TD* | 10.8% | 1,689 | 1,693 | 1,729 | 1,762 | 1,811 | 2,417 | ||
Fine Gael | Billy Biggane | 10.6% | 1,652 | 1,662 | 1,715 | 1,735 | 2,068 | 2,371 | ||
Fianna Fáil | J.B. Murphy* | 10% | 1,555 | 1,557 | 1,568 | 1,749 | 1,828 | 2,058 | 2,222 | |
Fine Gael | Gerard Murphy | 9.5% | 1,480 | 1,480 | 1,543 | 1,673 | 2,153 | 2,198 | 2,212 | |
Fianna Fáil | Mike Donegan* | 8.8% | 1,377 | 1,395 | 1,405 | 1,418 | 1,439 | |||
Labour | Bill Cashin | 8.5% | 1,327 | 1,358 | 1,414 | 1,495 | 1,623 | 1,724 | 1,733 | |
Fine Gael | Charles Barry* | 7.5% | 1,168 | 1,173 | 1,284 | 1,325 | ||||
Progressive Democrats | Sean O'Riordan | 3.8% | 593 | 601 | 616 | |||||
Workers' Party | Dan Curtin | 0.6% | 89 | |||||||
Electorate: 22,012 Valid: 15,604 (70.9%) Spoilt: 89 Quota: 2,230 Turnout: 15,693 (71.3%) |
Party | Candidate | FPv% | Count | ||||||||||||||||
---|---|---|---|---|---|---|---|---|---|---|---|---|---|---|---|---|---|---|---|
1 | 2 | 3 | 4 | 5 | 6 | 7 | 8 | 9 | 10 | 11 | 12 | 13 | 14 | 15 | |||||
Fianna Fáil | Ned O'Keeffe TD* | 17.5% | 3,419 | ||||||||||||||||
Fine Gael | Paul Bradford TD* | 14.1% | 2,761 | ||||||||||||||||
Workers' Party | Joe Sherlock TD* | 13.6% | 2,650 | ||||||||||||||||
Fianna Fáil | Carey Joyce * | 8.4% | 1,633 | 2,041 | 2,052 | 2,058 | 2,142 | 2,158 | 2,218 | 2,247 | 2,266 | 2,393 | 2,517 | ||||||
Fine Gael | Conor O'Callaghan | 6.7% | 1,313 | 1,430 | 1,473 | 1,479 | 1,507 | 1,522 | 1,543 | 1,685 | 1,748 | 1,885 | 1,908 | 2,086 | 2,089 | 2,159 | 2,262 | ||
Fine Gael | Aileen Pyne | 6.7% | 1,306 | 1,335 | 1,388 | 1,396 | 1,461 | 1,490 | 1,604 | 1,612 | 1,650 | 1,740 | 1,956 | 2,519 | |||||
Fianna Fáil | Ted O'Riordan | 4.1% | 806 | 943 | 968 | 989 | 994 | 1,038 | 1,051 | 1,058 | 1,085 | 1,177 | 1,191 | 1,201 | 1,212 | 1,214 | 1,492 | ||
Fine Gael | Michael Lane | 4.1% | 794 | 813 | 876 | 878 | 886 | 892 | 912 | 915 | 988 | 1,023 | 1,035 | ||||||
Fianna Fáil | Brendan Kelleher | 4% | 780 | 867 | 877 | 886 | 895 | 906 | 911 | 915 | 1,108 | 1,165 | 1,171 | 1,189 | 1,197 | 1,198 | 1,288 | ||
Independent | Tom Conroy | 3.4% | 667 | 684 | 711 | 741 | 748 | 863 | 919 | 930 | 981 | 1,045 | 1,110 | 1,127 | 1,132 | 1,135 | |||
Independent | Michael Broderick | 3.4% | 655 | 676 | 710 | 725 | 731 | 752 | 780 | 785 | |||||||||
Progressive Democrats | Naoise Leamy | 3.1% | 603 | 638 | 653 | 664 | 752 | 772 | 803 | 821 | 886 | ||||||||
Workers' Party | Tadhg O'Donovan | 2.9% | 557 | 569 | 571 | 601 | 615 | 636 | 687 | 900 | 910 | 928 | |||||||
Workers' Party | John Fitzgerald | 2.3% | 453 | 508 | 510 | 535 | 540 | 563 | 590 | ||||||||||
Green | Jim Bartley | 2.1% | 410 | 423 | 429 | 435 | 468 | 511 | |||||||||||
Labour | Tadhg Curtis | 1.9% | 372 | 381 | 404 | 439 | 442 | ||||||||||||
Progressive Democrats | John Guinevan | 1.9% | 372 | 378 | 383 | 385 | |||||||||||||
Electorate: 31,117 Valid: 19,540 (62.8%) Spoilt: 118 Quota: 2,443 Turnout: 19,658 (63.2%) |
Party | Candidate | FPv% | Count | |||||||||||||
---|---|---|---|---|---|---|---|---|---|---|---|---|---|---|---|---|
1 | 2 | 3 | 4 | 5 | 6 | 7 | 8 | 9 | 10 | 11 | 12 | 13 | ||||
Independent | Paddy Hegarty | 16.4% | 2,552 | |||||||||||||
Independent | Noel Collins* | 13.3% | 2,059 | 2,113 | 2,120 | 2,171 | 2,182 | 2,201 | 2,288 | |||||||
Fianna Fáil | Maurice Ahern* | 10.5% | 1,639 | 1,660 | 1,665 | 1,692 | 1,697 | 1,701 | 1,734 | 1,754 | 1,765 | 1,817 | 1,865 | 1,922 | 2,267 | |
Fine Gael | Matt Ahern* | 10% | 1,559 | 1,618 | 1,624 | 1,632 | 1,634 | 1,638 | 1,669 | 1,675 | 1,733 | 1,773 | 1,825 | 2,106 | 2,167 | |
Fine Gael | Michael Hegarty* | 9% | 1,402 | 1,449 | 1,454 | 1,465 | 1,469 | 1,477 | 1,525 | 1,533 | 1,542 | 1,576 | 1,640 | 1,950 | 2,005 | |
Fianna Fáil | John Brosnan* | 7.3% | 1,131 | 1,159 | 1,165 | 1,165 | 1,169 | 1,170 | 1,197 | 1,200 | 1,298 | 1,341 | 1,393 | 1,408 | 1,637 | |
Fianna Fáil | Kevin Foster* | 6.8% | 1,062 | 1,072 | 1,105 | 1,107 | 1,125 | 1,175 | 1,183 | 1,184 | 1,188 | 1,200 | 1,326 | 1,338 | ||
Labour | John Mulvihill * | 6.5% | 1,003 | 1,025 | 1,052 | 1,068 | 1,147 | 1,272 | 1,300 | 1,304 | 1,351 | 1,450 | 1,554 | 1,592 | 1,958 | |
Fine Gael | George Jeffrey | 4.9% | 768 | 797 | 805 | 806 | 810 | 815 | 850 | 855 | 858 | 860 | 915 | |||
Independent | William Kidney | 2.8% | 441 | 453 | 473 | 478 | 483 | 508 | 515 | 518 | 541 | |||||
Independent | Bob Bickerdike | 2.4% | 371 | 385 | 387 | 391 | 401 | 434 | 441 | 442 | ||||||
Progressive Democrats | Michael Joy | 2.3% | 362 | 372 | 383 | 391 | 396 | 400 | ||||||||
Green | Sean Bell | 2.3% | 350 | 361 | 370 | 375 | 394 | 411 | 460 | 468 | 560 | 603 | ||||
Independent | Maurice Quinlan | 1.9% | 288 | 293 | 314 | 315 | 351 | |||||||||
Workers' Party | Leo Owens | 1.3% | 196 | 199 | 202 | 239 | ||||||||||
Workers' Party | Tom Cashman | 1.2% | 186 | 189 | 189 | |||||||||||
Independent | Jack Twomey | 1.1% | 167 | 171 | ||||||||||||
Electorate: 28,321 Valid: 15,536 (54.9%) Spoilt: 128 Quota: 2,220 Turnout: 15,664 (55.3%) |
Party | Candidate | FPv% | Count | ||||||||||
---|---|---|---|---|---|---|---|---|---|---|---|---|---|
1 | 2 | 3 | 4 | 5 | 6 | 7 | 8 | 9 | 10 | ||||
Fine Gael | John Cal McCarthy* | 15.3% | 2,346 | ||||||||||
Fianna Fáil | Donal O'Rourke* | 11.6% | 1,768 | 1,803 | 1,836 | 1,855 | 1,865 | 2,094 | |||||
Fianna Fáil | D.F. O'Sullivan* | 11% | 1,688 | 1,703 | 1,780 | 1,806 | 1,943 | ||||||
Fine Gael | Jim O'Sullivan | 9.4% | 1,440 | 1,577 | 1,610 | 1,621 | 1,641 | 1,889 | 1,890 | 1,973 | |||
Labour | Michael Calnan * | 9.1% | 1,387 | 1,411 | 1,443 | 1,549 | 1,592 | 1,636 | 1,638 | 1,651 | 1,655 | 1,982 | |
Fianna Fáil | Tom O'Neill* | 8% | 1,231 | 1,247 | 1,272 | 1,360 | 1,378 | 1,440 | 1,446 | 1,480 | 1,492 | 1,682 | |
Fine Gael | Tadhg O'Donovan | 7.7% | 1,179 | 1,227 | 1,240 | 1,260 | 1,379 | 1,485 | 1,496 | 1,506 | 1,512 | 1,991 | |
Fine Gael | Michael Collins | 6.9% | 1,058 | 1,123 | 1,131 | 1,250 | 1,268 | 1,308 | 1,308 | 1,312 | 1,313 | ||
Progressive Democrats | Ray O'Neill | 5.9% | 901 | 952 | 977 | 1,013 | 1,067 | ||||||
Green | Mary O'Donnell | 5.4% | 828 | 845 | 917 | 959 | 1,119 | 1,302 | 1,311 | 1,344 | 1,358 | 1,424 | |
Independent | John Collins | 3.6% | 544 | 549 | 618 | 636 | |||||||
Independent | Donal Lehane | 3.2% | 497 | 508 | 522 | ||||||||
Sinn Féin | Donnchadh O Sé | 1.9% | 294 | 301 | |||||||||
Sinn Féin | Seamus de Burca | 0.9% | 144 | 145 | |||||||||
Electorate: 22,677 Valid: 15,305 (67.5%) Spoilt: 120 Quota: 1,914 Turnout: 15,425 (68%) |
Party | Candidate | FPv% | Count | |||||
---|---|---|---|---|---|---|---|---|
1 | 2 | 3 | 4 | 5 | ||||
Fine Gael | P.J. Sheehan TD* | 19.4% | 1,840 | |||||
Fianna Fáil | Senator Denis O'Donovan * | 19.2% | 1,827 | |||||
Independent | Michael Pat Murphy * | 14.3% | 1,360 | 1,452 | 1,502 | 1,637 | ||
Fine Gael | Michael Harrington* | 13.2% | 1,256 | 1,298 | 1,305 | 1,369 | 1,842 | |
Fianna Fáil | Vivian O'Callaghan * | 10.8% | 1,022 | 1,036 | 1,131 | 1,245 | 1,518 | |
Fine Gael | John P. O'Shea | 9% | 853 | 935 | 965 | 1,151 | 1,177 | |
Fianna Fáil | Dan Harrington | 8.5% | 812 | 817 | 851 | 890 | ||
Labour | Matt Kingston | 6% | 575 | 589 | 609 | |||
Electorate: 13,584 Valid: 9,505 (70%) Spoilt: 86 Quota: 1,591 Turnout: 9,591 (70.6%) |
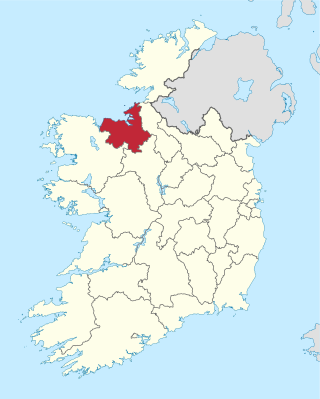
An election to Sligo County Council took place on 27 June 1991 as part of that year's Irish local elections. 25 councillors were elected from five local electoral areas (LEAs) for a five-year term of office on the electoral system of proportional representation by means of the single transferable vote (PR-STV). This term was extended twice, first to 1998, then to 1999.
An election to Roscommon County Council took place on 27 June 1991 as part of that year's Irish local elections. 26 councillors were elected from six local electoral areas (LEAs) for a five-year term of office on the electoral system of proportional representation by means of the single transferable vote (PR-STV). This term was extended twice, first to 1998, then to 1999.
An election to Galway County Council took place on 27 June 1991 as part of that year's Irish local elections. 30 councillors were elected from five local electoral areas (LEAs) for a five-year term of office on the electoral system of proportional representation by means of the single transferable vote (PR-STV). This term was extended twice, first to 1998, then to 1999.
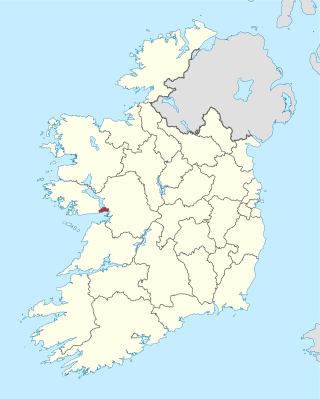
An election to Monaghan County Council took place on 27 June 1991 as part of that year's Irish local elections. 20 councillors were elected from four local electoral areas (LEAs) for a five-year term of office on the electoral system of proportional representation by means of the single transferable vote (PR-STV). This term was extended twice, first to 1998, then to 1999.
An election to Clare County Council took place on 10 June 1999 as part of that year's Irish local elections. 32 councillors were elected from six local electoral areas (LEAs) for a five-year term of office on the electoral system of proportional representation by means of the single transferable vote (PR-STV). This term was extended twice, first to 1998, then to 1999.
An election to Limerick County Council took place on 27 June 1991 as part of that year's Irish local elections. 28 councillors were elected from five local electoral areas (LEAs) for a five-year term of office on the electoral system of proportional representation by means of the single transferable vote (PR-STV). This term was extended twice, first to 1998, then to 1999.
An election to Limerick City Council took place on 27 June 1991 as part of that year's Irish local elections. 17 councillors were elected from four local electoral areas (LEAs) for a five-year term of office on the electoral system of proportional representation by means of the single transferable vote (PR-STV). This term was extended twice, first to 1998, then to 1999.
An election to Offaly County Council took place on 27 June 1991 as part of that year's Irish local elections. 21 councillors were elected from five local electoral areas (LEAs) for a five-year term of office on the electoral system of proportional representation by means of the single transferable vote (PR-STV). This term was extended twice, first to 1998, then to 1999.
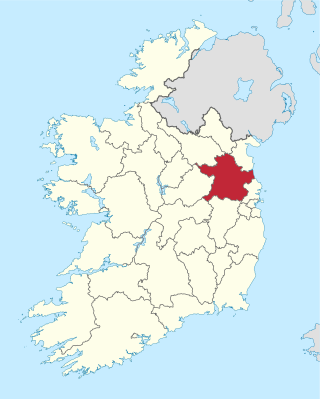
An election to Laois County Council took place on 27 June 1991 as part of that year's Irish local elections. 25 councillors were elected from five local electoral areas (LEAs) for a five-year term of office on the electoral system of proportional representation by means of the single transferable vote (PR-STV). This term was extended twice, first to 1998, then to 1999.
An election to Longford County Council took place on 27 June 1991 as part of that year's Irish local elections. 21 councillors were elected from four local electoral areas (LEAs) for a five-year term of office on the electoral system of proportional representation by means of the single transferable vote (PR-STV). This term was extended twice, first to 1998, then to 1999.
An election to Meath County Council took place on 27 June 1991 as part of that year's Irish local elections. 29 councillors were elected from five local electoral areas (LEAs) for a five-year term of office on the electoral system of proportional representation by means of the single transferable vote (PR-STV). This term was extended twice, first to 1998, then to 1999.
An election to Louth County Council took place on 27 June 1991 as part of that year's Irish local elections. 26 councillors were elected from five local electoral areas (LEAs) for a five-year term of office on the electoral system of proportional representation by means of the single transferable vote (PR-STV). This term was extended twice, first to 1998, then to 1999.
An election to Kildare County Council took place on 27 June 1991 as part of that year's Irish local elections. 25 councillors were elected from six local electoral areas (LEAs) for a five-year term of office on the electoral system of proportional representation by means of the single transferable vote (PR-STV). This term was extended twice, first to 1998, then to 1999.
An election to Wexford County Council took place on 27 June 1991 as part of that year's Irish local elections. 21 councillors were elected from four local electoral areas (LEAs) for a five-year term of office on the electoral system of proportional representation by means of the single transferable vote (PR-STV). This term was extended twice, first to 1998, then to 1999.
An election to Kilkenny County Council took place on 27 June 1991 as part of that year's Irish local elections. 26 councillors were elected from five local electoral areas (LEAs) for a five-year term of office on the electoral system of proportional representation by means of the single transferable vote (PR-STV). This term was extended twice, first to 1998, then to 1999.
An election to North Tipperary County Council took place on 27 June 1991 as part of that year's Irish local elections. 21 councillors were elected from four local electoral areas (LEAs) for a five-year term of office on the electoral system of proportional representation by means of the single transferable vote (PR-STV). This term was extended twice, first to 1998, then to 1999.
An election to Dublin County Council in the electoral county of Dún Laoghaire–Rathdown within Dublin County took place on 27 June 1991 as part of that year's Irish local elections. 28 councillors were elected from 7 local electoral areas on the system of proportional representation by means of the single transferable vote for a five-year term of office. It was one of three electoral counties within Dublin County at this election, the others being Fingal and South Dublin.
An election to the council of the electoral county of South Dublin within Dublin County to Dublin County Council took place on 27 June 1991 as part of that year's Irish local elections. 26 councillors were elected for a five-year term of office from five local electoral areas on the system of proportional representation by means of the single transferable vote. It was one of three electoral counties within Dublin County at this election, the others being Fingal and Dún Laoghaire–Rathdown. The term was extended twice, first to 1998, then to 1999.
An election to the electoral county of Fingal within Dublin County to Dublin County Council took place on 27 June 1991 as part of that year's Irish local elections. 24 councillors were elected for a five-year term of office from six local electoral areas (LEAs) on the system of proportional representation by means of the single transferable vote (PR-STV). It was one of three electoral counties within Dublin County at this election, the others being Dún Laoghaire–Rathdown and South Dublin. The term was extended twice, first to 1998, then to 1999.
An election to Dublin County Council took place on 27 June 1991 as part of that year's Irish local elections. Councillors were elected for a five-year term of office from local electoral areas (LEAs) on the system of proportional representation by means of the single transferable vote (PR-STV). It was the last election held for Dublin County Council.