| |||||||||||||||||||||||||||||||||
All 31 seats on Cork City Council | |||||||||||||||||||||||||||||||||
---|---|---|---|---|---|---|---|---|---|---|---|---|---|---|---|---|---|---|---|---|---|---|---|---|---|---|---|---|---|---|---|---|---|
| |||||||||||||||||||||||||||||||||
Map showing the area of Cork City Council |
An election to Cork City Council took place on 20 June 1985 as part of that year's Irish local elections. 31 councillors were elected from six local electoral areas (LEAs) for a five-year term of office on the electoral system of proportional representation by means of the single transferable vote (PR-STV). This term was extended for a further year, to 1991. [1]
Party | Seats | ± | First Pref. votes | FPv% | ±% | |
---|---|---|---|---|---|---|
Fianna Fáil | 13 | 0 | 17,399 | 41.16 | ||
Fine Gael | 8 | 0 | 11,376 | 26.91 | ||
Labour | 5 | 0 | 4,478 | 10.59 | ||
Workers' Party | 2 | 0 | 2,394 | 5.66 | ||
Independent | 3 | 0 | 4,545 | 10.75 | ||
Totals | 31 | 0 | 42,271 | 100.00 | — |
Party | Candidate | FPv% | Count | ||||||||||||
---|---|---|---|---|---|---|---|---|---|---|---|---|---|---|---|
1 | 2 | 3 | 4 | 5 | 6 | 7 | 8 | 9 | 10 | 11 | 12 | ||||
Fine Gael | Bernard Allen TD* | 1,540 | |||||||||||||
Independent | Bernie Murphy | 757 | 779 | 792 | 811 | 823 | 848 | 910 | 927 | 1,042 | 1,089 | 1,242 | |||
Fianna Fáil | Paud Black* | 697 | 728 | 731 | 741 | 746 | 762 | 781 | 873 | 893 | 919 | 975 | 985 | ||
Fianna Fáil | David Buckley* | 688 | 715 | 719 | 731 | 739 | 748 | 764 | 847 | 868 | 902 | 938 | 946 | ||
Fianna Fáil | Peter Falvey | 580 | 599 | 600 | 605 | 612 | 623 | 639 | 739 | 766 | 793 | 853 | 866 | ||
Labour | Joe O'Callaghan | 483 | 513 | 519 | 538 | 549 | 648 | 663 | 676 | 739 | 856 | 992 | 1,012 | ||
Independent | Jerry O'Riordan | 415 | 429 | 433 | 458 | 465 | 500 | 539 | 554 | 608 | 648 | ||||
Workers' Party | Harry Carroll | 337 | 352 | 360 | 364 | 367 | 378 | 427 | 438 | ||||||
Fianna Fáil | John Coleman | 334 | 340 | 340 | 345 | 346 | 438 | 351 | 357 | ||||||
Sinn Féin | Don O'Leary | 262 | 268 | 278 | 287 | 289 | 291 | ||||||||
Labour | Bertie McSweeney | 212 | 213 | 225 | 228 | 243 | |||||||||
Fine Gael | Charles Browne | 171 | 346 | 349 | 365 | 462 | 474 | 485 | 493 | 519 | |||||
Fine Gael | Richard J. Long | 140 | 178 | 178 | 180 | ||||||||||
Independent | Desmond Walls | 126 | 135 | 139 | |||||||||||
Communist | John N. Murphy | 58 | 61 | ||||||||||||
Electorate: 15,131 Valid: 6,800 (45.81%) Spoilt: 131 Quota: 1,134 Turnout: 6,931 |
Party | Candidate | FPv% | Count | ||||||||||
---|---|---|---|---|---|---|---|---|---|---|---|---|---|
1 | 2 | 3 | 4 | 5 | 6 | 7 | 8 | 9 | 10 | ||||
Fianna Fáil | Mairin Quill * | 1,063 | |||||||||||
Fine Gael | Bill Nolan* | 638 | 642 | 650 | 734 | 743 | 754 | 784 | 792 | 1,209 | |||
Workers' Party | John Kelleher | 609 | 610 | 624 | 634 | 710 | 752 | 785 | 798 | 862 | 888 | ||
Fianna Fáil | Tim Brosnan | 586 | 599 | 623 | 634 | 647 | 734 | 1,087 | |||||
Independent | Denis A. Tobin | 559 | 561 | 583 | 593 | 653 | 697 | 753 | 772 | 826 | 853 | ||
Labour | Frank Nash | 553 | 555 | 677 | 693 | 721 | 744 | 780 | 791 | 873 | 998 | ||
Fine Gael | Tadhg McAuliffe | 464 | 465 | 478 | 626 | 633 | 673 | 722 | 737 | ||||
Fianna Fáil | Pat McRory | 445 | 453 | 460 | 465 | 482 | 632 | ||||||
Fianna Fáil | Noel O'Flynn | 385 | 394 | 400 | 404 | 425 | |||||||
Sinn Féin | Anthony Dempsey | 298 | 298 | 303 | 307 | ||||||||
Fine Gael | Mairin Daly | 277 | 278 | 294 | |||||||||
Labour | Sheila Abbott | 138 | 139 | ||||||||||
Labour | George McDonnell | 109 | |||||||||||
Electorate: 12,666 Valid: 6,124 (48.97%) Spoilt: 164 Quota: 1,021 Turnout: 6,202 |
Party | Candidate | FPv% | Count | |||||||
---|---|---|---|---|---|---|---|---|---|---|
1 | 2 | 3 | 4 | 5 | 6 | 7 | ||||
Fianna Fáil | Dan Wallace TD* | 1,888 | ||||||||
Fine Gael | Liam Burke TD* | 1,007 | 1,077 | 1,142 | ||||||
Labour | Gerry O'Sullivan * | 775 | 828 | 857 | 1,006 | 1,066 | 1,102 | 1,108 | ||
Workers' Party | Jimmy Homan | 690 | 732 | 775 | 805 | 909 | 939 | 941 | ||
Fianna Fáil | Tim Falvey | 574 | 781 | 800 | 817 | 862 | 1,229 | |||
Fianna Fáil | Dave McCarthy | 521 | 705 | 714 | 727 | 784 | 1,007 | 1,091 | ||
Fianna Fáil | Martin A. Harvey | 514 | 658 | 667 | 694 | 730 | ||||
Sinn Féin | Sean Walsh | 347 | 366 | 382 | 392 | |||||
Fine Gael | Con Fitzpatrick | 277 | 280 | 333 | ||||||
Fine Gael | Sheila McGarry | 159 | 185 | |||||||
Communist | Bill McGarry | 69 | 72 | |||||||
Electorate: 14,358 Valid: 6,821 (48.22%) Spoilt: 102 Quota: 1,137 Turnout: 6,923 |
Party | Candidate | FPv% | Count | |||||||||||||||
---|---|---|---|---|---|---|---|---|---|---|---|---|---|---|---|---|---|---|
1 | 2 | 3 | 4 | 5 | 6 | 7 | 8 | 9 | 10 | 11 | 12 | 13 | 14 | 15 | ||||
Fianna Fáil | Pearse Wyse TD | 1,295 | ||||||||||||||||
Fine Gael | Denis Cregan * | 809 | 818 | 823 | 828 | 915 | 924 | 926 | 983 | 993 | 1,064 | 1,119 | 1,121 | 1,191 | ||||
Fianna Fáil | Micheál Martin | 788 | 815 | 818 | 824 | 829 | 840 | 907 | 933 | 1,069 | 1,102 | 1,167 | ||||||
Sinn Féin | Peadar Beecher | 465 | 467 | 472 | 495 | 497 | 507 | 510 | 512 | 518 | 522 | 572 | 572 | |||||
Labour | John Murray | 464 | 469 | 475 | 479 | 482 | 493 | 500 | 503 | 506 | 676 | 737 | 740 | 809 | 988 | 1,000 | ||
Workers' Party | Kathleen Lynch | 412 | 415 | 422 | 434 | 437 | 460 | 469 | 475 | 480 | 515 | 574 | 578 | 748 | 804 | 822 | ||
Fianna Fáil | Michael Finn | 406 | 440 | 440 | 447 | 451 | 458 | 492 | 499 | 584 | 597 | 643 | 664 | 731 | 787 | 804 | ||
Fine Gael | Dan Morrissey* | 396 | 402 | 403 | 409 | 429 | 435 | 443 | 523 | 533 | 587 | 621 | 623 | 638 | ||||
Labour | Pat Dawson* | 365 | 369 | 372 | 380 | 392 | 409 | 418 | 432 | 442 | ||||||||
Independent | Fred Penney | 305 | 312 | 324 | 358 | 362 | 420 | 424 | 434 | 443 | 464 | |||||||
Fianna Fáil | Sean O'Reilly* | 191 | 226 | 231 | 239 | 243 | 246 | 303 | 307 | |||||||||
Fianna Fáil | Christopher O'Connor | 183 | 203 | 206 | 211 | 212 | 219 | |||||||||||
Fine Gael | Sarah Madden | 182 | 183 | 185 | 189 | 212 | 224 | 226 | ||||||||||
Fine Gael | John Cahill* | 176 | 177 | 177 | 179 | |||||||||||||
Green | Patrick Cotter | 162 | 163 | 173 | 187 | 190 | ||||||||||||
Fianna Fáil | Finbarr O'Connor | 137 | 140 | 147 | ||||||||||||||
Independent | Pat O'Connor | 70 | 72 | |||||||||||||||
Electorate: 14,329 Valid: 6,806 (48.49%) Spoilt: 142 Quota: 1,135 Turnout: 6,948 |
Party | Candidate | FPv% | Count | ||||||||||
---|---|---|---|---|---|---|---|---|---|---|---|---|---|
1 | 2 | 3 | 4 | 5 | 6 | 7 | 8 | 9 | 10 | ||||
Fine Gael | Jim Corr * | 1,673 | |||||||||||
Independent | Sean Beausang* | 1,241 | |||||||||||
Fianna Fáil | Chrissie Aherne* | 999 | 1,017 | 1,080 | 1,098 | 1,105 | 1,124 | 1,183 | 1,350 | ||||
Fianna Fáil | Donal Counihan* | 854 | 878 | 912 | 918 | 921 | 936 | 956 | 1,115 | 1,193 | 1,237 | ||
Fine Gael | Ted McCarthy | 665 | 785 | 793 | 876 | 881 | 905 | 923 | 949 | 1,079 | 1,084 | ||
Fianna Fáil | Chris Coughlan | 622 | 649 | 675 | 680 | 684 | 690 | 710 | 818 | 864 | 941 | ||
Fine Gael | John Blair | 551 | 733 | 741 | 826 | 831 | 855 | 872 | 889 | 1,011 | 1,016 | ||
Fianna Fáil | Michael Lombard* | 492 | 501 | 531 | 532 | 534 | 571 | 597 | |||||
Workers' Party | Sean McCarthy | 346 | 352 | 353 | 357 | 361 | 390 | ||||||
Labour | Tom O'Sullivan | 310 | 323 | 330 | 340 | 343 | 511 | 617 | 654 | ||||
Labour | Frank Kerrigan | 307 | 320 | 323 | 339 | 342 | |||||||
Fine Gael | Philip Travers | 191 | 241 | 241 | |||||||||
Fianna Fáil | Ann Hynes | 181 | 187 | ||||||||||
Electorate: 19,081 Valid: 8,432 (44.79%) Spoilt: 114 Quota: 1,212 Turnout: 8,546 |
Party | Candidate | FPv% | Count | |||||||||||
---|---|---|---|---|---|---|---|---|---|---|---|---|---|---|
1 | 2 | 3 | 4 | 5 | 6 | 7 | 8 | 9 | 10 | 11 | ||||
Fianna Fáil | John Dennehy * | 1,448 | ||||||||||||
Fine Gael | Brian Bermingham * | 892 | 901 | 909 | 914 | 918 | 963 | 994 | 1,307 | |||||
Independent | Patrick Murray | 689 | 830 | 860 | 934 | 957 | 992 | 1,221 | 1,328 | |||||
Fianna Fáil | Owen Curtin* | 658 | 741 | 748 | 757 | 776 | 804 | 1,070 | 1,095 | 1,098 | 1,537 | |||
Labour | Toddy O'Sullivan TD* | 655 | 681 | 719 | 737 | 777 | 837 | 860 | 938 | 947 | 1,020 | 1,047 | ||
Fine Gael | Niall Hartnett | 631 | 636 | 648 | 649 | 650 | 678 | 708 | 834 | 910 | 959 | 999 | ||
Fianna Fáil | Jarlath Killilea | 568 | 613 | 617 | 623 | 653 | 666 | 751 | 767 | 768 | ||||
Fine Gael | Harry Anthony | 537 | 545 | 549 | 557 | 560 | 589 | 595 | ||||||
Fianna Fáil | Phil Cummins | 439 | 477 | 481 | 490 | 506 | 518 | |||||||
Green | Sean Dunne | 331 | 335 | 348 | 362 | 403 | ||||||||
Sinn Féin | James McBarron | 214 | 217 | 221 | 239 | |||||||||
Independent | Finbarr O'Connor | 119 | 122 | 126 | ||||||||||
Labour | Noel Dempsey | 107 | 108 | |||||||||||
Electorate: 15,555 Valid: 7,288 (47.45%) Spoilt: 93 Quota: 1,215 Turnout: 7,381 |
An election to Kerry County Council took place on 20 June 1985 as part of that year's Irish local elections. 27 councillors were elected from five local electoral areas (LEAs) for a five-year term of office on the electoral system of proportional representation by means of the single transferable vote (PR-STV). This term was extended for a further year, to 1991.
An election to Louth County Council took place on 20 June 1985 as part of that year's Irish local elections. 26 councillors were elected from six local electoral areas (LEAs) for a five-year term of office on the electoral system of proportional representation by means of the single transferable vote (PR-STV). This term was extended for a further year, to 1991.
An election to Monaghan County Council took place on 20 June 1985 as part of the Irish local elections. 20 councillors were elected from four local electoral areas (LEAs) for a five-year term of office on the electoral system of proportional representation by means of the single transferable vote (PR-STV). This term was extended for a further year, to 1991.
An election to all 29 seats on Donegal County Council took place on 20 June 1985 as part of the 1985 Irish local elections. County Donegal was divided into six local electoral areas (LEAs) to elect councillors for a five-year term of office on the electoral system of proportional representation by means of the single transferable vote (PR-STV). This term was extended for a further year, to 1991.
An election to Galway County Council took place on 20 June 1985 as part of that year's Irish local elections. 30 councillors were elected from five local electoral areas (LEAs) for a five-year term of office on the electoral system of proportional representation by means of the single transferable vote (PR-STV). This term was extended for a further year, to 1991.
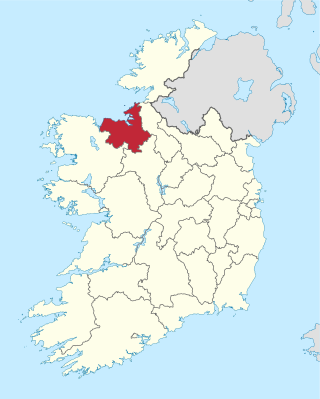
An election to Sligo County Council took place on 20 June 1985 as part of the Irish local elections. 25 councillors were elected from five local electoral areas (LEAs) for a five-year term of office on the electoral system of proportional representation by means of the single transferable vote (PR-STV). This term was extended for a further year, to 1991.
An election to Roscommon County Council took place on 20 June 1985 as part of the Irish local elections. 26 councillors were elected from six local electoral areas (LEAs) for a five-year term of office on the electoral system of proportional representation by means of the single transferable vote (PR-STV). This term was extended for a further year, to 1991.
An election to Limerick City Council took place on 20 June 1985 as part of the Irish local elections. 17 councillors were elected from four local electoral areas (LEAs) for a five-year term of office on the electoral system of proportional representation by means of the single transferable vote (PR-STV). This term was extended for a further year, to 1991.
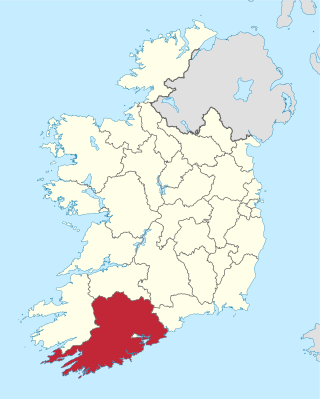
An election to Cork County Council took place on 20 June 1985 as part of that year's Irish local elections. 48 councillors were elected from eight local electoral areas (LEAs) for a five-year term of office on the electoral system of proportional representation by means of the single transferable vote (PR-STV). This term was extended for a further year, to 1991.
An election to Waterford County Council took place on 20 June 1985 as part of the Irish local elections. 23 councillors were elected from four local electoral areas (LEAs) for a five-year term of office on the electoral system of proportional representation by means of the single transferable vote (PR-STV). This term was extended for a further year, to 1991.
An election to South Tipperary County Council took place on 20 June 1985 as part of the Irish local elections. 26 councillors were elected from five local electoral areas (LEAs) for a five-year term of office on the electoral system of proportional representation by means of the single transferable vote (PR-STV). This term was extended for a further year, to 1991.
An election to North Tipperary County Council took place on 20 June 1985 as part of the Irish local elections. 21 councillors were elected from four local electoral areas (LEAs) for a five-year term of office on the electoral system of proportional representation by means of the single transferable vote (PR-STV). This term was extended for a further year, to 1991.
An election to Dublin City Council took place on 20 June 1985 as part of that year's Irish local elections. 52 councillors were elected from twelve local electoral areas (LEAs) for a five-year term of office on the electoral system of proportional representation by means of the single transferable vote (PR-STV). This term was extended for a further year, to 1991.
An election to Kildare County Council took place on 20 June 1985 as part of the 1985 Irish local elections. 25 councillors were elected from five local electoral areas (LEAs) for a five-year term of office on the electoral system of proportional representation by means of the single transferable vote (PR-STV). This term was extended for a further year, to 1991.
An election to Kilkenny County Council took place on 20 June 1985 as part of the 1985 Irish local elections. 26 councillors were elected from five local electoral areas (LEAs) for a five-year term of office on the electoral system of proportional representation by means of the single transferable vote (PR-STV). This term was extended for a further year, to 1991.
An election to all 21 seats on Carlow County Council took place on 20 June 1985 as part of that year's Irish local elections. Councillors were elected from four local electoral areas (LEAs) for a five-year term of office on the electoral system of proportional representation by means of the single transferable vote (PR-STV). This term was extended for a further year, to 1991.
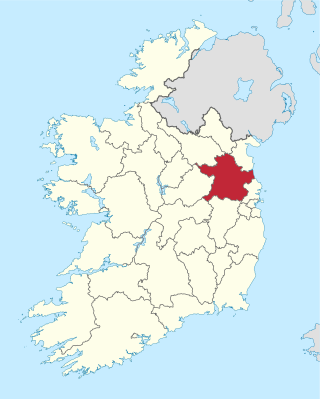
An election to Meath County Council took place on 20 June 1985 as part of the Irish local elections. 29 councillors were elected from five local electoral areas (LEAs) for a five-year term of office on the electoral system of proportional representation by means of the single transferable vote (PR-STV). This term was extended for a further year, to 1991.
An election to Offaly County Council took place on 20 June 1985 as part of the Irish local elections. 21 councillors were elected from four local electoral areas (LEAs) for a five-year term of office on the electoral system of proportional representation by means of the single transferable vote (PR-STV). This term was extended for a further year, to 1991.
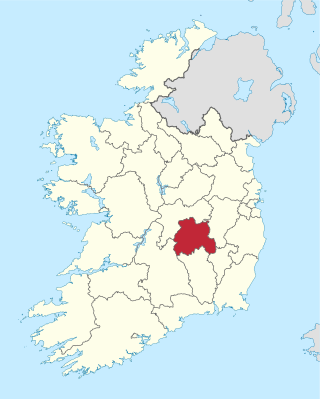
An election to Laois County Council took place on 20 June 1985 as part of the 1985 Irish local election. 25 councillors were elected from five local electoral areas (LEAs) for a five-year term of office on the electoral system of proportional representation by means of the single transferable vote (PR-STV). This term was extended for a further year, to 1991.
An election to Westmeath County Council took place on 20 June 1985 as part of the Irish local elections. 23 councillors were elected from five local electoral areas (LEAs) for a five-year term of office on the electoral system of proportional representation by means of the single transferable vote (PR-STV). This term was extended for a further year, to 1991.