
Elections in Belgium are organised for legislative bodies only, and not for executive functions. Direct elections take place for the European Parliament, the Chamber of Representatives, the Parliaments of the Regions, the Parliaments of the Communities, the provincial councils, the municipal councils and the councils of Districts of Antwerp. Voting is mandatory in federal elections, and all elections use proportional representation which in general requires coalition governments.

Malta elects on a national level 6 MEPs representing Malta in the European Parliament, on a district level the legislature, on a local level the local councils, and on a community level the Administrative Committees.
The Isle of Man partially elects its legislature at the national level. The High Court of Tynwald consists of two chambers. The House of Keys has 24 members, elected in a general election for a five-year term in 12 two-seat constituencies. Each voter has two votes and in each constituency the two candidates with the most votes are elected. The Legislative Council has 11 members: three ex-officio members and eight other members who are elected by the House of Keys for a five-year term. Political parties do not play an important role on the Island. The Isle of Man lowered its voting age from 18 to 16 in 2006.

Elections in Namibia determine who holds public political offices in the country. Namibia is a semi-presidential representative democratic republic. It runs direct elections every five years for the position of the president and seats in the National Assembly, and every six years for the Regional Councils and the distribution of seats in local authorities. The National Council is elected indirectly by the constituency councillors of Namibia's 14 regions.
Scotland has elections to several bodies: the Scottish Parliament, the United Kingdom Parliament, local councils and community councils. Before the United Kingdom left the European Union, Scotland elected members to the European Parliament.
This article lists the British National Party's election results in the UK parliamentary, Scottish parliamentary and Welsh Assembly elections, as well as in the European Parliament elections and at a local level.

The 2011 United Kingdom local elections were held on Thursday, 5 May. In England, direct elections were held in all 36 metropolitan boroughs, 194 second-tier district authorities, 49 unitary authorities and various mayoral posts, meaning local elections took place within all parts of England with the exceptions of seven unitary authorities, and seven districts and boroughs. For the majority of English districts and the 25 unitary authorities who were "all-up" for election at the end of their four-year terms, these were the first elections since 2007. In Northern Ireland, there were elections to all 26 local councils. Elections also took place to elect members of most English parish councils.

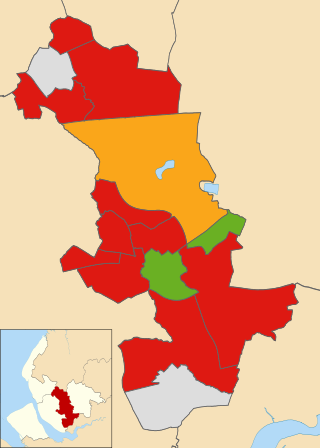
The 2011 Plymouth City Council election took place on 5 May 2011 to elect members to Plymouth City Council in England. One third of the council was up for election, in addition to a by-election, making twenty seats in total. The previous election produced a majority for the Conservative Party. The election resulted in Labour gaining 5 seats with Conservatives retaining control.

The 2012 Plymouth City Council election took place on 3 May 2012 to elect members of Plymouth City Council in England. This was on the same day as other local elections. The election was won by the Labour Party, who gained control of the council from the Conservative Party.

The 2014 United Kingdom local elections were held on 22 May 2014. Usually these elections are held on the first Thursday in May but were postponed to coincide with the 2014 European Parliament Elections. Direct elections were held for all 32 London boroughs, all 36 metropolitan boroughs, 74 district/borough councils, 19 unitary authorities and various mayoral posts in England and elections to the new councils in Northern Ireland.

An election to Dublin City Council took place on 5 June 2009 as part of that year's Irish local elections. 52 councillors were elected from eleven local electoral areas (LEAs) for a five-year term of office on the electoral system of proportional representation by means of the single transferable vote (PR-STV).

The 2021 United Kingdom local elections were held on Thursday 6 May 2021. More than 145 English local councils, around 5,000 councillor seats, thirteen directly elected mayors in England, and 39 police and crime commissioners in England and Wales were contested. On the same day, the 2021 Hartlepool by-election took place, and there were also elections to the Scottish Parliament, Senedd and London Assembly, the last in conjunction with the London mayoral election.

The 2022 United Kingdom local elections took place on Thursday 5 May 2022. These included elections for all London borough councils, and for all local authorities in Wales and Scotland. Most seats in England were last up for election in 2018 and in Scotland and Wales in 2017. The elections coincided with the 2022 Northern Ireland Assembly election. In 91 cases, most of them in Wales, council seats were uncontested, each having only one candidate. Three seats in Scotland remained unfilled as no one nominated to fill them.

The 2022 Welsh local elections took place on 5 May 2022 to elect members of all twenty-two local authorities in Wales. They were held alongside other local elections in the United Kingdom. The previous elections were held in 2017.

The 2022 City of Bradford Metropolitan District Council election took place on 5 May 2022 to elect one third of councillors to the City of Bradford Metropolitan District Council. The election took place at the same time as other local elections across the United Kingdom.

The 2022 Coventry City Council election took place on 5 May 2022. One third of councillors — 18 out of 54 — on Coventry City Council were elected. The election took place alongside other local elections across the United Kingdom.

The 2022 Kirklees Metropolitan Borough Council election took place on 5 May 2022. One third of councillors—23 out of 69—on Kirklees Metropolitan Borough Council were elected. The election took place alongside other local elections across the United Kingdom.
The 2022 Knowsley Metropolitan Borough Council election took place on 5 May 2022. One third of councillors — 15 out of 45 — on Knowsley Metropolitan Borough Council were elected. The election took place alongside other local elections across the United Kingdom.

The 2022 North Tyneside Metropolitan Borough Council election took place on 5 May 2022. One third of councillors—20 out of 60—on North Tyneside Metropolitan Borough Council were elected. The election took place alongside other local elections across the United Kingdom.

The 2022 Oldham Metropolitan Borough Council election took place on 5 May 2022. One third—20 out of 60—of councillors on Oldham Council was elected. The election took place alongside other local elections across the United Kingdom.
