1985 Dublin City Council election

Last updated

1985 Dublin City Council election
Flag of Ireland.svg
  1979 20 June 1985 1991  

All 52 seats to Dublin City Council
 First partySecond partyThird party
 
Party Fianna Fáil Fine Gael Workers' Party
Seats won26136
Seat change00

 Fourth partyFifth partySixth party
 
Party Labour Sinn Féin Independent
Seats won214
Seat change-

Dublin City in Ireland.svg
Map showing the area of Dublin City Council

Council control after election

Fianna Fáil
Workers' Party

An election to Dublin City Council took place on 20 June 1985 as part of that year's Irish local elections. 52 councillors were elected from twelve electoral divisions by PR-STV voting for a six-year term of office.

Contents

Results by party

PartySeats±First Pref. votesFPv%±%
Fianna Fáil 2669,09241.82
Fine Gael 1333,07920.02
Workers' Party 615,4799.37
Labour 214,8258.97
Sinn Féin 17,8014.72
Green 02,7471.66
Democratic Socialist 01,7821.08
Communist Party 03880.23
Independent 420,01312.11
Totals52-165,206100.00

Results by local electoral area

Artane

Artane - 4 seats [1]
PartyCandidateFPv%Count
12345678910111213
Fianna Fáil Seán Haughey 3,956            
Labour Michael O'Halloran *1,8031,856 1,859 1,875 1,885 1,949 1,977 2,322 2,436 2,635 2,738  
Workers' Party Pat McCartan 1,3991,439 1,448 1,455 1,474 1,477 1,507 1,530 1,717 1,840 2,138 2,167 2,406
Fianna Fáil Joan Jones1,1161,534 1,535 1,545 1,552 1,561 1,570 1,598 1,662 1,750 1,898 1,903 2,009
Sinn Féin Terry Hughes890928 929 929 940 943 950 957 1,020 1,060    
Fianna Fáil Ita Green*8061,442 1,447 1,450 1,453 1,462 1,490 1,551 1,607 1,782 1,915 1,920 2,146
Fine Gael Richard Bruton TD784807 813 831 834 946 978 1,039 1,088 1,282 1,298 1,312  
Independent Hannah Barlow Community*674698 708 709 721 724 861 921 983     
Labour Paddy Bourke 575590 592 595 599 606 616       
Democratic Socialist Philip O'Connor566597 603 607 613 614 634 643      
Independent William Austin McCoy Community279285 297 297 322 326        
Fine Gael Noel Rice192196 196 223 223         
Independent Fergal Thomas Goulding100103 107 108         
Fine Gael Bill Mynes8791 91           
Green Alliance Nora Keane5861            
Electorate: 25,974  Valid: 13,285 (51.76%)  Spoilt: 160  Quota: 2,658  Turnout: 13,445  

    Ballyfermot

    Ballyfermot - 4 seats [1]
    PartyCandidateFPv%Count
    12345678910111213
    Workers' Party Tomás MacGiolla TD*1,6701,675 1,706 1,737 1,774 2,224 2,318 2,522     
    Fianna Fáil Olga Bennett 1,2361,238 1,239 1,269 1,324 1,330 1,426 1,452 1,729 1,844 1,848 1,929 2,420
    Fianna Fáil Pat McEntee*1,1251,128 1,141 1,154 1,174 1,181 1,197 1,237 1,388 1,522 1,530 1,568  
    Fianna Fáil Michael Delaney1,0981,099 1,106 1,111 1,132 1,136 1,149 1,174 1,427 1,554 1,560 1,579 2,257
    Fine Gael Charlie McManus*1,0601,060 1,066 1,086 1,114 1,121 1,144 1,241 1,267 1,319 1,335 2,202 2,286
    Sinn Féin Jimmy Delaney1,0191,021 1,041 1,056 1,069 1,080 1,095 1,125 1,171     
    Democratic Socialist Michael Conaghan 1,0121,019 1,027 1,063 1,140 1,149 1,244 1,291 1,333 1,522 1,535 1,622 1,660
    Fine Gael Greg Walsh944948 949 977 1,028 1,031 1,132 1,221 1,247 1,275 1,283   
    Fianna Fáil John Doran783784 785 796 810 819 848 871      
    Labour Paddy O'Mahony*496497 501 509 637 640 667       
    Workers' Party Gerard Lynch482488 497 507 529         
    Labour George Butler478481 488 506          
    Independent Brian Patrick McMenamy468482 484 539 562 571        
    Independent Mich O'Mahony282286 289           
    Communist Party John Montgomery118120            
    Green Alliance Jan Loughney61            
    Electorate: 28,903  Valid: 12,332 (43.52%)  Spoilt: 246  Quota: 2,467  Turnout: 12,578  

      Cabra

      Cabra- 3 seats [1]
      PartyCandidateFPv%Count
      1234567891011
      Fianna Fáil Patrick J. Farry2,1032,116 2,125 2,132 2,146 2,180 2,279 2,304 2,494 3,033 
      Fianna Fáil Dr. Dermot Fitzpatrick *1,6071,613 1,626 1,645 1,654 1,682 1,715 1,744 1,866 2,621 2,713
      Fianna Fáil Tom LeonardTD*1,3561,363 1,369 1,371 1,379 1,402 1,437 1,455 1,569   
      Fine Gael Dr. Tony Collis1,3471,363 1,382 1,398 1,473 1,507 1,594 2,519 2,607 2,671 2,674
      Independent Christy Sherwin*1,3461,370 1,415 1,439 1,528 1,659 2,021 2,056 2,525 2,654 2,659
      Sinn Féin Tony O'Flaherty1,0971,117 1,126 1,131 1,147 1,274 1,398 1,406    
      Fine Gael John Colgan898922 934 941 1,008 1,034 1,066     
      Independent Seán Coultry636675 695 710 743 843      
      Workers' Party Imelda Dixon452462 490 501 584       
      Labour Martin Giblin264270 289 438        
      Labour Jimmy Kelly235245 258         
      Green Alliance Brian Torode199204          
      Independent Michael Berney190          
      Electorate: 25,834  Valid: 11,730 (46.12%)  Spoilt: 184  Quota: 2,933  Turnout: 11,914  

        Clontarf

        Clontarf - 5 seats [1]
        PartyCandidateFPv%Count
        123456789
        Fianna Fáil Vincent Brady TD*4,676        
        Independent Seán D. Dublin Bay Rockall Loftus *3,200        
        Fine Gael Pat Lee 1,8701,907 1,942 1,972 2,007 2,114 2,235 2,799 2,803
        Fianna Fáil Eugene Timmons*1,7212,129 2,162 2,181 2,202 2,296 2,397 2,465 2,511
        Fine Gael Tom Farrell1,5801,610 1,639 1,664 1,695 1,805 1,918 2,553 2,566
        Fianna Fáil Joseph Burke1,4432,638 2,678 2,705 2,743 2,820 2,998  
        Fine Gael Cathy Fay1,0281,047 1,085 1,125 1,177 1,278 1,411   
        Workers' Party Triona Dooney803818 845 875 1,004 1,225    
        Labour Derek McDowell 583601 613 795 846     
        Labour Jo (Josephine) Walsh355363 374       
        Green Alliance William Hughes Cooke346357 397 409      
        Electorate: 39,304  Valid: 17,605 (45.47%)  Spoilt: 257  Quota: 2,935  Turnout: 17,862  

          Crumlin

          Crumlin- 4 seats [1]
          PartyCandidateFPv%Count
          12345678910
          Fine Gael Gay Mitchell TD*2,962         
          Fianna Fáil Ben Briscoe TD*2,5982,617 2,623 2,630 2,790     
          Workers' Party Eric Byrne 1,5361,547 1,574 1,623 1,644 1,647 1,736 2,026 2,214 2,384
          Fianna Fáil Andrew J. Callaghan1,4211,427 1,431 1,444 1,624 1,685 1,752 1,849 1,930 2,837
          Fianna Fáil Adele Ramsey1,0891,100 1,103 1,107 1,247 1,270 1,327 1,437 1,495  
          Labour Joe Connolly*1,0521,063 1,080 1,085 1,096 1,097 1,232 1,265 1,927 2,051
          Labour Michael Collins*818834 847 858 910 912 1,089 1,151   
          Sinn Féin Micheal Mac Conmara714717 726 762 770 770 774    
          Fianna Fáil Peter Meade583587 589 591       
          Fine Gael Colm Brangan474654 672 672 679 680     
          Communist Party Brian Joseph Buggle124125 134        
          Green Alliance Elma Holohan122123         
          Electorate: 31,494  Valid: 13,493 (43.59%)  Spoilt: 235  Quota: 2,699  Turnout: 13,728  

            Donaghmede

            Donaghmede - 5 seats [1]
            PartyCandidateFPv%Count
            12345678910111213
            Fianna Fáil Ned Brennan *3,513            
            Fianna Fáil Liam Fitzgerald TD*3,306            
            Fianna Fáil Ivor Callely 1,4011,841 2,096 2,113 2,120 2,137 2,149 2,191 2,889    
            Labour Seán Kenny *1,3171,346 1,382 1,390 1,395 1,400 1,436 1,476 1,518 1,533 2,163 2,509 2,741
            Fine Gael Maurice Manning TD1,0691,086 1,098 1,109 1,114 1,127 1,264 1,289 1,329 1,344 1,419 1,467 2,416
            Workers' Party Caitríona Ní Chuinneageáin1,0061,020 1,028 1,037 1,053 1,083 1,087 1,142 1,177 1,193 1,256   
            Independent Angela Mulligan9991,018 1,036 1,064 1,079 1,140 1,177 1,411 1,476 1,518 1,652 2,122 2,226
            Fine Gael Anto Kerins970982 994 997 1,001 1,012 1,252 1,279 1,300 1,310 1,375 1,408  
            Labour Tom Brennan*902937 968 970 974 981 1,022 1,124 1,162 1,181    
            Fianna Fáil Brian Monaghan762908 1,045 1,050 1,053 1,057 1,064 1,086      
            Fine Gael Margaret Hopkins512521 528 529 530 541        
            Independent John Meaney472481 493 504 535 585 602       
            Green Alliance Hilary McLoughlin193196 198 200 222         
            Independent Barry McGuirk106111 114 115          
            Independent Donal O hUadhaigh100103 104           
            Electorate: 35,378  Valid: 16,628 (47.55%)  Spoilt: 146  Quota: 2,772  Turnout: 16,824  

              Drumcondra

              Drumcondra - 5 seats [1]
              PartyCandidateFPv%Count
              123456789101112131415
              Fianna Fáil Noel Ahern 2,2822,282 2,285 2,292 2,297 2,308 2,314 2,329 2,403 2,490     
              Fianna Fáil Michael Barrett TD*2,2612,264 2,271 2,274 2,302 2,316 2,330 2,372 2,555      
              Fianna Fáil Tim Killeen1,4631,466 1,469 1,473 1,475 1,475 1,482 1,508 1,595 1,639 1,681 1,713 1,739 1,888 2,075
              Fine Gael Alice Glenn TD*1,4151,416 1,420 1,441 1,446 1,461 1,474 1,522 1,538 1,540 1,544 1,563 2,089 2,124 2,347
              Fine Gael Eddie Nolan1,0231,025 1,031 1,043 1,052 1,069 1,076 1,095 1,102 1,103 1,103 1,116 1,435 1,455 1,685
              Sinn Féin Ann O'Sullivan966968 972 974 982 996 1,040 1,055 1,068 1,070 1,070 1,100 1,104   
              Fine Gael Senator Luke Belton*937937 939 949 954 964 968 983 987 989 994 1,003    
              Workers' Party Eamonn O'Brien888889 912 915 938 962 1,026 1,047 1,092 1,096 1,097 1,770 1,780 2,117 2,370
              Workers' Party Philomena Donnelly741742 749 758 773 813 829 884 896 900 903     
              Labour Paddy Dunne*720720 769 857 869 893 920 993 1,009 1,013 1,015 1,083 1,157 1,242  
              Fianna Fáil Kathleen Farrell443444 449 451 455 455 475 490        
              Independent Mollie Bracken-Community311312 315 317 339 377 418         
              Green Alliance Carolyn Wilson235235 237 248 260           
              Independent Barney Hartnett232238 243 243 270 303          
              Independent Billy Keegan161186 187 189            
              Labour Paul McDonnell155155 180             
              Labour Ina Gould148149              
              Independent Lily Keegan47              
              Electorate: 36,402  Valid: 14,428 (40.15%)  Spoilt: 186  Quota: 2,405  Turnout: 14,614  

                Finglas

                Finglas - 4 seats [1]
                PartyCandidateFPv%Count
                1234567891011121314
                Fianna Fáil Jim Tunney TD*3,175             
                Workers' Party Proinsias De Rossa TD2,2662,329 2,365 2,421          
                Fianna Fáil Pat Carey 1,2181,487 1,500 1,515 1,515 1,532 1,569 1,588 1,616 1,700 1,749 1,841 1,931 2,132
                Fine Gael Mary Flaherty TD*1,0561,099 1,110 1,125 1,125 1,152 1,172 1,194 1,241 1,293 1,638 1,772 1,880 1,961
                Sinn Féin Harry Fleming798808 812 821 821 826 845 867 881 908 915 952 1,111  
                Fianna Fáil Celia Larkin 7241,024 1,040 1,047 1,047 1,070 1,079 1,099 1,120 1,171 1,184 1,227 1,298 1,459
                Workers' Party Pat Quearney522528 530 544 546 589 620 668 691 745 760 867   
                Fine Gael Frank Barr437444 455 460 460 479 487 500 527 547     
                Independent Frank Carroll315325 334 340 340 353 374 432 448      
                Labour Diana Robertson*298307 309 315 315 322 388 412 547 630 659    
                Labour Dr. Bill Tormey265279 282 294 294 314 350 372       
                Labour Shay Carbin250256 260 271 271 280         
                Green Alliance Aidan, Michael Meagher211215 219 249 249          
                Democratic Socialist Mary, E. McCamley204208 213            
                Independent Billy Keegan183190 235 251 252 295 309        
                Independent Gerard Doolan106109             
                Independent Frank Clarke5961             
                Electorate: 27,997  Valid: 12,087 (43.91%)  Spoilt: 206  Quota: 2,418  Turnout: 12,293  

                  North Inner City

                  North Inner City - 5 seats [1]
                  PartyCandidateFPv%Count
                  123456789101112
                  Fianna Fáil Bertie Ahern TD*4,316           
                  Independent Tony Gregory TD*3,766           
                  Fianna Fáil John Stafford 1,6331,994 2,146 2,152 2,199 2,206 2,226 2,251 2,302 2,634  
                  Fine Gael Michael Keating *1,4661,538 1,681 1,687 1,701 1,713 1,744 1,775 1,934 1,960 2,603 2,854
                  Sinn Féin Christy Burke 1,2221,268 1,491 1,524 1,538 1,553 1,559 1,664 1,709 1,725 1,739 2,129
                  Workers' Party Michael White820853 1,061 1,076 1,103 1,162 1,200 1,288 1,389 1,403 1,437  
                  Fine Gael Kevin Byrne642659 707 710 725 741 760 779 830 835   
                  Fianna Fáil Ernie Beggs4811,082 1,186 1,189 1,199 1,204 1,221 1,237 1,269 1,530 1,562 1,729
                  Labour William Cumiskey*341366 413 413 417 427 513 625     
                  Labour Joe Costello 290300 355 367 371 397 447      
                  Labour Don Buckley226240 270 274 279 298       
                  Fianna Fáil Tony Paul Kett 174673 716 716 718 724 732 740 765    
                  Green Alliance Vincent John Murphy149151 181 190 207        
                  Independent Brian Skerritt131138 178 187         
                  Communist Party Norman Cullen7375 86          
                  Independent Michael Joseph Ward1416 23          
                  Electorate: 35,046  Valid: 15,744 (45.55%)  Spoilt: 219  Quota: 2,625  Turnout: 15,963  

                    Pembroke

                    Pembroke - 4 seats [1]
                    PartyCandidateFPv%Count
                    1234567891011
                    Independent Carmencita Hederman-Community *2,4542,468 2,497 2,722       
                    Fine Gael Joe Doyle TD *2,2232,232 2,239 2,279 2,298 2,301 2,587 2,693   
                    Fianna Fáil Seán Moore *2,1392,150 2,160 2,181 2,459 2,461 2,476 2,621 3,331  
                    Fine Gael John McKenna879884 892 911 941 943 1,389 1,423 1,477 1,491 2,060
                    Fianna Fáil Ellen Gunning (Whelan)864873 877 893 1,003 1,005 1,019 1,166    
                    Fianna Fáil Eoin David Ryan 848848 856 869 1,122 1,124 1,165 1,211 1,460 1,951 2,172
                    Workers' Party Tom Crilly814835 861 937 951 958 969     
                    Fine Gael Cliona O'Tuama779782 796 840 867 872      
                    Fianna Fáil Ciaran J. O'Loughlin742744 746 764        
                    Labour Dermot Lacey 632633 930 995 1,009 1,020 1,060 1,333 1,402 1,441  
                    Green Alliance Enid O'Dowd558562 574         
                    Labour James Connolly Heron420421          
                    Independent William Coughlan87          
                    Electorate: 37,400  Valid: 13,439 (36.37%)  Spoilt: 165  Quota: 2,688  Turnout: 13,604  

                      Rathmines

                      Rathmines - 4 seats [1]
                      PartyCandidateFPv%Count
                      1234567891011
                      Fine Gael Senator Alexis FitzGerald *2,555          
                      Fianna Fáil Michael Donnelly 2,1332,144 2,153 2,193 2,220 2,382     
                      Fine Gael Michael McShane*1,0421,210 1,226 1,271 1,307 1,330 1,331 1,378 1,574 1,732 1,818
                      Fianna Fáil Mary Hanafin 890898 909 923 938 1,069 1,138 1,205 1,275 1,455 2,348
                      Fianna Fáil Gerry Kieran849852 857 873 882 1,079 1,118 1,139 1,168 1,246  
                      Fine Gael Edie Wynne811880 892 946 956 964 965 1,046 1,294 1,458 1,500
                      Workers' Party Anne Cooney674677 698 726 795 804 806 930 1,147   
                      Fianna Fáil Derek Mooney534537 542 546 553       
                      Labour Vicki Somers473482 508 527 770 778 779 909    
                      Green Maire Mullarney 430432 486 566 574 575 575     
                      Labour Brendan Byrne*393400 425 444        
                      Independent Barry John Community-Hardy308310 366         
                      Independent Tonie Walsh 167167          
                      Independent William Abbey Of The Holy Cross Fitzsimon6060          
                      Independent Gabriel Joseph McGovern2223          
                      Electorate: 34,320  Valid: 11,341 (33.53%)  Spoilt: 165  Quota: 2,269  Turnout: 11,506  

                        South Inner City

                        South Inner City - 5 seats [1]
                        PartyCandidateFPv%Count
                        1234567891011121314151617
                        Fianna Fáil Mary Mooney 1,9071,908 1,910 1,923 1,934 1,959 1,971 2,017 2,060 2,089 2,285      
                        Independent Brendan Lynch *1,5201,525 1,528 1,538 1,558 1,593 1,622 1,665 1,703 1,734 1,768 1,773 1,819 2,071 2,152 2,323 
                        Fine Gael Peter Burke*1,4181,420 1,421 1,424 1,436 1,452 1,460 1,484 1,520 1,972 1,984 1,986 1,999 2,047 2,082 2,357 
                        Sinn Féin John Crabbe1,0951,095 1,110 1,118 1,126 1,134 1,160 1,164 1,173 1,178 1,192 1,195 1,223 1,406 1,429 1,492 1,507
                        Fianna Fáil Michael Mulcahy 892893 894 900 902 903 913 937 944 954 1,126 1,169 1,180 1,205 1,929 1,990 2,025
                        Workers' Party Andy Smith781782 797 803 812 818 843 850 882 897 909 913 1,413 1,513 1,559 1,765 1,822
                        Fianna Fáil Des Smith745745 748 750 754 761 777 783 790 803 1,021 1,062 1,073 1,102    
                        Fianna Fáil Aindrias Ó Caoimh*680681 681 682 683 683 686 692 699 706        
                        Workers' Party Eddie Naughton625628 635 641 654 664 677 689 723 729 734 734      
                        Fine Gael Anne O'Regan619620 621 627 640 649 657 668 689         
                        Independent John Whacker Humphrey603608 611 649 676 728 777 783 802 809 818 821 869     
                        Labour Mary Freehill*602603 606 620 660 679 697 785 1,004 1,072 1,082 1,083 1,104 1,155 1,188   
                        Labour Tony Ryder386386 389 396 399 406 426 506          
                        Labour Jim Mooney348349 350 356 359 370 375           
                        Independent William Ormonde237238 241 248 256 266            
                        Independent Larry P. Dillon202202 204 214 230             
                        Green Alliance Thérése Cronin185185 196 197              
                        Independent Christy Doyle151151 151               
                        Communist Party Michael Wall7374                
                        Independent Desmond Hunter25                
                        Electorate: 34,715  Valid: 13,094 (38.57%)  Spoilt: 294  Quota: 2,183  Turnout: 13,388  

                          Related Research Articles

                          <span class="mw-page-title-main">1985 Kerry County Council election</span> Election in Ireland

                          An election to Kerry County Council took place on 20 June 1985 as part of that year's Irish local elections. 27 councillors were elected from five electoral divisions by PR-STV voting.

                          <span class="mw-page-title-main">1985 Louth County Council election</span>

                          An election to Louth County Council took place on 20 June 1985 as part of that year's Irish local elections. 26 councillors were elected from six electoral divisions by PR-STV voting for a five-year term of office.

                          <span class="mw-page-title-main">1985 Monaghan County Council election</span>

                          An election to Monaghan County Council took place on 20 June 1985 as part of that year's Irish local elections. 20 councillors were elected from four electoral divisions by PR-STV voting for a five-year term of office.

                          <span class="mw-page-title-main">1985 Donegal County Council election</span>

                          An election to Donegal County Council took place on 20 June 1985 as part of that year's Irish local elections. 29 councillors were elected from six electoral divisions by PR-STV voting for a five-year term of office.

                          <span class="mw-page-title-main">1985 Cork City Council election</span>

                          An election to Cork City Council took place on 20 June 1985 as part of that year's Irish local elections. 31 councillors were elected from six electoral divisions by PR-STV voting for a six-year term of office.

                          <span class="mw-page-title-main">1985 Roscommon County Council election</span>

                          An election to Roscommon County Council took place on 20 June 1985 as part of that year's Irish local elections. 26 councillors were elected from six electoral divisions by PR-STV voting for a six-year term of office.

                          <span class="mw-page-title-main">1985 Mayo County Council election</span>

                          An election to Mayo County Council took place on 20 June 1985 as part of that year's Irish local elections. 31 councillors were elected from seven electoral divisions by PR-STV voting for a five-year term of office.

                          <span class="mw-page-title-main">1985 Limerick City Council election</span>

                          An election to Limerick City Council took place on 20 June 1985 as part of that year's Irish local elections. 17 councillors were elected from four electoral divisions by PR-STV voting for a six-year term of office.

                          <span class="mw-page-title-main">1985 Cork County Council election</span> Election in Cork, Ireland

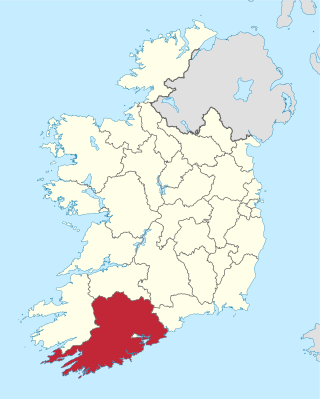
                          An election to Cork County Council took place on 20 June 1985 as part of that year's Irish local elections. 48 councillors were elected from eight electoral divisions by PR-STV voting for a six-year term of office.

                          <span class="mw-page-title-main">1985 Waterford City Council election</span>

                          An election to Waterford City Council took place on 20 June 1985 as part of that year's Irish local elections. 15 councillors were elected from three electoral divisions by PR-STV voting for a six-year term of office.

                          <span class="mw-page-title-main">1985 Waterford County Council election</span>

                          An election to Waterford County Council took place on 20 June 1985 as part of that year's Irish local elections. 23 councillors were elected from four electoral divisions by PR-STV voting for a six-year term of office.

                          <span class="mw-page-title-main">1985 South Tipperary County Council election</span>

                          An election to South Tipperary County Council took place on 20 June 1985 as part of that year's Irish local elections. 26 councillors were elected from five electoral divisions by PR-STV voting for a six-year term of office.

                          <span class="mw-page-title-main">1985 North Tipperary County Council election</span>

                          An election to North Tipperary County Council took place on 20 June 1985 as part of that year's Irish local elections. 21 councillors were elected from four electoral divisions by PR-STV voting for a six-year term of office.

                          <span class="mw-page-title-main">1985 Kilkenny County Council election</span>

                          An election to Kilkenny County Council took place on 20 June 1985 as part of that year's Irish local elections. 26 councillors were elected from five electoral divisions by PR-STV voting for a six-year term of office.

                          <span class="mw-page-title-main">1985 Carlow County Council election</span>

                          An election to Carlow County Council took place on 20 June 1985 as part of that year's Irish local elections. 21 councillors were elected from four electoral divisions by PR-STV voting for a six-year term of office.

                          <span class="mw-page-title-main">1985 Wicklow County Council election</span>

                          An election to Wicklow County Council took place on 20 June 1985 as part of that year's Irish local elections. 24 councillors were elected from five electoral divisions by PR-STV voting for a six year term of office.

                          <span class="mw-page-title-main">1985 Wexford County Council election</span>

                          An election to Wexford County Council took place on 20 June 1985 as part of that year's Irish local elections. 21 councillors were elected from four electoral divisions by PR-STV voting for a six-year term of office.

                          <span class="mw-page-title-main">1985 Meath County Council election</span>

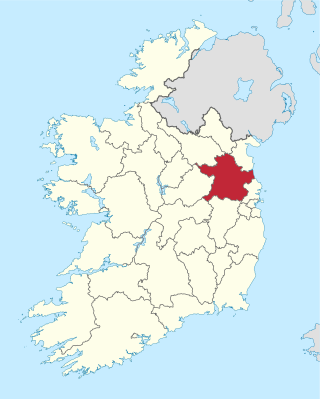
                          An election to Meath County Council took place on 20 June 1985 as part of that year's Irish local elections. 29 councillors were elected from five electoral divisions by PR-STV voting for a six-year term of office.

                          <span class="mw-page-title-main">1985 Offaly County Council election</span>

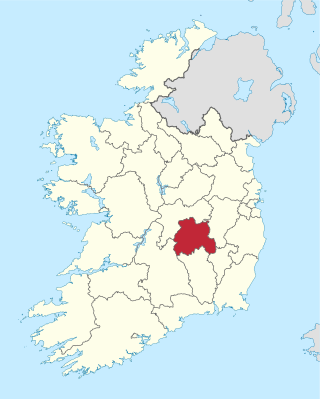
                          An election to Offaly County Council took place on 20 June 1985 as part of that year's Irish local elections. 21 councillors were elected from four electoral divisions by PR-STV voting for a six-year term of office.

                          <span class="mw-page-title-main">1985 Laois County Council election</span>

                          An election to Laois County Council took place on 20 June 1985 as part of that year's Irish local elections. 25 councillors were elected from five electoral divisions using the proportional representation-single transferable vote system for a six-year term of office.

                          References

                          1. 1 2 3 4 5 6 7 8 9 10 11 12 Department of the Environment, Ireland (28 January 2010). "Local elections, 1985 : election results and transfer of votes in respect of each county, and county borough council : and election statistics relating to all local authorities" (PDF). Department of the Environment. Retrieved 28 October 2019.