Alabama's 9th State Senate district | |||
---|---|---|---|
Senator |
| ||
Demographics | 77.8% White 4.9% Black 12.9% Hispanic 1% Asian | ||
Population (2022) | 148,634 | ||
Notes | [1] |
Alabama's 9th Senate district is one of 35 districts in the Alabama Senate. The district has been represented by Wes Kitchens since a special election in 2024.
Election | Map | Counties in District |
---|---|---|
Marshall, portions of Blount, Madison | ||
Marshall, portions of Blount, DeKalb, Madison | ||
Marshall, portions of Blount, Madison |
Kitchens was unopposed in the general election; as such, he was declared elected without a vote. [2]
Party | Candidate | Votes | % | |
---|---|---|---|---|
Republican | Wes Kitchens | 3,713 | 52.57 | |
Republican | Brock Colvin | 2,703 | 38.27 | |
Republican | Stacy Lee George | 647 | 9.16 | |
Majority | 1,010 | 14.30 | ||
Turnout | 7,063 |
Party | Candidate | Votes | % | ±% | |
---|---|---|---|---|---|
Republican | Clay Scofield (Incumbent) | 32,709 | 98.30 | −0.27 | |
Write-in | 566 | 1.70 | +0.27 | ||
Majority | 32,143 | 96.60 | −0.54 | ||
Turnout | 33,275 | ||||
Republican hold |
Party | Candidate | Votes | % | ±% | |
---|---|---|---|---|---|
Republican | Clay Scofield (Incumbent) | 35,192 | 98.57 | +0.04 | |
Write-in | 510 | 1.43 | -0.04 | ||
Majority | 34,682 | 97.14 | +0.08 | ||
Turnout | 35,702 | ||||
Republican hold |
Party | Candidate | Votes | % | ±% | |
---|---|---|---|---|---|
Republican | Clay Scofield (Incumbent) | 24,596 | 98.53 | +29.73 | |
Write-in | 367 | 1.47 | +1.37 | ||
Majority | 24,229 | 97.06 | |||
Turnout | 24,963 | ||||
Republican hold |
Party | Candidate | Votes | % | ±% | |
---|---|---|---|---|---|
Republican | Clay Scofield | 30,834 | 68.80 | +22.34 | |
Democratic | Tim Mitchell | 13,933 | 31.09 | −22.31 | |
Write-in | 47 | 0.10 | -0.03 | ||
Majority | 16,901 | 37.71 | +30.77 | ||
Turnout | 44,814 | ||||
Republican gain from Democratic |
Party | Candidate | Votes | % | ±% | |
---|---|---|---|---|---|
Democratic | Hinton Mitchem (Incumbent) | 21,570 | 53.40 | −5.54 | |
Republican | Bill Ingram | 18,766 | 46.46 | +5.75 | |
Write-in | 54 | 0.13 | -0.21 | ||
Majority | 2,804 | 6.94 | −11.29 | ||
Turnout | 40,390 | ||||
Democratic hold |
Party | Candidate | Votes | % | ±% | |
---|---|---|---|---|---|
Democratic | Hinton Mitchem (Incumbent) | 24,603 | 58.94 | −5.87 | |
Republican | Doris Edmonds | 16,995 | 40.71 | +5.54 | |
Write-in | 144 | 0.34 | +0.31 | ||
Majority | 7,608 | 18.23 | −11.41 | ||
Turnout | 41,742 | ||||
Democratic hold |
Party | Candidate | Votes | % | ±% | |
---|---|---|---|---|---|
Democratic | Hinton Mitchem (Incumbent) | 24,770 | 64.81 | +7.42 | |
Republican | Steven King | 13,441 | 35.17 | −7.44 | |
Write-in | 10 | 0.03 | +0.02 | ||
Majority | 11,329 | 29.64 | |||
Turnout | 38,221 | ||||
Democratic hold |
Party | Candidate | Votes | % | ±% | |
---|---|---|---|---|---|
Democratic | Hinton Mitchem (Incumbent) | 18,740 | 57.39 | −42.59 | |
Republican | D. Good | 13,914 | 42.61 | +42.61 | |
Write-in | 2 | 0.01 | -0.01 | ||
Majority | 4,826 | 14.78 | −85.18 | ||
Turnout | 32,656 | ||||
Democratic hold |
Party | Candidate | Votes | % | ±% | |
---|---|---|---|---|---|
Democratic | Hinton Mitchem (Incumbent) | 19,081 | 99.98 | +33.00 | |
Write-in | 3 | 0.02 | -0.03 | ||
Majority | 19,078 | 99.96 | +65.96 | ||
Turnout | 19,084 | ||||
Democratic hold |
Party | Candidate | Votes | % | ±% | |
---|---|---|---|---|---|
Democratic | Hinton Mitchem | 6,758 | 66.98 | −33.02 | |
Republican | Nell Skidmore | 3,327 | 32.97 | +32.97 | |
Write-in | 5 | 0.05 | +0.05 | ||
Majority | 3,431 | 34.00 | −66.00 | ||
Turnout | 10,090 | ||||
Democratic hold |
Party | Candidate | Votes | % | ±% | |
---|---|---|---|---|---|
Democratic | Loyd Coleman | 15,382 | 100.00 | +0.65 | |
Majority | 15,382 | 100.00 | +1.30 | ||
Turnout | 15,382 | ||||
Democratic hold |
Party | Candidate | Votes | % | ±% | |
---|---|---|---|---|---|
Democratic | Hinton Mitchem (Incumbent) | 4,588 | 99.35 | −0.64 | |
Write-in | 30 | 0.65 | +0.64 | ||
Majority | 4,558 | 98.70 | |||
Turnout | 4,618 | ||||
Democratic hold |
Party | Candidate | Votes | % | ±% | |
---|---|---|---|---|---|
Democratic | Hinton Mitchem (Incumbent) | 19,485 | 99.99 | ||
Write-in | 1 | 0.01 | |||
Majority | 19,484 | 99.98 | |||
Turnout | 19,486 | ||||
Democratic hold |
Senators take office at midnight on the day of their election. [12]
Alabama's 1st Senate district is one of 35 districts in the Alabama Senate. The district is currently represented by Tim Melson, a Republican.
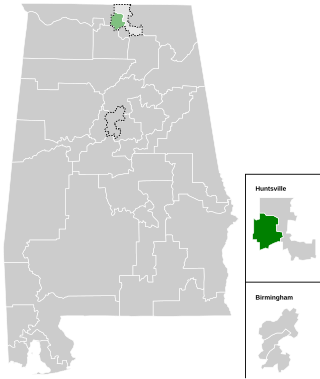
Alabama's 2nd Senate district is one of 35 districts in the Alabama Senate. The district currently is represented by Tom Butler (Republican).
Alabama's 3rd Senate district is one of 35 districts in the Alabama Senate. The district has been represented by Arthur Orr since 2006.
Alabama's 4th Senate district is one of 35 districts in the Alabama Senate. The district has been represented by Garlan Gudger since 2018, defeating incumbent Paul Bussman in a primary election.
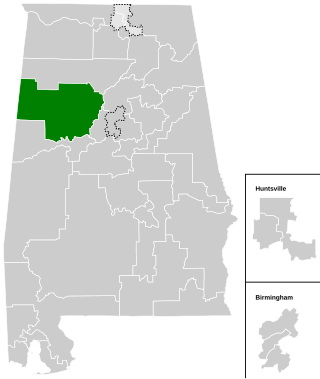
Alabama's 5th Senate district is one of 35 districts in the Alabama Senate. The district has been represented by Greg Reed, the president pro tempore of the Alabama Senate, since 2010.
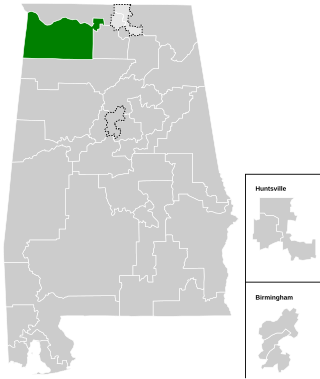
Alabama's 6th Senate district is one of 35 districts in the Alabama Senate. The district has been represented by Larry Stutts since 2014.
Alabama's 8th Senate district is one of 35 districts in the Alabama Senate. The district has been represented by Steve Livingston, the Senate Majority Leader, since 2014.
Alabama's 10th Senate district is one of 35 districts in the Alabama Senate. The district has been represented by Andrew Jones since 2018.
Alabama's 11th Senate district is one of 35 districts in the Alabama Senate. The district has been represented by Lance Bell since 2022.
Alabama's 14th Senate district is one of 35 districts in the Alabama Senate. The district has been represented by April Weaver since a special election in 2021.
Alabama's 15th Senate district is one of 35 districts in the Alabama Senate. The district has been represented by Dan Roberts since 2018.
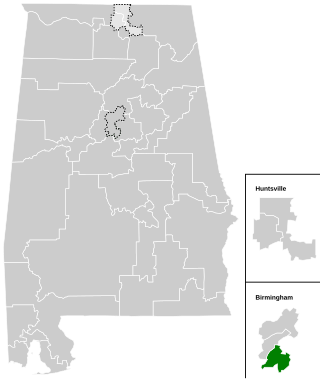
Alabama's 16th Senate district is one of 35 districts in the Alabama Senate. The district has been represented by J. T. Waggoner since 1990.
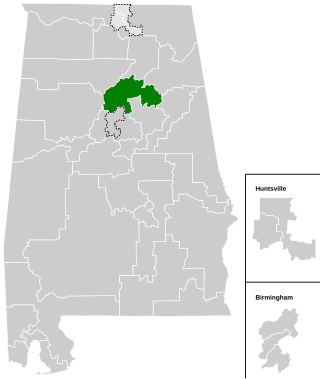
Alabama's 17th Senate district is one of 35 districts in the Alabama Senate. The district has been represented by Shay Shelnutt since 2014.
Alabama's 18th Senate district is one of 35 districts in the Alabama Senate. The district has been represented by Rodger Smitherman since 1994.
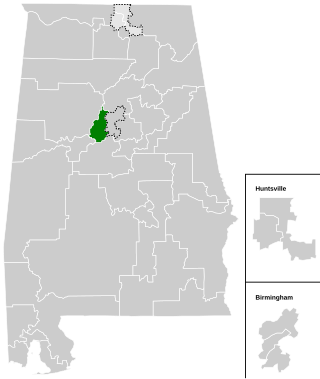
Alabama's 19th Senate district is one of 35 districts in the Alabama Senate. The district has been represented by Merika Coleman since 2022.
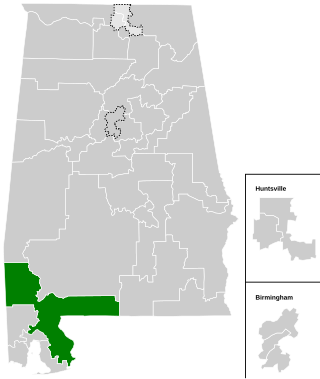
Alabama's 22nd Senate district is one of 35 districts in the Alabama Senate. The district has been represented by Greg Albritton since 2014.
Alabama's 23rd Senate district is one of 35 districts in the Alabama Senate. The district has been represented by Robert Stewart since 2022.
Alabama's 24th Senate district is one of 35 districts in the Alabama Senate. The district has been represented by Bobby Singleton, the Senate Minority Leader, since a special election in 2005.
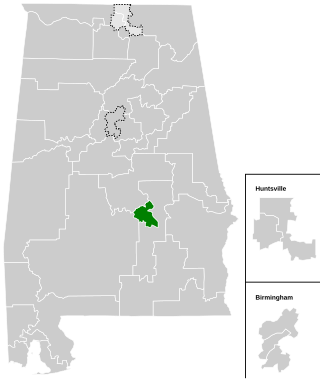
Alabama's 26th Senate district is one of 35 districts in the Alabama Senate. The district has been represented by Kirk Hatcher since a special election in 2021.
Alabama's 33rd Senate district is one of 35 districts in the Alabama Senate. The district has been represented by Vivian Davis Figures since a special election in 1997.