Alignments of random points

Last updated
80 4-point near-alignments of 137 random points Ley lines.svg
80 4-point near-alignments of 137 random points

The study of alignments of random points in a plane seeks to discover subsets of points that occupy an approximately straight line within a larger set of points that are randomly placed in a planar region. Studies have shown that such near-alignments occur by chance with greater frequency than one might intuitively expect.

Contents

This has been put forward as a demonstration that ley lines and other similar mysterious alignments believed by some to be phenomena of deep significance might exist solely due to chance alone, as opposed to the supernatural or anthropological explanations put forward by their proponents. The topic has also been studied in the fields of computer vision and astronomy.

A number of studies have examined the mathematics of alignment of random points on the plane. [1] [2] [3] [4] In all of these, the width of the line — the allowed displacement of the positions of the points from a perfect straight line — is important. It allows the fact that real-world features are not mathematical points, and that their positions need not line up exactly for them to be considered in alignment. Alfred Watkins, in his classic work on ley lines The Old Straight Track , used the width of a pencil line on a map as the threshold for the tolerance of what might be regarded as an alignment. For example, using a 1 mm pencil line to draw alignments on a 1:50,000 scale Ordnance Survey map, the corresponding width on the ground would be 50 m. [5]

Estimate of probability of chance alignments

Contrary to intuition, finding alignments between randomly placed points on a landscape gets progressively easier as the geographic area to be considered increases. One way of understanding this phenomenon is to see that the increase in the number of possible combinations of sets of points in that area overwhelms the decrease in the probability that any given set of points in that area line up.

One definition which expresses the generally accepted meaning of "alignment" is:

A set of points, chosen from a given set of landmark points, all of which lie within at least one straight path of a given width

More precisely, a path of width w may be defined as the set of all points within a distance of w/2 of a straight line on a plane, or a great circle on a sphere, or in general any geodesic on any other kind of manifold. Note that, in general, any given set of points that are aligned in this way will contain a large number of infinitesimally different straight paths. Therefore, only the existence of at least one straight path is necessary to determine whether a set of points is an alignment. For this reason, it is easier to count the sets of points, rather than the paths themselves. The number of alignments found is very sensitive to the allowed width w, increasing approximately proportionately to wk−2, where k is the number of points in an alignment.

The following is a very approximate order-of-magnitude estimate of the likelihood of alignments, assuming a plane covered with uniformly distributed "significant" points.

Consider a set of n points in a compact area with approximate diameter L and area approximately L2. Consider a valid line to be one where every point is within distance w/2 of the line (that is, lies on a track of width w, where wL).

Consider all the unordered sets of k points from the n points, of which there are:

(see factorial and binomial coefficient for notation).

To make a rough estimate of the probability that any given subset of k points is approximately collinear in the way defined above, consider the line between the "leftmost" and "rightmost" two points in that subset (for some arbitrary left/right axis: the top and bottom can be chosen for the exceptional vertical case). A straight line can trivially be drawn through those two points. For each of the remaining k-2 points in the subset, the probability that the point is "near enough" to the line is roughly w/L, which can be seen by considering the ratio of the area of the line tolerance zone (roughly wL) and the overall area (roughly L2).

So, based on the approximate estimates above, the expected number of k-point alignments in the overall set can be estimated to be very roughly equal to

Among other things this can be used to show that, contrary to intuition, the number of k-point lines expected from random chance in a plane covered with points at a given density, for a given line width, increases much more than linearly with the size of the area considered, since the combinatorial explosion of growth in the number of possible combinations of points more than makes up for the increase in difficulty of any given combination lining up.

More precise estimate of expected number of alignments

Using a similar, but more careful analysis, a more precise expression for the number of 3-point alignments of maximum width w and maximum length d expected by chance among n points placed randomly on a square of side L can be found as [2]

If dL and k = 3, it can be seen that this makes the same prediction as the rough estimate above, up to a constant factor.

If edge effects (alignments lost over the boundaries of the square) are included, then the expression becomes

A generalisation to k-point alignments (ignoring edge effects) is [3]

which has roughly similar asymptotic scaling properties as the crude approximation in the previous section, for the same reason; that combinatorial explosion for large n overwhelms the effects of other variables.

Computer simulation of alignments

607 4-point alignments of 269 random points Leylines.png
607 4-point alignments of 269 random points

Computer simulations show that points on a plane tend to form alignments similar to those found by ley hunters in numbers consistent with the order-of-magnitude estimates above, suggesting that ley lines may also be generated by chance. This phenomenon occurs regardless of whether the points are generated pseudo-randomly by computer, or from data sets of mundane features such as pizza restaurants or telephone booths.

On a map with a width of tens of kilometers, it is easy to find alignments of 4 to 8 points even in relatively small sets of features with w = 50 m. Choosing larger areas, denser sets of features, or larger values of w makes it easy to find alignments of 20 or more points.

See also

Related Research Articles

<span class="mw-page-title-main">Area</span> Size of a two-dimensional surface

Area is the measure of a region's size on a surface. The area of a plane region or plane area refers to the area of a shape or planar lamina, while surface area refers to the area of an open surface or the boundary of a three-dimensional object. Area can be understood as the amount of material with a given thickness that would be necessary to fashion a model of the shape, or the amount of paint necessary to cover the surface with a single coat. It is the two-dimensional analogue of the length of a curve or the volume of a solid . Two different regions may have the same area ; by synecdoche, "area" sometimes is used to refer to the region, as in a "polygonal area".

<span class="mw-page-title-main">Cauchy distribution</span> Probability distribution

The Cauchy distribution, named after Augustin Cauchy, is a continuous probability distribution. It is also known, especially among physicists, as the Lorentz distribution, Cauchy–Lorentz distribution, Lorentz(ian) function, or Breit–Wigner distribution. The Cauchy distribution is the distribution of the x-intercept of a ray issuing from with a uniformly distributed angle. It is also the distribution of the ratio of two independent normally distributed random variables with mean zero.

The number π is a mathematical constant that is the ratio of a circle's circumference to its diameter, approximately equal to 3.14159. The number π appears in many formulae across mathematics and physics. It is an irrational number, meaning that it cannot be expressed exactly as a ratio of two integers, although fractions such as are commonly used to approximate it. Consequently, its decimal representation never ends, nor enters a permanently repeating pattern. It is a transcendental number, meaning that it cannot be a solution of an equation involving only finite sums, products, powers, and integers. The transcendence of π implies that it is impossible to solve the ancient challenge of squaring the circle with a compass and straightedge. The decimal digits of π appear to be randomly distributed, but no proof of this conjecture has been found.

<span class="mw-page-title-main">Residue theorem</span> Concept of complex analysis

In complex analysis, the residue theorem, sometimes called Cauchy's residue theorem, is a powerful tool to evaluate line integrals of analytic functions over closed curves; it can often be used to compute real integrals and infinite series as well. It generalizes the Cauchy integral theorem and Cauchy's integral formula. The residue theorem should not be confused with special cases of the generalized Stokes' theorem; however, the latter can be used as an ingredient of its proof.

<span class="mw-page-title-main">Ball (mathematics)</span> Volume space bounded by a sphere

In mathematics, a ball is the solid figure bounded by a sphere; it is also called a solid sphere. It may be a closed ball or an open ball.

<span class="mw-page-title-main">Error function</span> Sigmoid shape special function

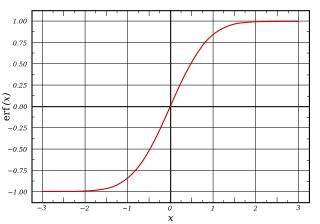
In mathematics, the error function, often denoted by erf, is a function defined as:

<span class="mw-page-title-main">Window function</span> Function used in signal processing

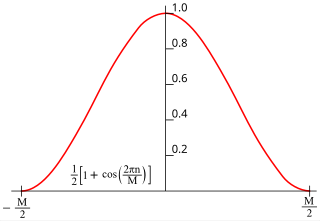
In signal processing and statistics, a window function is a mathematical function that is zero-valued outside of some chosen interval. Typically, window functions are symmetric around the middle of the interval, approach a maximum in the middle, and taper away from the middle. Mathematically, when another function or waveform/data-sequence is "multiplied" by a window function, the product is also zero-valued outside the interval: all that is left is the part where they overlap, the "view through the window". Equivalently, and in actual practice, the segment of data within the window is first isolated, and then only that data is multiplied by the window function values. Thus, tapering, not segmentation, is the main purpose of window functions.

In mathematics, the isoperimetric inequality is a geometric inequality involving the perimeter of a set and its volume. In -dimensional space the inequality lower bounds the surface area or perimeter of a set by its volume ,

<span class="mw-page-title-main">Buffon's needle problem</span> Question in geometric probability

In probability theory, Buffon's needle problem is a question first posed in the 18th century by Georges-Louis Leclerc, Comte de Buffon:

<span class="mw-page-title-main">Cone</span> Geometric shape

A cone is a three-dimensional geometric shape that tapers smoothly from a flat base to a point called the apex or vertex.

In optics, the Fraunhofer diffraction equation is used to model the diffraction of waves when plane waves are incident on a diffracting object, and the diffraction pattern is viewed at a sufficiently long distance from the object, and also when it is viewed at the focal plane of an imaging lens. In contrast, the diffraction pattern created near the diffracting object and is given by the Fresnel diffraction equation.

<span class="mw-page-title-main">Stable distribution</span> Distribution of variables which satisfies a stability property under linear combinations

In probability theory, a distribution is said to be stable if a linear combination of two independent random variables with this distribution has the same distribution, up to location and scale parameters. A random variable is said to be stable if its distribution is stable. The stable distribution family is also sometimes referred to as the Lévy alpha-stable distribution, after Paul Lévy, the first mathematician to have studied it.

<span class="mw-page-title-main">Directional statistics</span>

Directional statistics is the subdiscipline of statistics that deals with directions, axes or rotations in Rn. More generally, directional statistics deals with observations on compact Riemannian manifolds including the Stiefel manifold.

In mathematics, and specifically in potential theory, the Poisson kernel is an integral kernel, used for solving the two-dimensional Laplace equation, given Dirichlet boundary conditions on the unit disk. The kernel can be understood as the derivative of the Green's function for the Laplace equation. It is named for Siméon Poisson.

<span class="mw-page-title-main">Three-dimensional space</span> Geometric model of the physical space

In geometry, a three-dimensional space is a mathematical space in which three values (coordinates) are required to determine the position of a point. Most commonly, it is the three-dimensional Euclidean space, that is, the Euclidean space of dimension three, which models physical space. More general three-dimensional spaces are called 3-manifolds. The term may also refer colloquially to a subset of space, a three-dimensional region, a solid figure.

In mathematics, the Crofton formula, named after Morgan Crofton (1826–1915), is a classic result of integral geometry relating the length of a curve to the expected number of times a "random" line intersects it.

<span class="mw-page-title-main">Complex logarithm</span> Logarithm of a complex number

In mathematics, a complex logarithm is a generalization of the natural logarithm to nonzero complex numbers. The term refers to one of the following, which are strongly related:

The statistics of random permutations, such as the cycle structure of a random permutation are of fundamental importance in the analysis of algorithms, especially of sorting algorithms, which operate on random permutations. Suppose, for example, that we are using quickselect to select a random element of a random permutation. Quickselect will perform a partial sort on the array, as it partitions the array according to the pivot. Hence a permutation will be less disordered after quickselect has been performed. The amount of disorder that remains may be analysed with generating functions. These generating functions depend in a fundamental way on the generating functions of random permutation statistics. Hence it is of vital importance to compute these generating functions.

In optics, the Fraunhofer diffraction equation is used to model the diffraction of waves when the diffraction pattern is viewed at a long distance from the diffracting object, and also when it is viewed at the focal plane of an imaging lens.

In geometry, the mean line segment length is the average length of a line segment connecting two points chosen uniformly at random in a given shape. In other words, it is the expected Euclidean distance between two random points, where each point in the shape is equally likely to be chosen.

References

  1. Kendall, David G.; Kendall, Wilfrid S. (1980). "Alignments in Two-Dimensional Random Sets of Points". Advances in Applied Probability. 12 (2): 380–424. doi:10.2307/1426603. ISSN   0001-8678.
  2. 1 2 Edmunds, M. G.; George, G. H. (April 1981). "Random alignment of quasars". Nature. 290 (5806): 481–483. doi:10.1038/290481a0. ISSN   1476-4687.
  3. 1 2 George, G.H (2003-08-03). "Ph.D. Thesis of Glyn George: The Alignment and Clustering of Quasars" . Retrieved 2017-02-17.
  4. Lezama, José; Gioi, Rafael Grompone von; Morel, Jean-Michel; Randall, Grégory (2014-03-06), A Contrario 2D Point Alignment Detection , retrieved 2023-09-29
  5. Watkins, Alfred (1988). The Old Straight Track: Its Mounds, Beacons, Moats, Sites and Mark Stones. Abacus. ISBN   9780349137070.