Related Research Articles
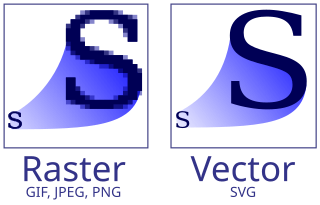
Vector graphics are a form of computer graphics in which visual images are created directly from geometric shapes defined on a Cartesian plane, such as points, lines, curves and polygons. The associated mechanisms may include vector display and printing hardware, vector data models and file formats, as well as the software based on these data models. Vector graphics are an alternative to raster or bitmap graphics, with each having advantages and disadvantages in specific situations.
X3D is a set of royalty-free ISO/IEC standards for declaratively representing 3D computer graphics. X3D includes multiple graphics file formats, programming-language API definitions, and run-time specifications for both delivery and integration of interactive network-capable 3D data. X3D version 4.0 has been approved by Web3D Consortium, and is under final review by ISO/IEC as a revised International Standard (IS).

Scientific visualization is an interdisciplinary branch of science concerned with the visualization of scientific phenomena. It is also considered a subset of computer graphics, a branch of computer science. The purpose of scientific visualization is to graphically illustrate scientific data to enable scientists to understand, illustrate, and glean insight from their data. Research into how people read and misread various types of visualizations is helping to determine what types and features of visualizations are most understandable and effective in conveying information.

NASA WorldWind is an open-source virtual globe. According to the website, "WorldWind is an open source virtual globe API. WorldWind allows developers to quickly and easily create interactive visualizations of 3D globe, map and geographical information. Organizations around the world use WorldWind to monitor weather patterns, visualize cities and terrain, track vehicle movement, analyze geospatial data and educate humanity about the Earth." It was first developed by NASA in 2003 for use on personal computers and then further developed in concert with the open source community since 2004. As of 2017, a web-based version of WorldWind is available online. An Android version is also available.

OpenSceneGraph is an open-source 3D graphics application programming interface, used by application developers in fields such as visual simulation, computer games, virtual reality, scientific visualization and modeling.
COLLADA is an interchange file format for interactive 3D applications. It is managed by the nonprofit technology consortium, the Khronos Group, and has been adopted by ISO as a publicly available specification, ISO/PAS 17506.
TerraLib is an open-source geographic information system (GIS) software library. It extends object-relational database management systems (DBMS) to handle spatiotemporal data types.
A GIS software program is a computer program to support the use of a geographic information system, providing the ability to create, store, manage, query, analyze, and visualize geographic data, that is, data representing phenomena for which location is important. The GIS software industry encompasses a broad range of commercial and open-source products that provide some or all of these capabilities within various information technology architectures.
Universal 3D (U3D) is a compressed file format standard for 3D computer graphics data.
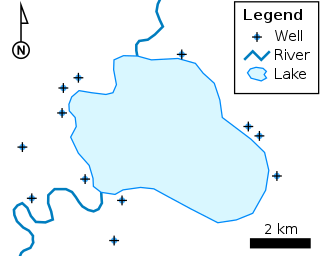
The shapefile format is a geospatial vector data format for geographic information system (GIS) software. It is developed and regulated by Esri as a mostly open specification for data interoperability among Esri and other GIS software products. The shapefile format can spatially describe vector features: points, lines, and polygons, representing, for example, water wells, rivers, and lakes. Each item usually has attributes that describe it, such as name or temperature.
ArcGIS is a family of client, server and online geographic information system (GIS) software developed and maintained by Esri.

Java Unified Mapping Program (JUMP) is a Java based vector and raster GIS and programming framework. Current development continues under the OpenJUMP name.
The Geospatial Data Abstraction Library (GDAL) is a computer software library for reading and writing raster and vector geospatial data formats, and is released under the permissive X/MIT style free software license by the Open Source Geospatial Foundation. As a library, it presents a single abstract data model to the calling application for all supported formats. It may also be built with a variety of useful command line interface utilities for data translation and processing. Projections and transformations are supported by the PROJ library.
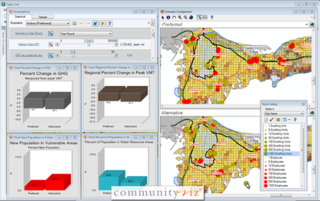
CommunityViz is a group of extensions to ArcGIS Geographic Information System software. CommunityViz is an analysis tool used for, among other applications, urban planning, land use planning, geodesign, transportation planning and resource management applications. It also provides options for 3D visualization in the Scenario 3D and Scenario 360 plugins. CommunityViz also allows users to export and view their work in ArcGIS Online, Google Earth and other KML/KMZ viewers such as ArcGIS Explorer. The software was originally produced by the Orton Family Foundation and in 2005 was handed off to Placeways LLC. In 2017, the software was purchased by City Explained, Inc. where its development continues.
3DMLW is a discontinued open-source project, and a XML-based Markup Language for representing interactive 3D and 2D content on the World Wide Web.

A 3D city model is digital model of urban areas that represent terrain surfaces, sites, buildings, vegetation, infrastructure and landscape elements in three-dimensional scale as well as related objects belonging to urban areas. Their components are described and represented by corresponding two- and three-dimensional spatial data and geo-referenced data. 3D city models support presentation, exploration, analysis, and management tasks in a large number of different application domains. In particular, 3D city models allow "for visually integrating heterogeneous geoinformation within a single framework and, therefore, create and manage complex urban information spaces."

ArcGIS CityEngine is a commercial three-dimensional (3D) modeling program developed by Esri R&D Center Zurich and specialises in the generation of 3D urban environments. Using a procedural modeling approach, it supports the creation of detailed large-scale 3D city models. CityEngine works with architectural object placement and arrangement in the same manner that software like VUE manages terrain, ecosystems and atmosphere mapping. Unlike the traditional 3D modeling methodology which uses Computer-Aided Design (CAD) tools and techniques, CityEngine takes a different approach to shape generation via a rule-based system. It can also use Geographic Information System (GIS) datasets due to its integration with the wider Esri/ArcGIS platform. Due to this unique feature set, CityEngine has been used in academic research and built environment professions, e.g., urban planning, architecture, visualization, game development, entertainment, archeology, military and cultural heritage. CityEngine can be used within Building Information Model (BIM) workflows as well as visualizing the data of buildings in a larger urban context, enhancing its working scenario toward real construction projects.

Amira is a software platform for visualization, processing, and analysis of 3D and 4D data. It is being actively developed by Thermo Fisher Scientific in collaboration with the Zuse Institute Berlin (ZIB), and commercially distributed by Thermo Fisher Scientific — together with its sister software Avizo.
GPlates is open-source application software offering a novel combination of interactive plate-tectonic reconstructions, geographic information system (GIS) functionality and raster data visualisation.
References
- ↑ OpenGL Extensions Viewer http://www.realtech-vr.com/glview/