Breese | |
|---|---|
 Flag  Coat of arms | |
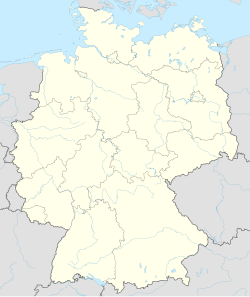
Location of Breese within Prignitz district  | |
 Location of Breese | |
 Breese 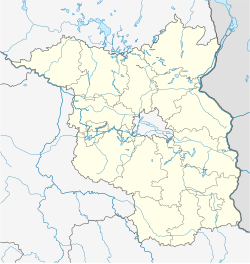 Breese | |
| Coordinates: 53°00′N11°48′E / 53.000°N 11.800°E | |
| Country | Germany |
| State | Brandenburg |
| District | Prignitz |
| Municipal assoc. | Bad Wilsnack/Weisen |
| Subdivisions | 2 Ortsteile |
| Government | |
| • Mayor (2024–29) | Fabien Wiesemann [1] |
| Area | |
• Total | 6.31 km2 (2.44 sq mi) |
| Elevation | 25 m (82 ft) |
| Population (2023-12-31) [2] | |
• Total | 1,493 |
| • Density | 237/km2 (613/sq mi) |
| Time zone | UTC+01:00 (CET) |
| • Summer (DST) | UTC+02:00 (CEST) |
| Postal codes | 19322 |
| Dialling codes | 03877 + 038791 |
| Vehicle registration | PR |
| Website | amt-badwilsnack-weisen.de |
Breese is a municipality in the Prignitz district, in Brandenburg, Germany.

