
Nondestructive testing (NDT) is any of a wide group of analysis techniques used in science and technology industry to evaluate the properties of a material, component or system without causing damage. The terms nondestructive examination (NDE), nondestructive inspection (NDI), and nondestructive evaluation (NDE) are also commonly used to describe this technology. Because NDT does not permanently alter the article being inspected, it is a highly valuable technique that can save both money and time in product evaluation, troubleshooting, and research. The six most frequently used NDT methods are eddy-current, magnetic-particle, liquid penetrant, radiographic, ultrasonic, and visual testing. NDT is commonly used in forensic engineering, mechanical engineering, petroleum engineering, electrical engineering, civil engineering, systems engineering, aeronautical engineering, medicine, and art. Innovations in the field of nondestructive testing have had a profound impact on medical imaging, including on echocardiography, medical ultrasonography, and digital radiography.

In materials science, fatigue is the initiation and propagation of cracks in a material due to cyclic loading. Once a fatigue crack has initiated, it grows a small amount with each loading cycle, typically producing striations on some parts of the fracture surface. The crack will continue to grow until it reaches a critical size, which occurs when the stress intensity factor of the crack exceeds the fracture toughness of the material, producing rapid propagation and typically complete fracture of the structure.
Limit State Design (LSD), also known as Load And Resistance Factor Design (LRFD), refers to a design method used in structural engineering. A limit state is a condition of a structure beyond which it no longer fulfills the relevant design criteria. The condition may refer to a degree of loading or other actions on the structure, while the criteria refer to structural integrity, fitness for use, durability or other design requirements. A structure designed by LSD is proportioned to sustain all actions likely to occur during its design life, and to remain fit for use, with an appropriate level of reliability for each limit state. Building codes based on LSD implicitly define the appropriate levels of reliability by their prescriptions.
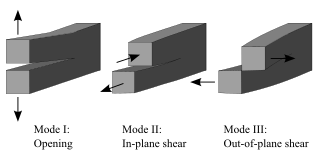
Fracture mechanics is the field of mechanics concerned with the study of the propagation of cracks in materials. It uses methods of analytical solid mechanics to calculate the driving force on a crack and those of experimental solid mechanics to characterize the material's resistance to fracture.

Failure mode and effects analysis is the process of reviewing as many components, assemblies, and subsystems as possible to identify potential failure modes in a system and their causes and effects. For each component, the failure modes and their resulting effects on the rest of the system are recorded in a specific FMEA worksheet. There are numerous variations of such worksheets. An FMEA can be a qualitative analysis, but may be put on a quantitative basis when mathematical failure rate models are combined with a statistical failure mode ratio database. It was one of the first highly structured, systematic techniques for failure analysis. It was developed by reliability engineers in the late 1950s to study problems that might arise from malfunctions of military systems. An FMEA is often the first step of a system reliability study.
In engineering, damage tolerance is a property of a structure relating to its ability to sustain defects safely until repair can be effected. The approach to engineering design to account for damage tolerance is based on the assumption that flaws can exist in any structure and such flaws propagate with usage. This approach is commonly used in aerospace engineering, mechanical engineering, and civil engineering to manage the extension of cracks in structure through the application of the principles of fracture mechanics. A structure is considered to be damage tolerant if a maintenance program has been implemented that will result in the detection and repair of accidental damage, corrosion and fatigue cracking before such damage reduces the residual strength of the structure below an acceptable limit.
Reliability engineering is a sub-discipline of systems engineering that emphasizes the ability of equipment to function without failure. Reliability describes the ability of a system or component to function under stated conditions for a specified period. Reliability is closely related to availability, which is typically described as the ability of a component or system to function at a specified moment or interval of time.
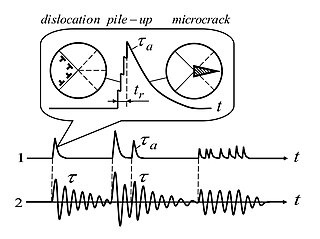
Acoustic emission (AE) is the phenomenon of radiation of acoustic (elastic) waves in solids that occurs when a material undergoes irreversible changes in its internal structure, for example as a result of crack formation or plastic deformation due to aging, temperature gradients, or external mechanical forces.
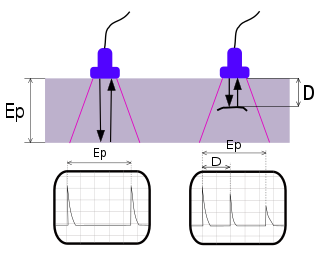
Ultrasonic testing (UT) is a family of non-destructive testing techniques based on the propagation of ultrasonic waves in the object or material tested. In most common UT applications, very short ultrasonic pulse waves with centre frequencies ranging from 0.1-15 MHz and occasionally up to 50 MHz, are transmitted into materials to detect internal flaws or to characterize materials. A common example is ultrasonic thickness measurement, which tests the thickness of the test object, for example, to monitor pipework corrosion and erosion. Ultrasonic testing is extensively used to detect flaws in welds.
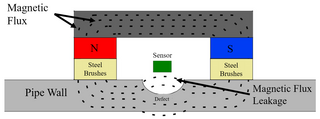
Magnetic flux leakage is a magnetic method of nondestructive testing to detect corrosion and pitting in steel structures, for instance: pipelines and storage tanks. The basic principle is that the magnetic field "leaks" from the steel at areas where there is corrosion or missing metal. To magnetize the steel, a powerful magnet is used. In an MFL tool, a magnetic detector is placed between the poles of the magnet to detect the leakage field. Analysts interpret the chart recording of the leakage field to identify damaged areas and to estimate the depth of metal loss.
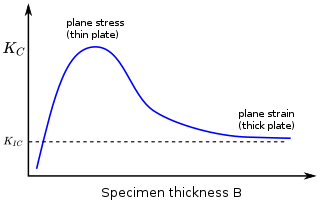
In materials science, fracture toughness is the critical stress intensity factor of a sharp crack where propagation of the crack suddenly becomes rapid and unlimited. A component's thickness affects the constraint conditions at the tip of a crack with thin components having plane stress conditions and thick components having plane strain conditions. Plane strain conditions give the lowest fracture toughness value which is a material property. The critical value of stress intensity factor in mode I loading measured under plane strain conditions is known as the plane strain fracture toughness, denoted . When a test fails to meet the thickness and other test requirements that are in place to ensure plane strain conditions, the fracture toughness value produced is given the designation . Fracture toughness is a quantitative way of expressing a material's resistance to crack propagation and standard values for a given material are generally available.
A blade inspection method is the practice of monitoring the condition of a blade, such as a helicopter's rotor blade, for deterioration or damage. A common area of focus in the aviation industry has been the detection of cracking, which is commonly associated with fatigue. Automated blade condition monitoring technology has been developed for helicopters and has seen widespread adoption. The technique is routinely mandated by airworthiness authorities for engine inspections. Another commercial sector where such monitoring has become important is electricity generation, particularly on wind farms.
Alternating current field measurement (ACFM) is an electromagnetic technique for non-destructive testing detection and sizing of surface breaking discontinuities. It was derived from the methods used in eddy-current testing and works on all metals, ferrous or non-ferrous. Since it doesn't require direct electrical contact with the surface it can work through thin coatings such as paint. This practice is intended for use on welds in any metallic material.

A plot is a graphical technique for representing a data set, usually as a graph showing the relationship between two or more variables. The plot can be drawn by hand or by a computer. In the past, sometimes mechanical or electronic plotters were used. Graphs are a visual representation of the relationship between variables, which are very useful for humans who can then quickly derive an understanding which may not have come from lists of values. Given a scale or ruler, graphs can also be used to read off the value of an unknown variable plotted as a function of a known one, but this can also be done with data presented in tabular form. Graphs of functions are used in mathematics, sciences, engineering, technology, finance, and other areas.

Industrial computed tomography (CT) scanning is any computer-aided tomographic process, usually X-ray computed tomography, that uses irradiation to produce three-dimensional internal and external representations of a scanned object. Industrial CT scanning has been used in many areas of industry for internal inspection of components. Some of the key uses for industrial CT scanning have been flaw detection, failure analysis, metrology, assembly analysis and reverse engineering applications. Just as in medical imaging, industrial imaging includes both nontomographic radiography and computed tomographic radiography.
The wafer bond characterization is based on different methods and tests. Considered a high importance of the wafer are the successful bonded wafers without flaws. Those flaws can be caused by void formation in the interface due to unevenness or impurities. The bond connection is characterized for wafer bond development or quality assessment of fabricated wafers and sensors.
Terahertz nondestructive evaluation pertains to devices, and techniques of analysis occurring in the terahertz domain of electromagnetic radiation. These devices and techniques evaluate the properties of a material, component or system without causing damage.
Welding of advanced thermoplastic composites is a beneficial method of joining these materials compared to mechanical fastening and adhesive bonding. Mechanical fastening requires intense labor, and creates stress concentrations, while adhesive bonding requires extensive surface preparation, and long curing cycles. Welding these materials is a cost-effective method of joining concerning preparation and execution, and these materials retain their properties upon cooling, so no post processing is necessary. These materials are widely used in the aerospace industry to reduce weight of a part while keeping strength.

Fatigue testing is a specialised form of mechanical testing that is performed by applying cyclic loading to a coupon or structure. These tests are used either to generate fatigue life and crack growth data, identify critical locations or demonstrate the safety of a structure that may be susceptible to fatigue. Fatigue tests are used on a range of components from coupons through to full size test articles such as automobiles and aircraft.
Stress testing is a form of deliberately intense or thorough testing, used to determine the stability of a given system, critical infrastructure or entity. It involves testing beyond normal operational capacity, often to a breaking point, in order to observe the results.


