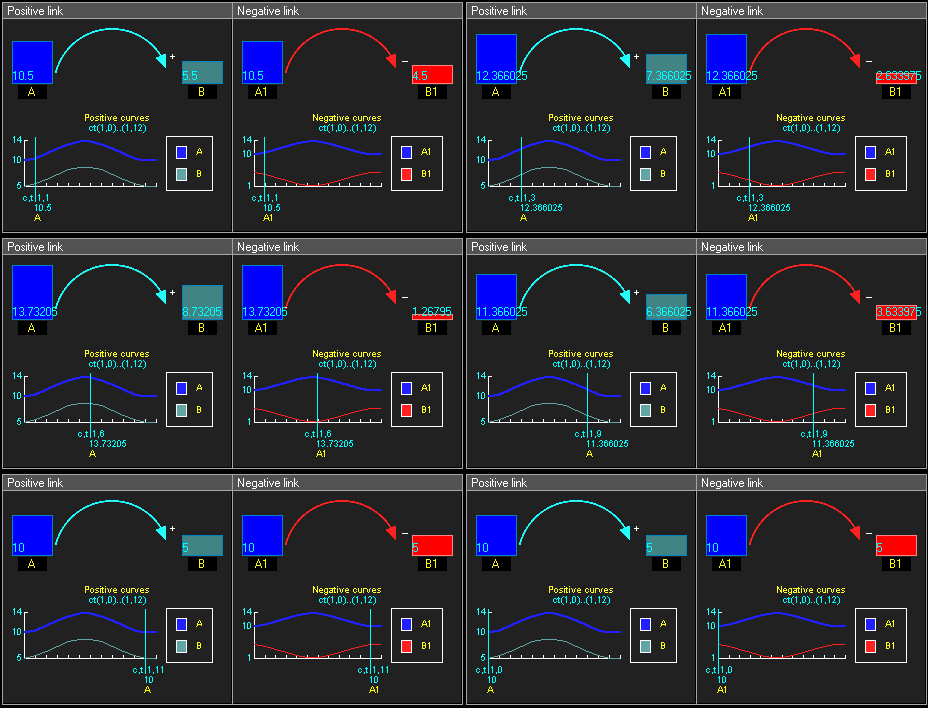
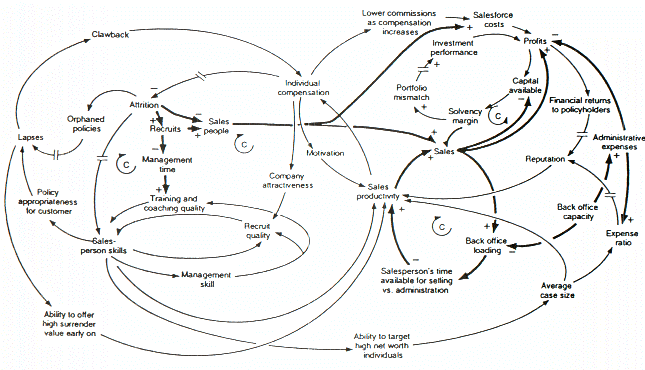
A causal loop diagram (CLD) is a causal diagram that visualizes how different variables in a system are causally interrelated. The diagram consists of a set of words and arrows. Causal loop diagrams are accompanied by a narrative which describes the causally closed situation the CLD describes. Closed loops, or causal feedback loops, in the diagram are very important features of CLDs because they may help identify non-obvious vicious circles and virtuous circles.
The words with arrows coming in and out represent variables, or quantities whose value changes over time and the links represent a causal relationship between the two variables (i.e., they do not represent a material flow). A link marked +
indicates a positive relation where an increase in the causal variable leads, all else equal, to an increase in the effect variable, or a decrease in the causal variable leads, all else equal, to a decrease in the effect variable. A link marked -
indicates a negative relation where an increase in the causal variable leads, all else equal, to a decrease in the effect variable, or a decrease in the causal variable leads, all else equal, to an increase in the effect variable. A positive causal link can be said to lead to a change in the same direction, and an opposite link can be said to lead to change in the opposite direction, i.e. if the variable in which the link starts increases, the other variable decreases and vice versa.
The words without arrows are loop labels. As with the links, feedback loops have either positive (i.e., reinforcing) or negative (i.e., balancing) polarity. CLDs contain labels for these processes, often using numbering (e.g., B1 for the first balancing loop being described in a narrative, B2 for the second one, etc.), and phrases that describe the function of the loop (i.e., "haste makes waste"). A reinforcing loop is a cycle in which the effect of a variation in any variable propagates through the loop and returns to reinforce the initial deviation (i.e. if a variable increases in a reinforcing loop the effect through the cycle will return an increase to the same variable and vice versa). A balancing loop is the cycle in which the effect of a variation in any variable propagates through the loop and returns to the variable a deviation opposite to the initial one (i.e. if a variable increases in a balancing loop the effect through the cycle will return a decrease to the same variable and vice versa). Balancing loops are typically goal-seeking, or error-sensitive, processes and are presented with the variable indicating the goal of the loop. Reinforcing loops are typically vicious or virtuous cycles.
Example of positive reinforcing loop shown in the illustration:
Bank Balance
will affect the amount of the Earned Interest
, as represented by the top blue arrow, pointing from 'Bank Balance
to Earned Interest
.Bank balance
results in an increase in Earned Interest
, this link is positive, which is denoted with a +
.Earned interest
gets added to the Bank balance
, also a positive link, represented by the bottom blue arrow.The use of words and arrows (known in network theory as nodes and edges) to construct directed graph models of cause and effect dates back, at least, to the use of path analysis by Sewall Wright in 1918. According to George Richardson's book "Feedback Thought in Social Science and Systems Theory", [2] the first published, formal use of a causal loop diagram to describe a feedback system was Magoroh Maruyama's 1963 article "The Second Cybernetics: Deviation-Amplifying Mutual Causal Processes". [3]
To determine if a causal loop is reinforcing or balancing, one can start with an assumption, e.g. "Variable 1 increases" and follow the loop around. The loop is:
Or to put it in other words:
Identifying reinforcing and balancing loops is an important step for identifying Reference Behaviour Patterns, i.e. possible dynamic behaviours of the system.
If the system has delays (often denoted by drawing a short line across the causal link), the system might fluctuate.
Control theory is a field of control engineering and applied mathematics that deals with the control of dynamical systems in engineered processes and machines. The objective is to develop a model or algorithm governing the application of system inputs to drive the system to a desired state, while minimizing any delay, overshoot, or steady-state error and ensuring a level of control stability; often with the aim to achieve a degree of optimality.
Feedback occurs when outputs of a system are routed back as inputs as part of a chain of cause-and-effect that forms a circuit or loop. The system can then be said to feed back into itself. The notion of cause-and-effect has to be handled carefully when applied to feedback systems:
Simple causal reasoning about a feedback system is difficult because the first system influences the second and second system influences the first, leading to a circular argument. This makes reasoning based upon cause and effect tricky, and it is necessary to analyze the system as a whole. As provided by Webster, feedback in business is the transmission of evaluative or corrective information about an action, event, or process to the original or controlling source.
System dynamics (SD) is an approach to understanding the nonlinear behaviour of complex systems over time using stocks, flows, internal feedback loops, table functions and time delays.
A negative-feedback amplifier is an electronic amplifier that subtracts a fraction of its output from its input, so that negative feedback opposes the original signal. The applied negative feedback can improve its performance and reduces sensitivity to parameter variations due to manufacturing or environment. Because of these advantages, many amplifiers and control systems use negative feedback.
In mathematics, particularly graph theory, and computer science, a directed acyclic graph (DAG) is a directed graph with no directed cycles. That is, it consists of vertices and edges, with each edge directed from one vertex to another, such that following those directions will never form a closed loop. A directed graph is a DAG if and only if it can be topologically ordered, by arranging the vertices as a linear ordering that is consistent with all edge directions. DAGs have numerous scientific and computational applications, ranging from biology to information science to computation (scheduling).
Negative feedback occurs when some function of the output of a system, process, or mechanism is fed back in a manner that tends to reduce the fluctuations in the output, whether caused by changes in the input or by other disturbances. A classic example of negative feedback is a heating system thermostat — when the temperature gets high enough, the heater is turned OFF. When the temperature gets too cold, the heat is turned back ON. In each case the "feedback" generated by the thermostat "negates" the trend.
Positive feedback is a process that occurs in a feedback loop which exacerbates the effects of a small disturbance. That is, the effects of a perturbation on a system include an increase in the magnitude of the perturbation. That is, A produces more of B which in turn produces more of A. In contrast, a system in which the results of a change act to reduce or counteract it has negative feedback. Both concepts play an important role in science and engineering, including biology, chemistry, and cybernetics.
A vicious circle is a complex chain of events that reinforces itself through a feedback loop, with detrimental results. It is a system with no tendency toward equilibrium, at least in the short run. Each iteration of the cycle reinforces the previous one, in an example of positive feedback. A vicious circle will continue in the direction of its momentum until an external factor intervenes to break the cycle. A well-known example of a vicious circle in economics is hyperinflation.
In statistics, path analysis is used to describe the directed dependencies among a set of variables. This includes models equivalent to any form of multiple regression analysis, factor analysis, canonical correlation analysis, discriminant analysis, as well as more general families of models in the multivariate analysis of variance and covariance analyses.
Industrial process control (IPC) or simply process control is a system used in modern manufacturing which uses the principles of control theory and physical industrial control systems to monitor, control and optimize continuous industrial production processes using control algorithms. This ensures that the industrial machines run smoothly and safely in factories and efficiently use energy to transform raw materials into high-quality finished products with reliable consistency while reducing energy waste and economic costs, something which could not be achieved purely by human manual control.
In the area of graph theory in mathematics, a signed graph is a graph in which each edge has a positive or negative sign.
In electronic amplifiers, the phase margin (PM) is the difference between the phase lag φ and -180°, for an amplifier's output signal at zero dB gain - i.e. unity gain, or that the output signal has the same amplitude as the input.
Kinetic logic, developed by René Thomas, is a Qualitative Modeling approach feasible to model impact, feedback, and the temporal evolution of the variables. It uses symbolic descriptions and avoids continuous descriptions e.g. differential equations.The derivation of the dynamics from the interaction graphs of systems is not easy. A lot of parameters have to be inferred, for differential description, even if the type of each interaction is known in the graph. Even small modifications in parameters can lead to a strong change in the dynamics. Kinetic Logic is used to build discrete models, in which such details of the systems are not required. The information required can be derived directly from the graph of interactions or from a sufficiently explicit verbal description. It only considers the thresholds of the elements and uses logical equations to construct state tables. Through this procedure, it is a straightforward matter to determine the behavior of the system.
The CLAW hypothesis proposes a negative feedback loop that operates between ocean ecosystems and the Earth's climate. The hypothesis specifically proposes that particular phytoplankton that produce dimethyl sulfide are responsive to variations in climate forcing, and that these responses act to stabilise the temperature of the Earth's atmosphere. The CLAW hypothesis was originally proposed by Robert Jay Charlson, James Lovelock, Meinrat Andreae and Stephen G. Warren, and takes its acronym from the first letter of their surnames.
A system archetype is a pattern of behavior of a system. Systems expressed by circles of causality have therefore similar structure. Identifying a system archetype and finding the leverage enables efficient changes in a system. The basic system archetypes and possible solutions of the problems are mentioned in the section Examples of system archetypes. A fundamental property of nature is that no cause can affect the past. System archetypes do not imply that current causes affect past effects.
Fixes that fail is a system archetype that in system dynamics is used to describe and analyze a situation, where a fix effective in the short-term creates side effects for the long-term behaviour of the system and may result in the need of even more fixes. This archetype may be also known as fixes that backfire or corrective actions that fail. It resembles the Shifting the burden archetype.
Accidental Adversaries is one of the ten system archetypes used in system dynamics modelling, or systems thinking. This archetype describes the degenerative pattern that develops when two subjects cooperating for a common goal, accidentally take actions that undermine each other's success. It is similar to the escalation system archetype in terms of pattern behaviour that develops over time.
The growth and underinvestment archetype is one of the common system archetype patterns defined as part of the system dynamics discipline.
The escalation archetype is one of possible types of system behaviour that are known as system archetypes.
Causal notation is notation used to express cause and effect.