Network theory

Last updated
A small example network with eight vertices (nodes) and ten edges (links) Small Network.png
A small example network with eight vertices (nodes) and ten edges (links)

In mathematics, computer science and network science, network theory is a part of graph theory. It defines networks as graphs where the nodes or edges possess attributes. Network theory analyses these networks over the symmetric relations or asymmetric relations between their (discrete) components.

Contents

Network theory has applications in many disciplines, including statistical physics, particle physics, computer science, electrical engineering, [1] [2] biology, [3] archaeology, [4] linguistics, [5] [6] [7] economics, finance, operations research, climatology, ecology, public health, [8] [9] [10] sociology, [11] psychology, [12] and neuroscience. [13] [14] [15] Applications of network theory include logistical networks, the World Wide Web, Internet, gene regulatory networks, metabolic networks, social networks, epistemological networks, etc.; see List of network theory topics for more examples.

Euler's solution of the Seven Bridges of Königsberg problem is considered to be the first true proof in the theory of networks.

Network optimization

Network problems that involve finding an optimal way of doing something are studied as combinatorial optimization. Examples include network flow, shortest path problem, transport problem, transshipment problem, location problem, matching problem, assignment problem, packing problem, routing problem, critical path analysis, and program evaluation and review technique.

Network analysis

Electric network analysis

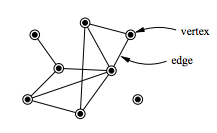
The analysis of electric power systems could be conducted using network theory from two main points of view:

  1. An abstract perspective (i.e., as a graph consists from nodes and edges), regardless of the electric power aspects (e.g., transmission line impedances). Most of these studies focus only on the abstract structure of the power grid using node degree distribution and betweenness distribution, which introduces substantial insight regarding the vulnerability assessment of the grid. Through these types of studies, the category of the grid structure could be identified from the complex network perspective (e.g., single-scale, scale-free). This classification might help the electric power system engineers in the planning stage or while upgrading the infrastructure (e.g., add a new transmission line) to maintain a proper redundancy level in the transmission system. [1]
  2. Weighted graphs that blend an abstract understanding of complex network theories and electric power systems properties. [2]

Social network analysis

Visualization of social network analysis Social Network Analysis Visualization.png
Visualization of social network analysis

Social network analysis examines the structure of relationships between social entities. [17] These entities are often persons, but may also be groups, organizations, nation states, web sites, or scholarly publications.

Since the 1970s, the empirical study of networks has played a central role in social science, and many of the mathematical and statistical tools used for studying networks have been first developed in sociology. [18] Amongst many other applications, social network analysis has been used to understand the diffusion of innovations, news and rumors. [19] Similarly, it has been used to examine the spread of both diseases and health-related behaviors. [20] It has also been applied to the study of markets, where it has been used to examine the role of trust in exchange relationships and of social mechanisms in setting prices. [21] It has been used to study recruitment into political movements, armed groups, and other social organizations. [22] It has also been used to conceptualize scientific disagreements [23] as well as academic prestige. [24] More recently, network analysis (and its close cousin traffic analysis) has gained a significant use in military intelligence, [25] for uncovering insurgent networks of both hierarchical and leaderless nature.[ citation needed ]

Biological network analysis

With the recent explosion of publicly available high throughput biological data, the analysis of molecular networks has gained significant interest. [26] The type of analysis in this context is closely related to social network analysis, but often focusing on local patterns in the network. For example, network motifs are small subgraphs that are over-represented in the network. Similarly, activity motifs are patterns in the attributes of nodes and edges in the network that are over-represented given the network structure. Using networks to analyze patterns in biological systems, such as food-webs, allows us to visualize the nature and strength of interactions between species. The analysis of biological networks with respect to diseases has led to the development of the field of network medicine. [27] Recent examples of application of network theory in biology include applications to understanding the cell cycle [28] as well as a quantitative framework for developmental processes. [29]

Narrative network analysis

Narrative network of US Elections 2012 Tripletsnew2012.png
Narrative network of US Elections 2012

The automatic parsing of textual corpora has enabled the extraction of actors and their relational networks on a vast scale. The resulting narrative networks, which can contain thousands of nodes, are then analyzed by using tools from Network theory to identify the key actors, the key communities or parties, and general properties such as robustness or structural stability of the overall network, or centrality of certain nodes. [31] This automates the approach introduced by Quantitative Narrative Analysis, [32] whereby subject-verb-object triplets are identified with pairs of actors linked by an action, or pairs formed by actor-object. [30]

Link analysis is a subset of network analysis, exploring associations between objects. An example may be examining the addresses of suspects and victims, the telephone numbers they have dialed, and financial transactions that they have partaken in during a given timeframe, and the familial relationships between these subjects as a part of police investigation. Link analysis here provides the crucial relationships and associations between very many objects of different types that are not apparent from isolated pieces of information. Computer-assisted or fully automatic computer-based link analysis is increasingly employed by banks and insurance agencies in fraud detection, by telecommunication operators in telecommunication network analysis, by medical sector in epidemiology and pharmacology, in law enforcement investigations, by search engines for relevance rating (and conversely by the spammers for spamdexing and by business owners for search engine optimization), and everywhere else where relationships between many objects have to be analyzed. Links are also derived from similarity of time behavior in both nodes. Examples include climate networks where the links between two locations (nodes) are determined, for example, by the similarity of the rainfall or temperature fluctuations in both sites. [33] [34]

Several Web search ranking algorithms use link-based centrality metrics, including Google's PageRank, Kleinberg's HITS algorithm, the CheiRank and TrustRank algorithms. Link analysis is also conducted in information science and communication science in order to understand and extract information from the structure of collections of web pages. For example, the analysis might be of the interlinking between politicians' websites or blogs. Another use is for classifying pages according to their mention in other pages. [35]

Centrality measures

Information about the relative importance of nodes and edges in a graph can be obtained through centrality measures, widely used in disciplines like sociology. For example, eigenvector centrality uses the eigenvectors of the adjacency matrix corresponding to a network, to determine nodes that tend to be frequently visited. Formally established measures of centrality are degree centrality, closeness centrality, betweenness centrality, eigenvector centrality, subgraph centrality, and Katz centrality. The purpose or objective of analysis generally determines the type of centrality measure to be used. For example, if one is interested in dynamics on networks or the robustness of a network to node/link removal, often the dynamical importance [36] of a node is the most relevant centrality measure.

Assortative and disassortative mixing

These concepts are used to characterize the linking preferences of hubs in a network. Hubs are nodes which have a large number of links. Some hubs tend to link to other hubs while others avoid connecting to hubs and prefer to connect to nodes with low connectivity. We say a hub is assortative when it tends to connect to other hubs. A disassortative hub avoids connecting to other hubs. If hubs have connections with the expected random probabilities, they are said to be neutral. There are three methods to quantify degree correlations. [37]

Recurrence networks

The recurrence matrix of a recurrence plot can be considered as the adjacency matrix of an undirected and unweighted network. This allows for the analysis of time series by network measures. Applications range from detection of regime changes over characterizing dynamics to synchronization analysis. [38] [39] [40]

Spatial networks

Many real networks are embedded in space. Examples include, transportation and other infrastructure networks, brain neural networks. Several models for spatial networks have been developed. [41]

Spread

Content in a complex network can spread via two major methods: conserved spread and non-conserved spread. [42] In conserved spread, the total amount of content that enters a complex network remains constant as it passes through. The model of conserved spread can best be represented by a pitcher containing a fixed amount of water being poured into a series of funnels connected by tubes. Here, the pitcher represents the original source and the water is the content being spread. The funnels and connecting tubing represent the nodes and the connections between nodes, respectively. As the water passes from one funnel into another, the water disappears instantly from the funnel that was previously exposed to the water. In non-conserved spread, the amount of content changes as it enters and passes through a complex network. The model of non-conserved spread can best be represented by a continuously running faucet running through a series of funnels connected by tubes. Here, the amount of water from the original source is infinite. Also, any funnels that have been exposed to the water continue to experience the water even as it passes into successive funnels. The non-conserved model is the most suitable for explaining the transmission of most infectious diseases, neural excitation, information and rumors, etc.

Network immunization

The question of how to immunize efficiently scale free networks which represent realistic networks such as the Internet and social networks has been studied extensively. One such strategy is to immunize the largest degree nodes, i.e., targeted (intentional) attacks [43] since for this case is relatively high and fewer nodes are needed to be immunized. However, in most realistic networks the global structure is not available and the largest degree nodes are unknown.

See also

Related Research Articles

<span class="mw-page-title-main">Scale-free network</span> Network whose degree distribution follows a power law

A scale-free network is a network whose degree distribution follows a power law, at least asymptotically. That is, the fraction P(k) of nodes in the network having k connections to other nodes goes for large values of k as

<span class="mw-page-title-main">Social network analysis</span> Analysis of social structures using network and graph theory

Social network analysis (SNA) is the process of investigating social structures through the use of networks and graph theory. It characterizes networked structures in terms of nodes and the ties, edges, or links that connect them. Examples of social structures commonly visualized through social network analysis include social media networks, meme spread, information circulation, friendship and acquaintance networks, peer learner networks, business networks, knowledge networks, difficult working relationships, collaboration graphs, kinship, disease transmission, and sexual relationships. These networks are often visualized through sociograms in which nodes are represented as points and ties are represented as lines. These visualizations provide a means of qualitatively assessing networks by varying the visual representation of their nodes and edges to reflect attributes of interest.

<span class="mw-page-title-main">Small-world network</span> Graph where most nodes are reachable in a small number of steps

A small-world network is a graph characterized by a high clustering coefficient and low distances. On an example of social network, high clustering implies the high probability that two friends of one person are friends themselves. The low distances, on the other hand, mean that there is a short chain of social connections between any two people. Specifically, a small-world network is defined to be a network where the typical distance L between two randomly chosen nodes grows proportionally to the logarithm of the number of nodes N in the network, that is:

<span class="mw-page-title-main">Centrality</span> Degree of connectedness within a graph

In graph theory and network analysis, indicators of centrality assign numbers or rankings to nodes within a graph corresponding to their network position. Applications include identifying the most influential person(s) in a social network, key infrastructure nodes in the Internet or urban networks, super-spreaders of disease, and brain networks. Centrality concepts were first developed in social network analysis, and many of the terms used to measure centrality reflect their sociological origin.

<span class="mw-page-title-main">Complex network</span> Network with non-trivial topological features

In the context of network theory, a complex network is a graph (network) with non-trivial topological features—features that do not occur in simple networks such as lattices or random graphs but often occur in networks representing real systems. The study of complex networks is a young and active area of scientific research inspired largely by empirical findings of real-world networks such as computer networks, biological networks, technological networks, brain networks, climate networks and social networks.

In the study of complex networks, assortative mixing, or assortativity, is a bias in favor of connections between network nodes with similar characteristics. In the specific case of social networks, assortative mixing is also known as homophily. The rarer disassortative mixing is a bias in favor of connections between dissimilar nodes.

<span class="mw-page-title-main">Community structure</span> Concept in graph theory

In the study of complex networks, a network is said to have community structure if the nodes of the network can be easily grouped into sets of nodes such that each set of nodes is densely connected internally. In the particular case of non-overlapping community finding, this implies that the network divides naturally into groups of nodes with dense connections internally and sparser connections between groups. But overlapping communities are also allowed. The more general definition is based on the principle that pairs of nodes are more likely to be connected if they are both members of the same community(ies), and less likely to be connected if they do not share communities. A related but different problem is community search, where the goal is to find a community that a certain vertex belongs to.

<span class="mw-page-title-main">Biological network inference</span>

Biological network inference is the process of making inferences and predictions about biological networks. By using these networks to analyze patterns in biological systems, such as food-webs, we can visualize the nature and strength of these interactions between species, DNA, proteins, and more.

<span class="mw-page-title-main">Network science</span> Academic field

Network science is an academic field which studies complex networks such as telecommunication networks, computer networks, biological networks, cognitive and semantic networks, and social networks, considering distinct elements or actors represented by nodes and the connections between the elements or actors as links. The field draws on theories and methods including graph theory from mathematics, statistical mechanics from physics, data mining and information visualization from computer science, inferential modeling from statistics, and social structure from sociology. The United States National Research Council defines network science as "the study of network representations of physical, biological, and social phenomena leading to predictive models of these phenomena."

<span class="mw-page-title-main">Closeness centrality</span>

In a connected graph, closeness centrality of a node is a measure of centrality in a network, calculated as the reciprocal of the sum of the length of the shortest paths between the node and all other nodes in the graph. Thus, the more central a node is, the closer it is to all other nodes.

<span class="mw-page-title-main">Biological network</span> Method of representing systems

A biological network is a method of representing systems as complex sets of binary interactions or relations between various biological entities. In general, networks or graphs are used to capture relationships between entities or objects. A typical graphing representation consists of a set of nodes connected by edges.

<span class="mw-page-title-main">Weighted network</span> Network where the ties among nodes have weights assigned to them

A weighted network is a network where the ties among nodes have weights assigned to them. A network is a system whose elements are somehow connected. The elements of a system are represented as nodes and the connections among interacting elements are known as ties, edges, arcs, or links. The nodes might be neurons, individuals, groups, organisations, airports, or even countries, whereas ties can take the form of friendship, communication, collaboration, alliance, flow, or trade, to name a few.

The clique percolation method is a popular approach for analyzing the overlapping community structure of networks. The term network community has no widely accepted unique definition and it is usually defined as a group of nodes that are more densely connected to each other than to other nodes in the network. There are numerous alternative methods for detecting communities in networks, for example, the Girvan–Newman algorithm, hierarchical clustering and modularity maximization.

<span class="mw-page-title-main">Betweenness centrality</span> Measure of a graphs centrality, based on shortest paths

In graph theory, betweenness centrality is a measure of centrality in a graph based on shortest paths. For every pair of vertices in a connected graph, there exists at least one shortest path between the vertices such that either the number of edges that the path passes through or the sum of the weights of the edges is minimized. The betweenness centrality for each vertex is the number of these shortest paths that pass through the vertex.

In graph theory and network analysis, node influence metrics are measures that rank or quantify the influence of every node within a graph. They are related to centrality indices. Applications include measuring the influence of each person in a social network, understanding the role of infrastructure nodes in transportation networks, the Internet, or urban networks, and the participation of a given node in disease dynamics.

<span class="mw-page-title-main">Multidimensional network</span> Networks with multiple kinds of relations

In network theory, multidimensional networks, a special type of multilayer network, are networks with multiple kinds of relations. Increasingly sophisticated attempts to model real-world systems as multidimensional networks have yielded valuable insight in the fields of social network analysis, economics, urban and international transport, ecology, psychology, medicine, biology, commerce, climatology, physics, computational neuroscience, operations management, and finance.

<span class="mw-page-title-main">Temporal network</span> Network whose links change over time

A temporal network, also known as a time-varying network, is a network whose links are active only at certain points in time. Each link carries information on when it is active, along with other possible characteristics such as a weight. Time-varying networks are of particular relevance to spreading processes, like the spread of information and disease, since each link is a contact opportunity and the time ordering of contacts is included.

Robustness, the ability to withstand failures and perturbations, is a critical attribute of many complex systems including complex networks.

<span class="mw-page-title-main">Biased random walk on a graph</span> Structural analysis of a network

In network science, a biased random walk on a graph is a time path process in which an evolving variable jumps from its current state to one of various potential new states; unlike in a pure random walk, the probabilities of the potential new states are unequal.

An air transport network or air transportation network is a transport network focused on air routes. Airports serve as the nodes of the network with air routes providing links between them. Air transport networks can be defined worldwide as well as for one region or for one airline company; the scale of the network can be global or domestic.

References

  1. 1 2 Borchers A, Pieler T (November 2010). "Programming pluripotent precursor cells derived from Xenopus embryos to generate specific tissues and organs". Genes. 1 (3): 413–426. doi: 10.3390/en11061381 . PMC   3966229 . PMID   24710095.
  2. 1 2 Saleh, Mahmoud; Esa, Yusef; Onuorah, Nwabueze; Mohamed, Ahmed A. (2017). "Optimal microgrids placement in electric distribution systems using complex network framework". Optimal microgrids placement in electric distribution systems using complex network framework - IEEE Conference Publication. ieeexplore.ieee.org. pp. 1036–1040. doi:10.1109/ICRERA.2017.8191215. ISBN   978-1-5386-2095-3. S2CID   44685630 . Retrieved 2018-06-07.
  3. Habibi I, Emamian ES, Abdi A (August 2014). "Quantitative analysis of intracellular communication and signaling errors in signaling networks". BMC Systems Biology. 8: 89. doi: 10.1186/s12918-014-0089-z . PMC   4255782 . PMID   25115405.
  4. Sindbæk S (2007). Networks and nodal points: the emergence of towns in early Viking Age Scandinavia - Antiquity 81(311). Cambridge University Press. pp. 119–132.
  5. Paradowski, M. B.; Jarynowski, A.; Jelińska, M.; Czopek, K. (2021). "Selected poster presentations from the American Association of Applied Linguistics conference, Denver, USA, March 2020: Out-of-class peer interactions matter for second language acquisition during short-term overseas sojourns: The contributions of Social Network Analysis". Language Teaching. 54 (1): 139–143. doi: 10.1017/S0261444820000580 .
  6. Paradowski, M. B.; Jarynowski, A.; Czopek, K.; Jelińska, M.; et al. (2021). "Peer interactions and second language learning: The contributions of Social Network Analysis in Study Abroad vs At-Home environments". In Mitchell, Rosamond; Tyne, Henry (eds.). Language, Mobility and Study Abroad in the Contemporary European Context. New York: Routledge. pp. 99–116. doi:10.1017/S0261444820000580. ISBN   978-10-03087-95-3. S2CID   228863564.
  7. Paradowski, M. B.; Cierpich-Kozieł, A.; Chen, C.-C.; Ochab, J. K. (2022). "How output outweighs input and interlocutors matter for study-abroad SLA: Computational Social Network Analysis of learner interactions". The Modern Language Journal. 106 (4): 694–725. doi:10.1111/modl.12811. S2CID   255247273.
  8. Harris JK, Luke DA, Zuckerman RB, Shelton SC (June 2009). "Forty years of secondhand smoke research: the gap between discovery and delivery". American Journal of Preventive Medicine. 36 (6): 538–548. doi:10.1016/j.amepre.2009.01.039. OCLC   5899755895. PMID   19372026.
  9. Varda DM, Forgette R, Banks D, Contractor N (2009). "Social Network Methodology in the Study of Disasters: Issues and Insights Prompted by Post-Katrina Research". Population Research and Policy Review. 28 (1): 11–29. doi:10.1007/s11113-008-9110-9. ISSN   0167-5923. OCLC   5659930640. S2CID   144130904.
  10. Sunkersing D, Martin FC, Sullivan P, Bell D (December 2022). "Care and support networks of community-dwelling frail individuals in North West London: a comparison of patient and healthcare workers' perceptions". BMC Geriatrics. 22 (1): 953. doi: 10.1186/s12877-022-03561-y . PMC   9737751 . PMID   36494627.
  11. della Porta D, Diani M (2010). Social Movements 2e: An Introduction (2nd ed.). Wiley-Blackwell. ISBN   978-1-4051-0282-7.
  12. Paradowski, M. B.; Jelińska, M. (2023). "The predictors of L2 grit and their complex interactions in online foreign language learning: Motivation, self-directed learning, autonomy, curiosity, and language mindsets". Computer Assisted Language Learning : 1–38. doi: 10.1080/09588221.2023.2192762 .
  13. Bassett DS, Sporns O (February 2017). "Network neuroscience". Nature Neuroscience. 20 (3): 353–364. doi:10.1038/nn.4502. PMC   5485642 . PMID   28230844.
  14. Alex Fornito. "An Introduction to Network Neuroscience: How to build, model, and analyse connectomes - 0800-10:00 | OHBM". pathlms.com. Retrieved 2020-03-11.
  15. Saberi M, Khosrowabadi R, Khatibi A, Misic B, Jafari G (January 2021). "Topological impact of negative links on the stability of resting-state brain network". Scientific Reports. 11 (1): 2176. Bibcode:2021NatSR..11.2176S. doi:10.1038/s41598-021-81767-7. PMC   7838299 . PMID   33500525.
  16. Grandjean M (2014). "La connaissance est un réseau". Les Cahiers du Numérique. 10 (3): 37–54. doi:10.3166/lcn.10.3.37-54 . Retrieved 2014-10-15.
  17. Wasserman, Stanley and Katherine Faust. 1994. Social Network Analysis: Methods and Applications. Cambridge: Cambridge University Press. Rainie, Lee and Barry Wellman, Networked: The New Social Operating System. Cambridge, MA: MIT Press, 2012.
  18. Newman, M.E.J. Networks: An Introduction. Oxford University Press. 2010
  19. Al-Taie MZ, Kadry S (2017). "Information Diffusion in Social Networks". Python for Graph and Network Analysis. Advanced Information and Knowledge Processing. pp. 165–184. doi:10.1007/978-3-319-53004-8_8. ISBN   978-3-319-53003-1. PMC   7123536 .
  20. Luke DA, Harris JK (April 2007). "Network analysis in public health: history, methods, and applications". Annual Review of Public Health. 28 (1): 69–93. doi: 10.1146/annurev.publhealth.28.021406.144132 . PMID   17222078.
  21. Odabaş M, Holt TJ, Breiger RL (October 2017). "Markets as Governance Environments for Organizations at the Edge of Illegality: Insights From Social Network Analysis". American Behavioral Scientist. 61 (11): 1267–1288. doi:10.1177/0002764217734266. hdl: 10150/631238 . S2CID   158776581.
  22. Larson JM (11 May 2021). "Networks of Conflict and Cooperation". Annual Review of Political Science. 24 (1): 89–107. doi: 10.1146/annurev-polisci-041719-102523 .
  23. Leng RI (24 May 2018). "A network analysis of the propagation of evidence regarding the effectiveness of fat-controlled diets in the secondary prevention of coronary heart disease (CHD): Selective citation in reviews". PLOS ONE. 13 (5): e0197716. Bibcode:2018PLoSO..1397716L. doi: 10.1371/journal.pone.0197716 . PMC   5968408 . PMID   29795624.
  24. Burris V (April 2004). "The Academic Caste System: Prestige Hierarchies in PhD Exchange Networks". American Sociological Review. 69 (2): 239–264. doi:10.1177/000312240406900205. S2CID   143724478 . Retrieved 22 September 2021.
  25. Roberts N, Everton SF. "Strategies for Combating Dark Networks" (PDF). Journal of Social Structure. 12. Retrieved 22 September 2021.
  26. Habibi I, Emamian ES, Abdi A (2014-10-07). "Advanced fault diagnosis methods in molecular networks". PLOS ONE. 9 (10): e108830. Bibcode:2014PLoSO...9j8830H. doi: 10.1371/journal.pone.0108830 . PMC   4188586 . PMID   25290670.
  27. Barabási AL, Gulbahce N, Loscalzo J (January 2011). "Network medicine: a network-based approach to human disease". Nature Reviews. Genetics. 12 (1): 56–68. doi:10.1038/nrg2918. PMC   3140052 . PMID   21164525.
  28. Jailkhani N, Ravichandran S, Hegde SR, Siddiqui Z, Mande SC, Rao KV (December 2011). "Delineation of key regulatory elements identifies points of vulnerability in the mitogen-activated signaling network". Genome Research. 21 (12): 2067–2081. doi:10.1101/gr.116145.110. PMC   3227097 . PMID   21865350.
  29. Jackson MD, Duran-Nebreda S, Bassel GW (October 2017). "Network-based approaches to quantify multicellular development". Journal of the Royal Society, Interface. 14 (135): 20170484. doi:10.1098/rsif.2017.0484. PMC   5665831 . PMID   29021161.
  30. 1 2 Automated analysis of the US presidential elections using Big Data and network analysis; S Sudhahar, GA Veltri, N Cristianini; Big Data & Society 2 (1), 1–28, 2015
  31. Network analysis of narrative content in large corpora; S Sudhahar, G De Fazio, R Franzosi, N Cristianini; Natural Language Engineering, 1–32, 2013
  32. Quantitative Narrative Analysis; Roberto Franzosi; Emory University © 2010
  33. Tsonis AA, Swanson KL, Roebber PJ (2006). "What Do Networks Have to Do with Climate?". Bulletin of the American Meteorological Society. 87 (5): 585–595. Bibcode:2006BAMS...87..585T. doi: 10.1175/BAMS-87-5-585 . ISSN   0003-0007.
  34. Boers N, Bookhagen B, Barbosa HM, Marwan N, Kurths J, Marengo JA (October 2014). "Prediction of extreme floods in the eastern Central Andes based on a complex networks approach". Nature Communications. 5: 5199. Bibcode:2014NatCo...5.5199B. doi: 10.1038/ncomms6199 . PMID   25310906. S2CID   3032237.
  35. Attardi G, Di Marco S, Salvi D (1998). "Categorization by Context" (PDF). Journal of Universal Computer Science . 4 (9): 719–736.
  36. Restrepo JG, Ott E, Hunt BR (September 2006). "Characterizing the dynamical importance of network nodes and links". Physical Review Letters. 97 (9): 094102. arXiv: cond-mat/0606122 . Bibcode:2006PhRvL..97i4102R. doi:10.1103/PhysRevLett.97.094102. PMID   17026366. S2CID   18365246.
  37. M. E. J. Newman (2003). "Mixing patterns in networks". Physical Review E. 67 (2): 026126. arXiv:cond-mat/0209450. Bibcode:2003PhRvE..67b6126N. doi:10.1103/PhysRevE.67.026126. PMID 12636767. S2CID 15186389.
  38. Marwan N, Donges JF, Zou Y, Donner RV, Kurths J (2009). "Complex network approach for recurrence analysis of time series". Physics Letters A. 373 (46): 4246–4254. arXiv: 0907.3368 . Bibcode:2009PhLA..373.4246M. doi:10.1016/j.physleta.2009.09.042. ISSN   0375-9601. S2CID   7761398.
  39. Donner RV, Heitzig J, Donges JF, Zou Y, Marwan N, Kurths J (2011). "The Geometry of Chaotic Dynamics – A Complex Network Perspective". European Physical Journal B. 84 (4): 653–672. arXiv: 1102.1853 . Bibcode:2011EPJB...84..653D. doi:10.1140/epjb/e2011-10899-1. ISSN   1434-6036. S2CID   18979395.
  40. Feldhoff JH, Donner RV, Donges JF, Marwan N, Kurths J (2013). "Geometric signature of complex synchronisation scenarios". Europhysics Letters. 102 (3): 30007. arXiv: 1301.0806 . Bibcode:2013EL....10230007F. doi:10.1209/0295-5075/102/30007. ISSN   1286-4854. S2CID   119118006.
  41. Waxman BM (1988). "Routing of multipoint connections". IEEE Journal on Selected Areas in Communications. 6 (9): 1617–1622. doi:10.1109/49.12889.
  42. Newman M, Barabási AL, Watts DJ, eds. (2006). The Structure and Dynamics of Networks. Princeton, N.J.: Princeton University Press.
  43. Callaway DS, Newman ME, Strogatz SH, Watts DJ (December 2000). "Network robustness and fragility: percolation on random graphs". Physical Review Letters. 85 (25): 5468–5471. arXiv: cond-mat/0007300 . Bibcode:2000PhRvL..85.5468C. doi:10.1103/PhysRevLett.85.5468. PMID   11136023. S2CID   2325768.

Books