In graph theory, a random geometric graph (RGG) is the mathematically simplest spatial network, namely an undirected graph constructed by randomly placing Nnodes in some metric space (according to a specified probability distribution) and connecting two nodes by a link if and only if their distance is in a given range, e.g. smaller than a certain neighborhood radius, r.
Random geometric graphs resemble real human social networks in a number of ways. For instance, they spontaneously demonstrate community structure - clusters of nodes with high modularity. Other random graph generation algorithms, such as those generated using the Erdős–Rényi model or Barabási–Albert (BA) model do not create this type of structure. Additionally, random geometric graphs display degree assortativity according to their spatial dimension:[1] "popular" nodes (those with many links) are particularly likely to be linked to other popular nodes.
Percolation theory on the random geometric graph (the study of its global connectivity) is sometimes called the Gilbert disk model[2] after the work of Edgar Gilbert, who introduced these graphs and percolation in them in a 1961 paper.[3] A real-world application of RGGs is the modeling of ad hoc networks.[4] Furthermore they are used to perform benchmarks for graph algorithms.
Definition
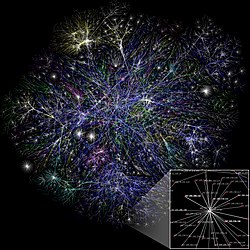
The generation of a random geometric graph for different connectivity parameters r.
In the following, let G = (V, E) denote an undirected Graph with a set of vertices V and a set of edges E ⊆ V × V. The set sizes are denoted by |V| = n and |E| = m. Additionally, if not noted otherwise, the metric space[0,1)d with the euclidean distance is considered, i.e. for any points the euclidean distance of x and y is defined as
.
A random geometric graph (RGG) is an undirected geometric graph with nodes randomly sampled from the uniform distribution of the underlying space [0,1)d.[5] Two vertices p, q ∈ V are connected if, and only if, their distance is less than a previously specified parameter r ∈ (0,1), excluding any loops. Thus, the parameters r and n fully characterize a RGG.
Algorithms
Naive algorithm
The naive approach is to calculate the distance of every vertex to every other vertex. As there are possible connections that are checked, the time complexity of the naive algorithm is . The samples are generated by using a random number generator (RNG) on . Practically, one can implement this using d random number generators on , one RNG for every dimension.
Pseudocode
V := generateSamples(n) // Generates n samples in the unit cube.for eachp ∈ Vdofor eachq ∈ V\{p} doif distance(p, q) ≤ rthen addConnection(p, q) // Add the edge (p, q) to the edge data structure.end ifend forend for
As this algorithm is not scalable (every vertex needs information of every other vertex), Holtgrewe et al. and Funke et al. have introduced new algorithms for this problem.
Distributed algorithms
Holtgrewe et al.
This algorithm, which was proposed by Holtgrewe et al., was the first distributed RGG generator algorithm for dimension 2.[6] It partitions the unit square into equal sized cells with side length of at least . For a given number of processors, each processor is assigned cells, where For simplicity, is assumed to be a square number, but this can be generalized to any number of processors. Each processor then generates vertices, which are then distributed to their respective owners. Then the vertices are sorted by the cell number they fall into, for example with Quicksort. Next, each processor then sends their adjacent processors the information about the vertices in the border cells, such that each processing unit can calculate the edges in their partition independent of the other units. The expected running time is . An upper bound for the communication cost of this algorithm is given by , where denotes the time for an all-to-all communication with messages of length l bits to c communication partners. is the time taken for a point-to-point communication for a message of length l bits.
Since this algorithm is not communication free, Funke et al. proposed[6] a scalable distributed RGG generator for higher dimensions, which works without any communication between the processing units.
Funke et al.
The approach used in this algorithm[6] is similar to the approach in Holtgrewe: Partition the unit cube into equal sized chunks with side length of at least r. So in d = 2 this will be squares, in d = 3 this will be cubes. As there can only fit at most chunks per dimension, the number of chunks is capped at . As before, each processor is assigned chunks, for which it generates the vertices. To achieve a communication free process, each processor then generates the same vertices in the adjacent chunks by exploiting pseudorandomization of seededhash functions. This way, each processor calculates the same vertices and there is no need for exchanging vertex information.
For dimension 3, Funke et al. showed that the expected running time is , without any cost for communication between processing units.
Properties
Isolated vertices and connectivity
In the special case that , the probability that a single vertex is isolated in a RGG is .[7] Let be the random variable counting how many vertices are isolated. Then the expected value of is . The term provides information about the connectivity of the RGG. For , the RGG is asymptotically almost surely connected. For , the RGG is asymptotically almost surely disconnected. And for , the RGG has a giant component that covers more than vertices and is Poisson distributed with parameter . It follows that if , the probability that the RGG is connected is and the probability that the RGG is not connected is .
For any -Norm ( ) and for any number of dimensions , a RGG possesses a sharp threshold of connectivity at with constant . In the special case of a two-dimensional space and the euclidean norm ( and ) this yields .
Hamiltonicity
It has been shown, that in the two-dimensional case, the threshold also provides information about the existence of a Hamiltonian cycle (Hamiltonian Path).[8] For any , if , then the RGG has asymptotically almost surely no Hamiltonian cycle and if for any , then the RGG has asymptotically almost surely a Hamiltonian cycle.
Clustering coefficient
The clustering coefficient of RGGs only depends on the dimension d of the underlying space [0,1)d. The clustering coefficient is [9]
for even and for odd whereFor large , this simplifies to .
Generalized random geometric graphs
In 1988, Bernard Waxman[10] generalised the standard RGG by introducing a probabilistic connection function as opposed to the deterministic one suggested by Gilbert. The example introduced by Waxman was a stretched exponential where two nodes and connect with probability given by where is the euclidean separation and , are parameters determined by the system. This type of RGG with probabilistic connection function is often referred to a soft random geometric Graph, which now has two sources of randomness; the location of nodes (vertices) and the formation of links (edges). This connection function has been generalized further in the literature which is often used to study wireless networks without interference. The parameter represents how the signal decays with distance, when is free space, models a more cluttered environment like a town (= 6 models cities like New York) whilst models highly reflective environments. We notice that for is the Waxman model, whilst as and we have the standard RGG. Intuitively these types of connection functions model how the probability of a link being made decays with distance.
Overview of some results for Soft RGG
In the high density limit for a network with exponential connection function the number of isolated nodes is Poisson distributed, and the resulting network contains a unique giant component and isolated nodes only.[11] Therefore by ensuring there are no isolated nodes, in the dense regime, the network is a.a.s fully connected; similar to the results shown in [12] for the disk model. Often the properties of these networks such as betweenness centrality [13] and connectivity [11] are studied in the limit as the density which often means border effects become negligible. However, in real life where networks are finite, although can still be extremely dense, border effects will impact on full connectivity; in fact [14] showed that for full connectivity, with an exponential connection function, is greatly impacted by boundary effects as nodes near the corner/face of a domain are less likely to connect compared with those in the bulk. As a result full connectivity can be expressed as a sum of the contributions from the bulk and the geometries boundaries. A more general analysis of the connection functions in wireless networks has shown that the probability of full connectivity can be well approximated expressed by a few moments of the connection function and the regions geometry.[15]
↑ Bobrowski, Omer; Kahle, Matthew (2018). "Topology of random geometric complexes: a survey". Journal of Applied and Computational Topology. 1 (3–4): 331–364. arXiv:1409.4734. doi:10.1007/s41468-017-0010-0. MR3975557.
↑ Gilbert, Edgar N (1961). "Random Plane Networks". Journal of the Society for Industrial and Applied Mathematics. 9 (4): 533–543. doi:10.1137/0109045.
↑ Waxman, Bernard M (1988). "Routing of multipoint connections". IEEE Journal on Selected Areas in Communications. 6 (9): 1617–1622. doi:10.1109/49.12889.
This page is based on this Wikipedia article Text is available under the CC BY-SA 4.0 license; additional terms may apply. Images, videos and audio are available under their respective licenses.