In probability theory and statistics, the exponential distribution or negative exponential distribution is the probability distribution of the distance between events in a Poisson point process, i.e., a process in which events occur continuously and independently at a constant average rate; the distance parameter could be any meaningful mono-dimensional measure of the process, such as time between production errors, or length along a roll of fabric in the weaving manufacturing process. It is a particular case of the gamma distribution. It is the continuous analogue of the geometric distribution, and it has the key property of being memoryless. In addition to being used for the analysis of Poisson point processes it is found in various other contexts.
Distributions, also known as Schwartz distributions or generalized functions, are objects that generalize the classical notion of functions in mathematical analysis. Distributions make it possible to differentiate functions whose derivatives do not exist in the classical sense. In particular, any locally integrable function has a distributional derivative.
In statistics, maximum likelihood estimation (MLE) is a method of estimating the parameters of an assumed probability distribution, given some observed data. This is achieved by maximizing a likelihood function so that, under the assumed statistical model, the observed data is most probable. The point in the parameter space that maximizes the likelihood function is called the maximum likelihood estimate. The logic of maximum likelihood is both intuitive and flexible, and as such the method has become a dominant means of statistical inference.

In probability theory and statistics, the beta distribution is a family of continuous probability distributions defined on the interval [0, 1] or in terms of two positive parameters, denoted by alpha (α) and beta (β), that appear as exponents of the variable and its complement to 1, respectively, and control the shape of the distribution.
In statistics and information theory, a maximum entropy probability distribution has entropy that is at least as great as that of all other members of a specified class of probability distributions. According to the principle of maximum entropy, if nothing is known about a distribution except that it belongs to a certain class, then the distribution with the largest entropy should be chosen as the least-informative default. The motivation is twofold: first, maximizing entropy minimizes the amount of prior information built into the distribution; second, many physical systems tend to move towards maximal entropy configurations over time.
In mathematics, in particular in algebraic geometry and differential geometry, Dolbeault cohomology (named after Pierre Dolbeault) is an analog of de Rham cohomology for complex manifolds. Let M be a complex manifold. Then the Dolbeault cohomology groups depend on a pair of integers p and q and are realized as a subquotient of the space of complex differential forms of degree (p,q).
In quantum computing, quantum finite automata (QFA) or quantum state machines are a quantum analog of probabilistic automata or a Markov decision process. They provide a mathematical abstraction of real-world quantum computers. Several types of automata may be defined, including measure-once and measure-many automata. Quantum finite automata can also be understood as the quantization of subshifts of finite type, or as a quantization of Markov chains. QFAs are, in turn, special cases of geometric finite automata or topological finite automata.
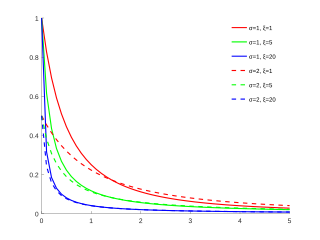
In statistics, the generalized Pareto distribution (GPD) is a family of continuous probability distributions. It is often used to model the tails of another distribution. It is specified by three parameters: location , scale , and shape . Sometimes it is specified by only scale and shape and sometimes only by its shape parameter. Some references give the shape parameter as .

In the context of quantum mechanics and quantum information theory, symmetric, informationally complete, positive operator-valued measures (SIC-POVMs) are a particular type of generalized measurement (POVM). SIC-POVMs are particularly notable thanks to their defining features of (1) being informationally complete; (2)having the minimal number of outcomes compatible with informational completeness, and (3) being highly symmetric. In this context, informational completeness is the property of a POVM of allowing to fully reconstruct input states from measurement data.
The exponential mechanism is a technique for designing differentially private algorithms. It was developed by Frank McSherry and Kunal Talwar in 2007. Their work was recognized as a co-winner of the 2009 PET Award for Outstanding Research in Privacy Enhancing Technologies.
In cryptography, learning with errors (LWE) is a mathematical problem that is widely used to create secure encryption algorithms. It is based on the idea of representing secret information as a set of equations with errors. In other words, LWE is a way to hide the value of a secret by introducing noise to it. In more technical terms, it refers to the computational problem of inferring a linear -ary function over a finite ring from given samples some of which may be erroneous. The LWE problem is conjectured to be hard to solve, and thus to be useful in cryptography.

In probability theory, a logit-normal distribution is a probability distribution of a random variable whose logit has a normal distribution. If Y is a random variable with a normal distribution, and t is the standard logistic function, then X = t(Y) has a logit-normal distribution; likewise, if X is logit-normally distributed, then Y = logit(X)= log (X/(1-X)) is normally distributed. It is also known as the logistic normal distribution, which often refers to a multinomial logit version (e.g.).
The entropy of entanglement is a measure of the degree of quantum entanglement between two subsystems constituting a two-part composite quantum system. Given a pure bipartite quantum state of the composite system, it is possible to obtain a reduced density matrix describing knowledge of the state of a subsystem. The entropy of entanglement is the Von Neumann entropy of the reduced density matrix for any of the subsystems. If it is non-zero, i.e. the subsystem is in a mixed state, it indicates the two subsystems are entangled.
In financial mathematics and stochastic optimization, the concept of risk measure is used to quantify the risk involved in a random outcome or risk position. Many risk measures have hitherto been proposed, each having certain characteristics. The entropic value at risk (EVaR) is a coherent risk measure introduced by Ahmadi-Javid, which is an upper bound for the value at risk (VaR) and the conditional value at risk (CVaR), obtained from the Chernoff inequality. The EVaR can also be represented by using the concept of relative entropy. Because of its connection with the VaR and the relative entropy, this risk measure is called "entropic value at risk". The EVaR was developed to tackle some computational inefficiencies of the CVaR. Getting inspiration from the dual representation of the EVaR, Ahmadi-Javid developed a wide class of coherent risk measures, called g-entropic risk measures. Both the CVaR and the EVaR are members of this class.
In machine learning, the kernel embedding of distributions comprises a class of nonparametric methods in which a probability distribution is represented as an element of a reproducing kernel Hilbert space (RKHS). A generalization of the individual data-point feature mapping done in classical kernel methods, the embedding of distributions into infinite-dimensional feature spaces can preserve all of the statistical features of arbitrary distributions, while allowing one to compare and manipulate distributions using Hilbert space operations such as inner products, distances, projections, linear transformations, and spectral analysis. This learning framework is very general and can be applied to distributions over any space on which a sensible kernel function may be defined. For example, various kernels have been proposed for learning from data which are: vectors in , discrete classes/categories, strings, graphs/networks, images, time series, manifolds, dynamical systems, and other structured objects. The theory behind kernel embeddings of distributions has been primarily developed by Alex Smola, Le Song , Arthur Gretton, and Bernhard Schölkopf. A review of recent works on kernel embedding of distributions can be found in.
Attempts have been made to describe gauge theories in terms of extended objects such as Wilson loops and holonomies. The loop representation is a quantum hamiltonian representation of gauge theories in terms of loops. The aim of the loop representation in the context of Yang–Mills theories is to avoid the redundancy introduced by Gauss gauge symmetries allowing to work directly in the space of physical states. The idea is well known in the context of lattice Yang–Mills theory. Attempts to explore the continuous loop representation was made by Gambini and Trias for canonical Yang–Mills theory, however there were difficulties as they represented singular objects. As we shall see the loop formalism goes far beyond a simple gauge invariant description, in fact it is the natural geometrical framework to treat gauge theories and quantum gravity in terms of their fundamental physical excitations.
Maximal entropy random walk (MERW) is a popular type of biased random walk on a graph, in which transition probabilities are chosen accordingly to the principle of maximum entropy, which says that the probability distribution which best represents the current state of knowledge is the one with largest entropy. While standard random walk chooses for every vertex uniform probability distribution among its outgoing edges, locally maximizing entropy rate, MERW maximizes it globally by assuming uniform probability distribution among all paths in a given graph.

Maximum-entropy random graph models are random graph models used to study complex networks subject to the principle of maximum entropy under a set of structural constraints, which may be global, distributional, or local.
A set of networks that satisfies given structural characteristics can be treated as a network ensemble. Brought up by Ginestra Bianconi in 2007, the entropy of a network ensemble measures the level of the order or uncertainty of a network ensemble.
Distributional data analysis is a branch of nonparametric statistics that is related to functional data analysis. It is concerned with random objects that are probability distributions, i.e., the statistical analysis of samples of random distributions where each atom of a sample is a distribution. One of the main challenges in distributional data analysis is that the space of probability distributions is, while a convex space, is not a vector space.