In mathematics, a Voronoi diagram is a partition of a plane into regions close to each of a given set of objects. In the simplest case, these objects are just finitely many points in the plane. For each seed there is a corresponding region, called a Voronoi cell, consisting of all points of the plane closer to that seed than to any other. The Voronoi diagram of a set of points is dual to that set's Delaunay triangulation.

A tessellation or tiling is the covering of a surface, often a plane, using one or more geometric shapes, called tiles, with no overlaps and no gaps. In mathematics, tessellation can be generalized to higher dimensions and a variety of geometries.

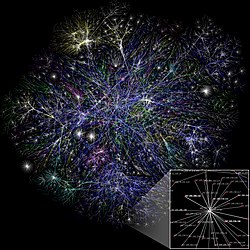
In mathematics, random graph is the general term to refer to probability distributions over graphs. Random graphs may be described simply by a probability distribution, or by a random process which generates them. The theory of random graphs lies at the intersection between graph theory and probability theory. From a mathematical perspective, random graphs are used to answer questions about the properties of typical graphs. Its practical applications are found in all areas in which complex networks need to be modeled – many random graph models are thus known, mirroring the diverse types of complex networks encountered in different areas. In a mathematical context, random graph refers almost exclusively to the Erdős–Rényi random graph model. In other contexts, any graph model may be referred to as a random graph.
Discrete geometry and combinatorial geometry are branches of geometry that study combinatorial properties and constructive methods of discrete geometric objects. Most questions in discrete geometry involve finite or discrete sets of basic geometric objects, such as points, lines, planes, circles, spheres, polygons, and so forth. The subject focuses on the combinatorial properties of these objects, such as how they intersect one another, or how they may be arranged to cover a larger object.
In statistics and probability theory, a point process or point field is a collection of mathematical points randomly located on a mathematical space such as the real line or Euclidean space. Point processes can be used for spatial data analysis, which is of interest in such diverse disciplines as forestry, plant ecology, epidemiology, geography, seismology, materials science, astronomy, telecommunications, computational neuroscience, economics and others.
Spatial network analysis software packages are analytic software used to prepare graph-based analysis of spatial networks. They stem from research fields in transportation, architecture, and urban planning. The earliest examples of such software include the work of Garrison (1962), Kansky (1963), Levin (1964), Harary (1969), Rittel (1967), Tabor (1970) and others in the 1960s and 70s. Specific packages address to suit their domain-specific needs, including TransCAD for transportation, GIS for planning and geography, and Axman for Space syntax researchers.

In the mathematical discipline of graph theory, the dual graph of a plane graph G is a graph that has a vertex for each face of G. The dual graph has an edge for each pair of faces in G that are separated from each other by an edge, and a self-loop when the same face appears on both sides of an edge. Thus, each edge e of G has a corresponding dual edge, whose endpoints are the dual vertices corresponding to the faces on either side of e. The definition of the dual depends on the choice of embedding of the graph G, so it is a property of plane graphs rather than planar graphs. For planar graphs generally, there may be multiple dual graphs, depending on the choice of planar embedding of the graph.
Geometric graph theory in the broader sense is a large and amorphous subfield of graph theory, concerned with graphs defined by geometric means. In a stricter sense, geometric graph theory studies combinatorial and geometric properties of geometric graphs, meaning graphs drawn in the Euclidean plane with possibly intersecting straight-line edges, and topological graphs, where the edges are allowed to be arbitrary continuous curves connecting the vertices, thus it is "the theory of geometric and topological graphs". Geometric graphs are also known as spatial networks.
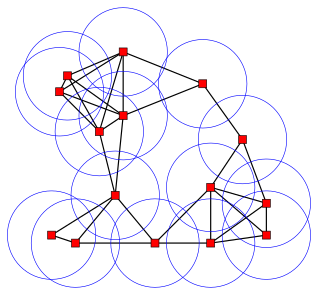
In geometric graph theory, a unit disk graph is the intersection graph of a family of unit disks in the Euclidean plane. That is, it is a graph with one vertex for each disk in the family, and with an edge between two vertices whenever the corresponding vertices lie within a unit distance of each other.
In mathematics, stochastic geometry is the study of random spatial patterns. At the heart of the subject lies the study of random point patterns. This leads to the theory of spatial point processes, hence notions of Palm conditioning, which extend to the more abstract setting of random measures.
A Euclidean graph is periodic if there exists a basis of that Euclidean space whose corresponding translations induce symmetries of that graph. Equivalently, a periodic Euclidean graph is a periodic realization of an abelian covering graph over a finite graph. A Euclidean graph is uniformly discrete if there is a minimal distance between any two vertices. Periodic graphs are closely related to tessellations of space and the geometry of their symmetry groups, hence to geometric group theory, as well as to discrete geometry and the theory of polytopes, and similar areas.
Edgar Nelson Gilbert was an American mathematician and coding theorist, a longtime researcher at Bell Laboratories whose accomplishments include the Gilbert–Varshamov bound in coding theory, the Gilbert–Elliott model of bursty errors in signal transmission, and the Erdős–Rényi model for random graphs.
Mathematics is a broad subject that is commonly divided in many areas that may be defined by their objects of study, by the used methods, or by both. For example, analytic number theory is a subarea of number theory devoted to the use of methods of analysis for the study of natural numbers.
In distributed computing and geometric graph theory, greedy embedding is a process of assigning coordinates to the nodes of a telecommunications network in order to allow greedy geographic routing to be used to route messages within the network. Although greedy embedding has been proposed for use in wireless sensor networks, in which the nodes already have positions in physical space, these existing positions may differ from the positions given to them by greedy embedding, which may in some cases be points in a virtual space of a higher dimension, or in a non-Euclidean geometry. In this sense, greedy embedding may be viewed as a form of graph drawing, in which an abstract graph is embedded into a geometric space.
In mathematics and probability theory, continuum percolation theory is a branch of mathematics that extends discrete percolation theory to continuous space. More specifically, the underlying points of discrete percolation form types of lattices whereas the underlying points of continuum percolation are often randomly positioned in some continuous space and form a type of point process. For each point, a random shape is frequently placed on it and the shapes overlap each with other to form clumps or components. As in discrete percolation, a common research focus of continuum percolation is studying the conditions of occurrence for infinite or giant components. Other shared concepts and analysis techniques exist in these two types of percolation theory as well as the study of random graphs and random geometric graphs.
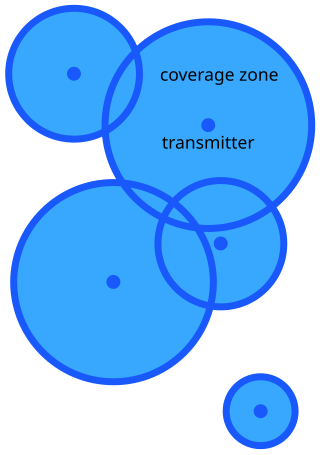
In mathematics and telecommunications, stochastic geometry models of wireless networks refer to mathematical models based on stochastic geometry that are designed to represent aspects of wireless networks. The related research consists of analyzing these models with the aim of better understanding wireless communication networks in order to predict and control various network performance metrics. The models require using techniques from stochastic geometry and related fields including point processes, spatial statistics, geometric probability, percolation theory, as well as methods from more general mathematical disciplines such as geometry, probability theory, stochastic processes, queueing theory, information theory, and Fourier analysis.

In probability, statistics and related fields, a Poisson point process is a type of random mathematical object that consists of points randomly located on a mathematical space with the essential feature that the points occur independently of one another. The Poisson point process is often called simply the Poisson process, but it is also called a Poisson random measure, Poisson random point field or Poisson point field. This point process has convenient mathematical properties, which has led to its being frequently defined in Euclidean space and used as a mathematical model for seemingly random processes in numerous disciplines such as astronomy, biology, ecology, geology, seismology, physics, economics, image processing, and telecommunications.
François Louis Baccelli is senior researcher at INRIA Paris, in charge of the ERC project NEMO on network mathematics.
Physicists often use various lattices to apply their favorite models in them. For instance, the most favorite lattice is perhaps the square lattice. There are 14 Bravais space lattice where every cell has exactly the same number of nearest, next nearest, nearest of next nearest etc. neighbors and hence they are called regular lattice. Often physicists and mathematicians study phenomena which require disordered lattice where each cell do not have exactly the same number of neighbors rather the number of neighbors can vary wildly. For instance, if one wants to study the spread of disease, viruses, rumors etc. then the last thing one would look for is the square lattice. In such cases a disordered lattice is necessary. One way of constructing a disordered lattice is by doing the following.