Dependency network

Last updated

The dependency network approach provides a system level analysis of the activity and topology of directed networks. The approach extracts causal topological relations between the network's nodes (when the network structure is analyzed), and provides an important step towards inference of causal activity relations between the network nodes (when analyzing the network activity). This methodology has originally been introduced for the study of financial data, [1] [2] it has been extended and applied to other systems, such as the immune system, [3] and semantic networks. [4]

Contents

In the case of network activity, the analysis is based on partial correlations. [5] [6] [7] [8] [9] In simple words, the partial (or residual) correlation is a measure of the effect (or contribution) of a given node, say j, on the correlations between another pair of nodes, say i and k. Using this concept, the dependency of one node on another node is calculated for the entire network. This results in a directed weighted adjacency matrix of a fully connected network. Once the adjacency matrix has been constructed, different algorithms can be used to construct the network, such as a threshold network, Minimal Spanning Tree (MST), Planar Maximally Filtered Graph (PMFG), and others.

Dependency network of financial data, for 300 of the S&P500 stocks, traded between 2001-2003. Stocks are grouped by economic sectors, and the arrow points in the direction of influence. The hub of the network, the most influencing sector, is the Financial sector. Reproduction from Kenett et al., PLoS ONE 5(12), e15032 (2010) Dependency network for financial data.jpg
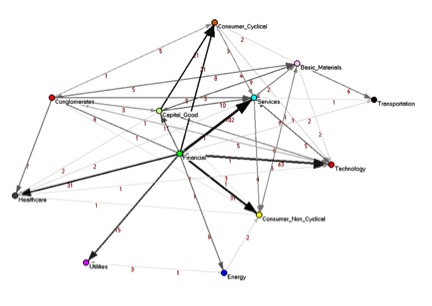
Dependency network of financial data, for 300 of the S&P500 stocks, traded between 2001–2003. Stocks are grouped by economic sectors, and the arrow points in the direction of influence. The hub of the network, the most influencing sector, is the Financial sector. Reproduction from Kenett et al., PLoS ONE 5(12), e15032 (2010)

Importance

The partial correlation based dependency network is a class of correlation network, capable of uncovering hidden relationships between its nodes.

This original methodology was first presented at the end of 2010, published in PLoS ONE. [1] The authors quantitatively uncovered hidden information about the underlying structure of the U.S. stock market, information that was not present in the standard correlation networks. One of the main results of this work is that for the investigated time period (2001–2003), the structure of the network was dominated by companies belonging to the financial sector, which are the hubs in the dependency network. Thus, they were able for the first time to quantitatively show the dependency relationships between the different economic sectors. Following this work, the dependency network methodology has been applied to the study of the immune system, [3] and semantic networks. [4]

Dependency Network of specific antibodies activity, measured for a group of mothers. Panel (a) presents the dependency network, and panel (b) the standard correlation network. Reproduction from Madi et al., Chaos 21, 016109 (2011) Dependency network for immune system data.jpg
Dependency Network of specific antibodies activity, measured for a group of mothers. Panel (a) presents the dependency network, and panel (b) the standard correlation network. Reproduction from Madi et al., Chaos 21, 016109 (2011)
Example of Dependency Network of associations, constructed from a full semantic network. Reproduction from Kenett et al., PLoS ONE 6(8): e23912 (2011) Dependency network for semantic data.jpg
Example of Dependency Network of associations, constructed from a full semantic network. Reproduction from Kenett et al., PLoS ONE 6(8): e23912 (2011)

Overview

To be more specific, the partial correlation of the pair (i, k) given j, is the correlation between them after proper subtraction of the correlations between i and j and between k and j. Defined this way, the difference between the correlations and the partial correlations provides a measure of the influence of node j on the correlation. Therefore, we define the influence of node j on node i, or the dependency of node i on node j  D(i,j), to be the sum of the influence of node j on the correlations of node i with all other nodes.

In the case of network topology, the analysis is based on the effect of node deletion on the shortest paths between the network nodes. More specifically, we define the influence of node j on each pair of nodes (i,k) to be the inverse of the topological distance between these nodes in the presence of j minus the inverse distance between them in the absence of node j. Then we define the influence of node j on node i, or the dependency of node i on node j  D(i,j), to be the sum of the influence of node j on the distances between node i with all other nodes k.

The activity dependency networks

The node-node correlations

The node-node correlations can be calculated by Pearson’s formula:

Where and are the activity of nodes i and j of subject n, μ stands for average, and sigma the STD of the dynamics profiles of nodes i and j. Note that the node-node correlations (or for simplicity the node correlations) for all pairs of nodes define a symmetric correlation matrix whose element is the correlation between nodes i and j.

Partial correlations

Next we use the resulting node correlations to compute the partial correlations. The first order partial correlation coefficient is a statistical measure indicating how a third variable affects the correlation between two other variables. The partial correlation between nodes i and k with respect to a third node is defined as:

where and are the node correlations defined above.

The correlation influence and correlation dependency

The relative effect of the correlations and of node j on the correlation C(i,k) is given by:

This avoids the trivial case were node j appears to strongly affect the correlation , mainly because and have small values. We note that this quantity can be viewed either as the correlation dependency of C(i,k) on node j (the term used here) or as the correlation influence of node j on the correlation C(i,k).

Node activity dependencies

Next, we define the total influence of node j on node i, or the dependency D(i,j) of node i on node j to be:

As defined,D(i,j) is a measure of the average influence of node j on the correlations C(i,k) over all nodes k not equal to j. The node activity dependencies define a dependency matrix D whose (i,j) element is the dependency of node i on node j. It is important to note that while the correlation matrix C is a symmetric matrix, the dependency matrix D is nonsymmetrical – since the influence of node j on node i is not equal to the influence of node i on node j. For this reason, some of the methods used in the analyses of the correlation matrix (e.g. the PCA) have to be replaced or are less efficient. Yet there are other methods, as the ones used here, that can properly account for the non-symmetric nature of the dependency matrix.

The structure dependency networks

The path influence and distance dependency: The relative effect of node j on the directed path – the shortest topological path with each segment corresponds to a distance 1, between nodes i and k is given:

where and are the shortest directed topological path from node i to node k in the presence and the absence of node j respectively.

Node structural dependencies

Next, we define the total influence of node j on node i, or the dependency D(i,j) of node i on node j to be:

As defined, D(i,j) is a measure of the average influence of node j on the directed paths from node i to all other nodes k. The node structural dependencies define a dependency matrix D whose (i,j) element is the dependency of node i on node j, or the influence of node j on node i. It is important to note that the dependency matrix D is nonsymmetrical – since the influence of node j on node i is not equal to the influence of node i on node j.

Visualization of the dependency network

The dependency matrix is the weighted adjacency matrix, representing the fully connected network. Different algorithms can be applied to filter the fully connected network to obtain the most meaningful information, such as using a threshold approach, [1] or different pruning algorithms. A widely used method to construct informative sub-graph of a complete network is the Minimum Spanning Tree (MST). [10] [11] [12] [13] [14] Another informative sub-graph, which retains more information (in comparison to the MST) is the Planar Maximally Filtered Graph (PMFG) [15] which is used here. Both methods are based on hierarchical clustering and the resulting sub-graphs include all the N nodes in the network whose edges represent the most relevant association correlations. The MST sub-graph contains edges with no loops while the PMFG sub-graph contains edges.

See also

Related Research Articles

<span class="mw-page-title-main">Feynman diagram</span> Pictorial representation of the behavior of subatomic particles

In theoretical physics, a Feynman diagram is a pictorial representation of the mathematical expressions describing the behavior and interaction of subatomic particles. The scheme is named after American physicist Richard Feynman, who introduced the diagrams in 1948. The interaction of subatomic particles can be complex and difficult to understand; Feynman diagrams give a simple visualization of what would otherwise be an arcane and abstract formula. According to David Kaiser, "Since the middle of the 20th century, theoretical physicists have increasingly turned to this tool to help them undertake critical calculations. Feynman diagrams have revolutionized nearly every aspect of theoretical physics." While the diagrams are applied primarily to quantum field theory, they can also be used in other areas of physics, such as solid-state theory. Frank Wilczek wrote that the calculations that won him the 2004 Nobel Prize in Physics "would have been literally unthinkable without Feynman diagrams, as would [Wilczek's] calculations that established a route to production and observation of the Higgs particle."

<span class="mw-page-title-main">Correlation</span> Statistical concept

In statistics, correlation or dependence is any statistical relationship, whether causal or not, between two random variables or bivariate data. Although in the broadest sense, "correlation" may indicate any type of association, in statistics it usually refers to the degree to which a pair of variables are linearly related. Familiar examples of dependent phenomena include the correlation between the height of parents and their offspring, and the correlation between the price of a good and the quantity the consumers are willing to purchase, as it is depicted in the so-called demand curve.

In computer science, a topological sort or topological ordering of a directed graph is a linear ordering of its vertices such that for every directed edge (u,v) from vertex u to vertex v, u comes before v in the ordering. For instance, the vertices of the graph may represent tasks to be performed, and the edges may represent constraints that one task must be performed before another; in this application, a topological ordering is just a valid sequence for the tasks. Precisely, a topological sort is a graph traversal in which each node v is visited only after all its dependencies are visited. A topological ordering is possible if and only if the graph has no directed cycles, that is, if it is a directed acyclic graph (DAG). Any DAG has at least one topological ordering, and algorithms are known for constructing a topological ordering of any DAG in linear time. Topological sorting has many applications, especially in ranking problems such as feedback arc set. Topological sorting is possible even when the DAG has disconnected components.

<span class="mw-page-title-main">Markov random field</span> Set of random variables

In the domain of physics and probability, a Markov random field (MRF), Markov network or undirected graphical model is a set of random variables having a Markov property described by an undirected graph. In other words, a random field is said to be a Markov random field if it satisfies Markov properties. The concept originates from the Sherrington–Kirkpatrick model.

In mathematics, the discrete Laplace operator is an analog of the continuous Laplace operator, defined so that it has meaning on a graph or a discrete grid. For the case of a finite-dimensional graph, the discrete Laplace operator is more commonly called the Laplacian matrix.

In graph theory, a clustering coefficient is a measure of the degree to which nodes in a graph tend to cluster together. Evidence suggests that in most real-world networks, and in particular social networks, nodes tend to create tightly knit groups characterised by a relatively high density of ties; this likelihood tends to be greater than the average probability of a tie randomly established between two nodes.

<span class="mw-page-title-main">Centrality</span> Degree of connectedness within a graph

In graph theory and network analysis, indicators of centrality assign numbers or rankings to nodes within a graph corresponding to their network position. Applications include identifying the most influential person(s) in a social network, key infrastructure nodes in the Internet or urban networks, super-spreaders of disease, and brain networks. Centrality concepts were first developed in social network analysis, and many of the terms used to measure centrality reflect their sociological origin.

<span class="mw-page-title-main">Degree distribution</span>

In the study of graphs and networks, the degree of a node in a network is the number of connections it has to other nodes and the degree distribution is the probability distribution of these degrees over the whole network.

<span class="mw-page-title-main">Watts–Strogatz model</span> Method of generating random small-world graphs

The Watts–Strogatz model is a random graph generation model that produces graphs with small-world properties, including short average path lengths and high clustering. It was proposed by Duncan J. Watts and Steven Strogatz in their article published in 1998 in the Nature scientific journal. The model also became known as the (Watts) beta model after Watts used to formulate it in his popular science book Six Degrees.

<span class="mw-page-title-main">Assortativity</span> Tendency for similar nodes to be connected

Assortativity, or assortative mixing, is a preference for a network's nodes to attach to others that are similar in some way. Though the specific measure of similarity may vary, network theorists often examine assortativity in terms of a node's degree. The addition of this characteristic to network models more closely approximates the behaviors of many real world networks.

In network science, a gradient network is a directed subnetwork of an undirected "substrate" network where each node has an associated scalar potential and one out-link that points to the node with the smallest potential in its neighborhood, defined as the union of itself and its neighbors on the substrate network.

Different definitions have been given for the dimension of a complex network or graph. For example, metric dimension is defined in terms of the resolving set for a graph. Dimension has also been defined based on the box covering method applied to graphs. Here we describe the definition based on the complex network zeta function. This generalises the definition based on the scaling property of the volume with distance. The best definition depends on the application.

<span class="mw-page-title-main">Network science</span> Academic field

Network science is an academic field which studies complex networks such as telecommunication networks, computer networks, biological networks, cognitive and semantic networks, and social networks, considering distinct elements or actors represented by nodes and the connections between the elements or actors as links. The field draws on theories and methods including graph theory from mathematics, statistical mechanics from physics, data mining and information visualization from computer science, inferential modeling from statistics, and social structure from sociology. The United States National Research Council defines network science as "the study of network representations of physical, biological, and social phenomena leading to predictive models of these phenomena."

<span class="mw-page-title-main">Modularity (networks)</span> Measure of network community structure

Modularity is a measure of the structure of networks or graphs which measures the strength of division of a network into modules. Networks with high modularity have dense connections between the nodes within modules but sparse connections between nodes in different modules. Modularity is often used in optimization methods for detecting community structure in networks. Biological networks, including animal brains, exhibit a high degree of modularity. However, modularity maximization is not statistically consistent, and finds communities in its own null model, i.e. fully random graphs, and therefore it cannot be used to find statistically significant community structures in empirical networks. Furthermore, it has been shown that modularity suffers a resolution limit and, therefore, it is unable to detect small communities.

SimRank is a general similarity measure, based on a simple and intuitive graph-theoretic model. SimRank is applicable in any domain with object-to-object relationships, that measures similarity of the structural context in which objects occur, based on their relationships with other objects. Effectively, SimRank is a measure that says "two objects are considered to be similar if they are referenced by similar objects." Although SimRank is widely adopted, it may output unreasonable similarity scores which are influenced by different factors, and can be solved in several ways, such as introducing an evidence weight factor, inserting additional terms that are neglected by SimRank or using PageRank-based alternatives.

<span class="mw-page-title-main">Katz centrality</span> Measure of centrality in a network based on nodal influence

In graph theory, the Katz centrality or alpha centrality of a node is a measure of centrality in a network. It was introduced by Leo Katz in 1953 and is used to measure the relative degree of influence of an actor within a social network. Unlike typical centrality measures which consider only the shortest path between a pair of actors, Katz centrality measures influence by taking into account the total number of walks between a pair of actors.

<span class="mw-page-title-main">Index cohesive force</span>

The index cohesive force (ICF) concept has been introduced by Dror Y. Kenett and his Ph.D. supervisor Eshel Ben-Jacob, as a new quantitative measure of the index effect on financial markets. The ICF is formally defined as the balance (ratio) between the raw stock correlations that include the index effect and the residual stock correlations after subtraction of the index effect. Defined this way, the ICF provides a means to identify structural changes in the market, which can render it prone to systemic collapses: High values of the ICF characterize a state in which the index predominantly affects the market dynamics while it shades the effect of other degrees of freedom that can contribute to the market flexibility. Thus high values of the ICF correspond to a state in which the market index dominates the behavior of the market, thus making it stiff and hence during such state the market is highly prone to systematic collapses, even due to relatively small external perturbations, leaving it incapable of coping with crises.

A graphoid is a set of statements of the form, "X is irrelevant to Y given that we know Z" where X, Y and Z are sets of variables. The notion of "irrelevance" and "given that we know" may obtain different interpretations, including probabilistic, relational and correlational, depending on the application. These interpretations share common properties that can be captured by paths in graphs. The theory of graphoids characterizes these properties in a finite set of axioms that are common to informational irrelevance and its graphical representations.

<span class="mw-page-title-main">Configuration model</span>

In network science, the configuration model is a method for generating random networks from a given degree sequence. It is widely used as a reference model for real-life social networks, because it allows the modeler to incorporate arbitrary degree distributions.

<span class="mw-page-title-main">Graph neural network</span> Class of artificial neural networks

A graph neural network (GNN) belongs to a class of artificial neural networks for processing data that can be represented as graphs.

References

  1. 1 2 3 Kenett, Dror Y.; Tumminello, Michele; Madi, Asaf; Gur-Gershgoren, Gitit; Mantegna, Rosario N.; Ben-Jacob, Eshel (20 December 2010). Scalas, Enrico (ed.). "Dominating Clasp of the Financial Sector Revealed by Partial Correlation Analysis of the Stock Market". PLOS ONE. 5 (12): e15032. Bibcode:2010PLoSO...515032K. doi: 10.1371/journal.pone.0015032 . ISSN   1932-6203. PMC   3004792 . PMID   21188140.
  2. Dror Y. Kenett, Yoash Shapira, Gitit Gur-Gershgoren, and Eshel Ben-Jacob (submitted), Index Cohesive Force analysis of the U.S. stock market, Proceedings of the 2011 International Conference on Econophysics, Kavala, Greece
  3. 1 2 Asaf Madi, Dror Y. Kenett, Sharron Bransburg-Zabary, Yifat Merbl, Francisco J. Quintana, Stefano Boccaletti, Alfred I. Tauber, Irun R. Cohen, and Eshel Ben-Jacob (2011), Analyses of antigen dependency networks unveil immune system reorganization between birth and adulthood, Chaos 21, 016109 Archived 2012-03-30 at the Wayback Machine
  4. 1 2 Kenett, Yoed N.; Kenett, Dror Y.; Ben-Jacob, Eshel; Faust, Miriam (24 August 2011). Perc, Matjaz (ed.). "Global and Local Features of Semantic Networks: Evidence from the Hebrew Mental Lexicon". PLOS ONE. 6 (8): e23912. Bibcode:2011PLoSO...623912K. doi: 10.1371/journal.pone.0023912 . ISSN   1932-6203. PMC   3161081 . PMID   21887343.
  5. Kunihiro Baba, Ritel Shibata, Masaaki Sibuya (2004), Partial correlation and conditional correlation as measures of conditional independence, Aust New Zealand J Stat 46(4): 657–774
  6. Yoash Shapira, Dror Y. Kenett, and Eshel Ben-Jacob (2009), The Index Cohesive Effect on Stock Market Correlations, Journal of Physics B. vol. 72, no. 4, pp. 657–669
  7. Kenett, Dror Y.; Shapira, Yoash; Madi, Asaf; Bransburg-Zabary, Sharron; Gur-Gershgoren, Gitit; Ben-Jacob, Eshel (27 April 2011). Scalas, Enrico (ed.). "Index Cohesive Force Analysis Reveals That the US Market Became Prone to Systemic Collapses Since 2002". PLOS ONE. 6 (4): e19378. Bibcode:2011PLoSO...619378K. doi: 10.1371/journal.pone.0019378 . ISSN   1932-6203. PMC   3083438 . PMID   21556323.
  8. Dror Y. Kenett, Matthias Raddant, Thomas Lux, and Eshel Ben-Jacob (submitted), Evolvement of uniformity and volatility in the stressed global market, PNAS
  9. Eran Stark, Rotem Drori and Moshe Abeles (2006), Partial Cross-Correlation Analysis Resolves Ambiguity in the Encoding of Multiple Movement Features, J Neurophysiol 95: 1966–1975
  10. Rosario N. Mantegna, Hierarchical structure in Financial markets, Eur. Phys. J. B 11 (1), 193–197 (1999) Archived 2023-02-04 at the Wayback Machine
  11. Rosario N. Mantegna, Computer Physics Communications 121–122, 153–156 (1999)
  12. Guillermo J. Ortega, Rafael G. Sola and Jesus Pastor, Complex network analysis of Human ECoG data, Neuroscience Letters 447 (2-3), 129–133 (2008) [ permanent dead link ]
  13. Michele Tumminello, Claudia Coronnello, Fabrizio Lillo, Salvatore Miccichè and Rrosario N. Mantegna, Spanning trees and bootstrap reliability estimations in correlation based networks Archived 2021-10-27 at the Wayback Machine
  14. Douglas B. West, An Introduction to Graph Theory, edited by Prentice-Hall, Englewood Cliffs, NJ, 2001
  15. Michele Tumminello, Tomaso Aste, Tiziana Di Matteo and Rosario N. Mantegna, A tool for filtering information in complex systems, PNAS 102 (30), 10421–10426 (2005)