PERT network chart for a seven-month project with five milestones (10 through 50) and six activities (A through F)
The program evaluation and review technique (PERT) is a statistical tool used in project management, which was designed to analyze and represent the tasks involved in completing a given project.
PERT was originally developed by Charles E. Clark for the United States Navy in 1958; it is commonly used in conjunction with the Critical Path Method (CPM), which was also introduced in 1958.[1]
Overview
PERT is a method of analyzing the tasks involved in completing a project, especially the time needed to complete each task, and to identify the minimum time needed to complete the total project. It incorporates uncertainty by making it possible to schedule a project while not knowing precisely the details and durations of all the activities. It is more event-oriented than start- and completion-oriented, and is used more for projects where time is the major constraint rather than cost. It is applied to very large-scale, one-time, complex, non-routine infrastructure projects, as well as R&D projects.
PERT offers a management tool,[2]:497 which relies "on arrow and node diagrams of activities and events: arrows represent the activities or work necessary to reach the events or nodes that indicate each completed phase of the total project."[3]
PERT and CPM are complementary tools, because "CPM employs one time estimation and one cost estimation for each activity; PERT may utilize three time estimates (optimistic, expected, and pessimistic) and no costs for each activity. Although these are distinct differences, the term PERT is applied increasingly to all critical path scheduling."[3]
Initially PERT stood for Program Evaluation Research Task, but by 1959 was renamed.[4] It had been made public in 1958 in two publications of the U.S. Department of the Navy, entitled Program Evaluation Research Task, Summary Report, Phase 1.[7] and Phase 2.[8] both primarily written by Charles F. Clark.[1] In a 1959 article in The American Statistician, Willard Fazar, Head of the Program Evaluation Branch, Special Projects Office, U.S. Navy, gave a detailed description of the main concepts of PERT. He explained:
Through an electronic computer, the PERT technique processes data representing the major, finite accomplishments (events) essential to achieve end-objectives; the inter-dependence of those events; and estimates of time and range of time necessary to complete each activity between two successive events. Such time expectations include estimates of "most likely time", "optimistic time", and "pessimistic time" for each activity. The technique is a management control tool that sizes up the outlook for meeting objectives on time; highlights danger signals requiring management decisions; reveals and defines both methodicalness and slack in the flow plan or the network of sequential activities that must be performed to meet objectives; compares current expectations with scheduled completion dates and computes the probability for meeting scheduled dates; and simulates the effects of options for decision— before decision.[9]
PERT Guide for Management Use, June 1963
Ten years after the introduction of PERT, the American librarian Maribeth Brennan compiled a selected bibliography with about 150 publications on PERT and CPM, all published between 1958 and 1968.[3]
For the subdivision of work units in PERT[10] another tool was developed: the Work Breakdown Structure. The Work Breakdown Structure provides "a framework for complete networking, the Work Breakdown Structure was formally introduced as the first item of analysis in carrying out basic PERT/CPM."[11]
Terminology
Events and activities
In a PERT diagram, the main building block is the event, with connections to its known predecessor events and successor events.
PERT event: a point that marks the start or completion of one or more activities. It consumes no time and uses no resources. When it marks the completion of one or more activities, it is not "reached" (does not occur) until all of the activities leading to that event have been completed.
predecessor event: an event that immediately precedes some other event without any other events intervening. An event can have multiple predecessor events and can be the predecessor of multiple events.
successor event: an event that immediately follows some other event without any other intervening events. An event can have multiple successor events and can be the successor of multiple events.
Besides events, PERT also tracks activities and sub-activities:
PERT activity: the actual performance of a task which consumes time and requires resources (such as labor, materials, space, machinery). It can be understood as representing the time, effort, and resources required to move from one event to another. A PERT activity cannot be performed until the predecessor event has occurred.
PERT sub-activity: a PERT activity can be further decomposed into a set of sub-activities. For example, activity A1 can be decomposed into A1.1, A1.2 and A1.3. Sub-activities have all the properties of activities; in particular, a sub-activity has predecessor or successor events just like an activity. A sub-activity can be decomposed again into finer-grained sub-activities.
Time
PERT defines four types of time required to accomplish an activity:
optimistic time: the minimum possible time required to accomplish an activity (o) or a path (O), assuming everything proceeds better than is normally expected[2]:512
pessimistic time: the maximum possible time required to accomplish an activity (p) or a path (P), assuming everything goes wrong (but excluding major catastrophes).[2]:512
most likely time: the best estimate of the time required to accomplish an activity (m) or a path (M), assuming everything proceeds as normal.[2]:512
expected time: the best estimate of the time required to accomplish an activity (te) or a path (TE), accounting for the fact that things don't always proceed as normal (the implication being that the expected time is the average time the task would require if the task were repeated on a number of occasions over an extended period of time).[2]:512–513
standard deviation of time: the variability of the time for accomplishing an activity (σte) or a path (σTE)
Management tools
PERT supplies a number of tools for management with determination of concepts, such as:
float or slack is a measure of the excess time and resources available to complete a task. It is the amount of time that a project task can be delayed without causing a delay in any subsequent tasks (free float) or the whole project (total float). Positive slack would indicate ahead of schedule; negative slack would indicate behind schedule; and zero slack would indicate on schedule.
critical path: the longest possible continuous pathway taken from the initial event to the terminal event. It determines the total calendar time required for the project; and, therefore, any time delays along the critical path will delay the reaching of the terminal event by at least the same amount.
critical activity: An activity that has total float equal to zero. An activity with zero free float is not necessarily on the critical path since its path may not be the longest.
lead time: the time by which a predecessor event must be completed in order to allow sufficient time for the activities that must elapse before a specific PERT event reaches completion.
lag time: the earliest time by which a successor event can follow a specific PERT event.
fast tracking: performing more critical activities in parallel
The first step for scheduling the project is to determine the tasks that the project requires and the order in which they must be completed. The order may be easy to record for some tasks (e.g., when building a house, the land must be graded before the foundation can be laid) while difficult for others (there are two areas that need to be graded, but there are only enough bulldozers to do one). Additionally, the time estimates usually reflect the normal, non-rushed time. Many times, the time required to execute the task can be reduced for an additional cost or a reduction in the quality.
Example
In the following example there are seven tasks, labeled A through G. Some tasks can be done concurrently (A and B) while others cannot be done until their predecessor task is complete (C cannot begin until A is complete). Additionally, each task has three time estimates: the optimistic time estimate (o), the most likely or normal time estimate (m), and the pessimistic time estimate (p). The expected time (te) is computed using the formula (o + 4m + p) ÷ 6.[2]:512–513
Activity
Predecessor
Time estimates
Expected time
Opt. (o)
Normal (m)
Pess. (p)
A
—
2
4
6
4.00
B
—
3
5
9
5.33
C
A
4
5
7
5.17
D
A
4
6
10
6.33
E
B, C
4
5
7
5.17
F
D
3
4
8
4.50
G
E
3
5
8
5.17
Once this step is complete, one can draw a Gantt chart or a network diagram.
A Gantt chart created using Microsoft Project (MSP). Note (1) the critical path is in red, (2) the slack is the black lines connected to non-critical activities, (3) since Saturday and Sunday are not work days and are thus excluded from the schedule, some bars on the Gantt chart are longer if they cut through a weekend.
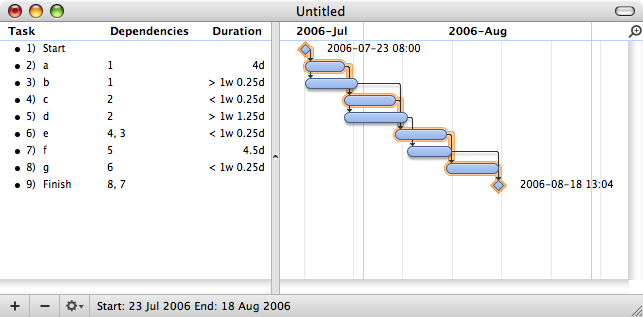
A Gantt chart created using OmniPlan. Note (1) the critical path is highlighted, (2) the slack is not specifically indicated on task 5 (d), though it can be observed on tasks 3 and 7 (b and f), (3) since weekends are indicated by a thin vertical line, and take up no additional space on the work calendar, bars on the Gantt chart are not longer or shorter when they do or don't carry over a weekend.
Next step, creating network diagram by hand or by using diagram software
A network diagram can be created by hand or by using diagram software. There are two types of network diagrams, activity on arrow (AOA) and activity on node (AON). Activity on node diagrams are generally easier to create and interpret. To create an AON diagram, it is recommended (but not required) to start with a node named start. This "activity" has a duration of zero (0). Then you draw each activity that does not have a predecessor activity (a and b in this example) and connect them with an arrow from start to each node. Next, since both c and d list a as a predecessor activity, their nodes are drawn with arrows coming from a. Activity e is listed with b and c as predecessor activities, so node e is drawn with arrows coming from both b and c, signifying that e cannot begin until both b and c have been completed. Activity f has d as a predecessor activity, so an arrow is drawn connecting the activities. Likewise, an arrow is drawn from e to g. Since there are no activities that come after f or g, it is recommended (but again not required) to connect them to a node labeled finish.
A node like this one can be used to display the activity name, duration, ES, EF, LS, LF, and slack.
By itself, the network diagram pictured above does not give much more information than a Gantt chart; however, it can be expanded to display more information. The most common information shown is:
In order to determine this information it is assumed that the activities and normal duration times are given. The first step is to determine the ES and EF. The ES is defined as the maximum EF of all predecessor activities, unless the activity in question is the first activity, for which the ES is zero (0). The EF is the ES plus the task duration (EF = ES + duration).
The ES for start is zero since it is the first activity. Since the duration is zero, the EF is also zero. This EF is used as the ES for a and b.
The ES for a is zero. The duration (4 work days) is added to the ES to get an EF of four. This EF is used as the ES for c and d.
The ES for b is zero. The duration (5.33 work days) is added to the ES to get an EF of 5.33.
The ES for c is four. The duration (5.17 work days) is added to the ES to get an EF of 9.17.
The ES for d is four. The duration (6.33 work days) is added to the ES to get an EF of 10.33. This EF is used as the ES for f.
The ES for e is the greatest EF of its predecessor activities (b and c). Since b has an EF of 5.33 and c has an EF of 9.17, the ES of e is 9.17. The duration (5.17 work days) is added to the ES to get an EF of 14.34. This EF is used as the ES for g.
The ES for f is 10.33. The duration (4.5 work days) is added to the ES to get an EF of 14.83.
The ES for g is 14.34. The duration (5.17 work days) is added to the ES to get an EF of 19.51.
The ES for finish is the greatest EF of its predecessor activities (f and g). Since f has an EF of 14.83 and g has an EF of 19.51, the ES of finish is 19.51. Finish is a milestone (and therefore has a duration of zero), so the EF is also 19.51.
Barring any unforeseen events, the project should take 19.51 work days to complete. The next step is to determine the late start (LS) and late finish (LF) of each activity. This will eventually show if there are activities that have slack. The LF is defined as the minimum LS of all successor activities, unless the activity is the last activity, for which the LF equals the EF. The LS is the LF minus the task duration (LS = LF − duration).
The LF for finish is equal to the EF (19.51 work days) since it is the last activity in the project. Since the duration is zero, the LS is also 19.51 work days. This will be used as the LF for f and g.
The LF for g is 19.51 work days. The duration (5.17 work days) is subtracted from the LF to get an LS of 14.34 work days. This will be used as the LF for e.
The LF for f is 19.51 work days. The duration (4.5 work days) is subtracted from the LF to get an LS of 15.01 work days. This will be used as the LF for d.
The LF for e is 14.34 work days. The duration (5.17 work days) is subtracted from the LF to get an LS of 9.17 work days. This will be used as the LF for b and c.
The LF for d is 15.01 work days. The duration (6.33 work days) is subtracted from the LF to get an LS of 8.68 work days.
The LF for c is 9.17 work days. The duration (5.17 work days) is subtracted from the LF to get an LS of 4 work days.
The LF for b is 9.17 work days. The duration (5.33 work days) is subtracted from the LF to get an LS of 3.84 work days.
The LF for a is the minimum LS of its successor activities. Since c has an LS of 4 work days and d has an LS of 8.68 work days, the LF for a is 4 work days. The duration (4 work days) is subtracted from the LF to get an LS of 0 work days.
The LF for start is the minimum LS of its successor activities. Since a has an LS of 0 work days and b has an LS of 3.84 work days, the LS is 0 work days.
Next step, determination of critical path and possible slack
The next step is to determine the critical path and if any activities have slack. The critical path is the path that takes the longest to complete. To determine the path times, add the task durations for all available paths. Activities that have slack can be delayed without changing the overall time of the project. Slack is computed in one of two ways, slack = LF − EF or slack = LS − ES. Activities that are on the critical path have a slack of zero (0).
The duration of path adf is 14.83 work days.
The duration of path aceg is 19.51 work days.
The duration of path beg is 15.67 work days.
The critical path is aceg and the critical time is 19.51 work days. It is important to note that there can be more than one critical path (in a project more complex than this example) or that the critical path can change. For example, let's say that activities d and f take their pessimistic (b) times to complete instead of their expected (TE) times. The critical path is now adf and the critical time is 22 work days. On the other hand, if activity c can be reduced to one work day, the path time for aceg is reduced to 15.34 work days, which is slightly less than the time of the new critical path, beg (15.67 work days).
Assuming these scenarios do not happen, the slack for each activity can now be determined.
Start and finish are milestones and by definition have no duration, therefore they can have no slack (0 work days).
The activities on the critical path by definition have a slack of zero; however, it is always a good idea to check the math anyway when drawing by hand.
LFa – EFa = 4 − 4 = 0
LFc – EFc = 9.17 − 9.17 = 0
LFe – EFe = 14.34 − 14.34 = 0
LFg – EFg = 19.51 − 19.51 = 0
Activity b has an LF of 9.17 and an EF of 5.33, so the slack is 3.84 work days.
Activity d has an LF of 15.01 and an EF of 10.33, so the slack is 4.68 work days.
Activity f has an LF of 19.51 and an EF of 14.83, so the slack is 4.68 work days.
Therefore, activity b can be delayed almost 4 work days without delaying the project. Likewise, activity dor activity f can be delayed 4.68 work days without delaying the project (alternatively, d and f can be delayed 2.34 work days each).
Depending upon the capabilities of the data input phase of the critical path algorithm, it may be possible to create a loop, such as A -> B -> C -> A. This can cause simple algorithms to loop indefinitely. Although it is possible to "mark" nodes that have been visited, then clear the "marks" upon completion of the process, a far simpler mechanism involves computing the total of all activity durations. If an EF of more than the total is found, the computation should be terminated. It is worth saving the identities of the most recently visited dozen or so nodes to help identify the problem link.
As project scheduling tool
Advantages
PERT chart explicitly defines and makes visible dependencies (precedence relationships) between the work breakdown structure (commonly WBS) elements.
PERT facilitates identification of the critical path and makes this visible.
PERT facilitates identification of early start, late start, and slack for each activity.
PERT provides for potentially reduced project duration due to better understanding of dependencies leading to improved overlapping of activities and tasks where feasible.
The large amount of project data can be organized and presented in diagram for use in decision making.
PERT can provide a probability of completing before a given time.
Disadvantages
There can be potentially hundreds or thousands of activities and individual dependency relationships.
PERT is not easy to scale down for smaller projects.
The network charts tend to be large and unwieldy, requiring several pages to print and requiring specially-sized paper.
The lack of a timeframe on most PERT/CPM charts makes it harder to show status, although colours can help, e.g., specific colour for completed nodes.
Uncertainty in project scheduling
During project execution a real-life project will never execute exactly as it was planned due to uncertainty. This can be due to ambiguity resulting from subjective estimates that are prone to human errors or can be the result of variability arising from unexpected events or risks. The main reason that PERT may provide inaccurate information about the project completion time is due to this schedule uncertainty. This inaccuracy may be large enough to render such estimates as not helpful.
One possible method to maximize solution robustness is to include safety in the baseline schedule in order to absorb disruptions. This is called proactive scheduling, however, allowing for every possible disruption would be very slow and couldn't be accommodated by the baseline schedule. A second approach, termed reactive scheduling, defines a procedure to react to disruptions that cannot be absorbed by the baseline schedule.
12Kelley, James E.; Walker, Morgan R.; Sayer, John S. (February 1989). "The Origins of CPM: a personal history". Project Management. 3 (2). Project Management Institute: 18. Retrieved 20 March 2024.
12Malcolm, Donald G.; Roseboom, John H.; Clark, Charles E.; Fazar, Willard; "Application of a Technique for Research and Development Program Evaluation", Operations Research, vol. 7, no. 5, September–October 1959, pp. 646–669
↑Zimmerman, Steve; Conrad, Leo M. (May 1982). "Programming PERT in BASIC". BYTE. pp.465–478. Retrieved 29 December 2024.
↑Willard Fazar cited in: Stauber, B. Ralph; Douty, Harry M.; Fazar, Willard; Jordan, Richard H.; Weinfeld, William; and Manvel, Allen D.; "Federal Statistical Activities", The American Statistician, 13(2): 9–12 (April 1959), pp. 9–12
↑Cook, Desmond L.; Program Evaluation and Review Technique, 1966, p. 12
Project Management Institute (2013). A Guide to the Project Management Body of Knowledge (5thed.). Project Management Institute. ISBN978-1-935589-67-9.
Kerzner, Harold (2009). Project Management: A Systems Approach to Planning, Scheduling, and Controlling (10thed.). Wiley. ISBN978-0-470-27870-3.
Milosevic, Dragan Z. (2003). Project Management ToolBox: Tools and Techniques for the Practicing Project Manager. Wiley. ISBN978-0-471-20822-8.
Miller, Robert W. (1963). Schedule, Cost, and Profit Control with PERT - A Comprehensive Guide for Program Management. McGraw-Hill. ISBN9780070419940.{{cite book}}: ISBN / Date incompatibility (help)
This page is based on this Wikipedia article Text is available under the CC BY-SA 4.0 license; additional terms may apply. Images, videos and audio are available under their respective licenses.