In probability theory and statistics, the cumulative distribution function (CDF) of a real-valued random variable , or just distribution function of , evaluated at , is the probability that will take a value less than or equal to .

In probability theory, the expected value is a generalization of the weighted average. Informally, the expected value is the arithmetic mean of a large number of independently selected outcomes of a random variable. Since it is obtained through arithmetic, the expected value sometimes may not even be included in the sample data set; it is not the value you would "expect" to get in reality.
In statistics, an estimator is a rule for calculating an estimate of a given quantity based on observed data: thus the rule, the quantity of interest and its result are distinguished. For example, the sample mean is a commonly used estimator of the population mean.

In statistics and probability theory, the median is the value separating the higher half from the lower half of a data sample, a population, or a probability distribution. For a data set, it may be thought of as "the middle" value. The basic feature of the median in describing data compared to the mean is that it is not skewed by a small proportion of extremely large or small values, and therefore provides a better representation of the center. Median income, for example, may be a better way to describe center of the income distribution because increases in the largest incomes alone have no effect on median. For this reason, the median is of central importance in robust statistics.

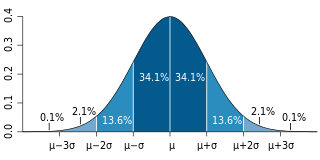
In probability theory and statistics, a probability distribution is the mathematical function that gives the probabilities of occurrence of different possible outcomes for an experiment. It is a mathematical description of a random phenomenon in terms of its sample space and the probabilities of events.

A random variable is a mathematical formalization of a quantity or object which depends on random events. The term 'random variable' can be misleading as its mathematical definition is not actually random nor a variable, but rather it is a function from possible outcomes in a sample space to a measurable space, often to the real numbers.

Independence is a fundamental notion in probability theory, as in statistics and the theory of stochastic processes. Two events are independent, statistically independent, or stochastically independent if, informally speaking, the occurrence of one does not affect the probability of occurrence of the other or, equivalently, does not affect the odds. Similarly, two random variables are independent if the realization of one does not affect the probability distribution of the other.
In probability theory, the central limit theorem (CLT) establishes that, in many situations, for independent and identically distributed random variables, the sampling distribution of the standardized sample mean tends towards the standard normal distribution even if the original variables themselves are not normally distributed.
The likelihood function is the joint probability of observed data viewed as a function of the parameters of a statistical model.
In probability theory and statistics, the moment-generating function of a real-valued random variable is an alternative specification of its probability distribution. Thus, it provides the basis of an alternative route to analytical results compared with working directly with probability density functions or cumulative distribution functions. There are particularly simple results for the moment-generating functions of distributions defined by the weighted sums of random variables. However, not all random variables have moment-generating functions.

The theory of belief functions, also referred to as evidence theory or Dempster–Shafer theory (DST), is a general framework for reasoning with uncertainty, with understood connections to other frameworks such as probability, possibility and imprecise probability theories. First introduced by Arthur P. Dempster in the context of statistical inference, the theory was later developed by Glenn Shafer into a general framework for modeling epistemic uncertainty—a mathematical theory of evidence. The theory allows one to combine evidence from different sources and arrive at a degree of belief that takes into account all the available evidence.

In mathematics, an indicator function or a characteristic function of a subset of a set is a function that maps elements of the subset to one, and all other elements to zero. That is, if A is a subset of some set X, then if and otherwise, where is a common notation for the indicator function. Other common notations are and
In mathematics, the moments of a function are certain quantitative measures related to the shape of the function's graph. If the function represents mass density, then the zeroth moment is the total mass, the first moment is the center of mass, and the second moment is the moment of inertia. If the function is a probability distribution, then the first moment is the expected value, the second central moment is the variance, the third standardized moment is the skewness, and the fourth standardized moment is the kurtosis. The mathematical concept is closely related to the concept of moment in physics.
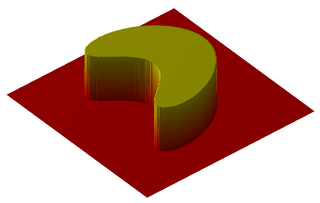
In mathematics, the support of a real-valued function is the subset of the function domain containing the elements which are not mapped to zero. If the domain of is a topological space, then the support of is instead defined as the smallest closed set containing all points not mapped to zero. This concept is used very widely in mathematical analysis.
In probability theory and statistics, given two jointly distributed random variables and , the conditional probability distribution of given is the probability distribution of when is known to be a particular value; in some cases the conditional probabilities may be expressed as functions containing the unspecified value of as a parameter. When both and are categorical variables, a conditional probability table is typically used to represent the conditional probability. The conditional distribution contrasts with the marginal distribution of a random variable, which is its distribution without reference to the value of the other variable.
In probability and statistics, a mixture distribution is the probability distribution of a random variable that is derived from a collection of other random variables as follows: first, a random variable is selected by chance from the collection according to given probabilities of selection, and then the value of the selected random variable is realized. The underlying random variables may be random real numbers, or they may be random vectors, in which case the mixture distribution is a multivariate distribution.

In probability theory and statistics, the continuous uniform distributions or rectangular distributions are a family of symmetric probability distributions. Such a distribution describes an experiment where there is an arbitrary outcome that lies between certain bounds. The bounds are defined by the parameters, and which are the minimum and maximum values. The interval can either be closed or open. Therefore, the distribution is often abbreviated where stands for uniform distribution. The difference between the bounds defines the interval length; all intervals of the same length on the distribution's support are equally probable. It is the maximum entropy probability distribution for a random variable under no constraint other than that it is contained in the distribution's support.
This glossary of statistics and probability is a list of definitions of terms and concepts used in the mathematical sciences of statistics and probability, their sub-disciplines, and related fields. For additional related terms, see Glossary of mathematics and Glossary of experimental design.

In probability theory and statistics, the characteristic function of any real-valued random variable completely defines its probability distribution. If a random variable admits a probability density function, then the characteristic function is the Fourier transform of the probability density function. Thus it provides an alternative route to analytical results compared with working directly with probability density functions or cumulative distribution functions. There are particularly simple results for the characteristic functions of distributions defined by the weighted sums of random variables.

A correlation function is a function that gives the statistical correlation between random variables, contingent on the spatial or temporal distance between those variables. If one considers the correlation function between random variables representing the same quantity measured at two different points, then this is often referred to as an autocorrelation function, which is made up of autocorrelations. Correlation functions of different random variables are sometimes called cross-correlation functions to emphasize that different variables are being considered and because they are made up of cross-correlations.


