Microsoft Excel is a spreadsheet developed by Microsoft for Windows, macOS, Android and iOS. It features calculation, graphing tools, pivot tables, and a macro programming language called Visual Basic for Applications. It has been a very widely applied spreadsheet for these platforms, especially since version 5 in 1993, and it has replaced Lotus 1-2-3 as the industry standard for spreadsheets. Excel forms part of the Microsoft Office suite of software.
Lotus Symphony was an integrated software package for creating and editing text, spreadsheets, charts and other documents on the MS-DOS operating systems. It was released by Lotus Development as a follow-on to its popular spreadsheet program, Lotus 1-2-3, and was produced from 1984-1992. Lotus Jazz on the Apple Macintosh was a sibling product.

SPSS Statistics is a software package used for interactive, or batched, statistical analysis. Long produced by SPSS Inc., it was acquired by IBM in 2009. The current versions (2015) are named IBM SPSS Statistics.
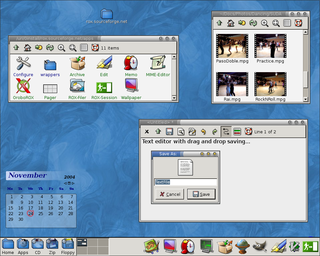
The ROX Desktop is a graphical desktop environment for the X Window System. It is based on the ROX-Filer which is a drag and drop spatial file manager. It is free software released under the GNU General Public License. The environment was inspired by the user interface of RISC OS. Programs can be installed or removed easily using Zero Install.

Application software is software designed to perform a group of coordinated functions, tasks, or activities for the benefit of the user. Examples of an application include a word processor, a spreadsheet, an accounting application, a web browser, an email client, a media player, a file viewer, an aeronautical flight simulator, a console game or a photo editor. The collective noun application software refers to all applications collectively. This contrasts with system software, which is mainly involved with running the computer.

Calligra Sheets is a free software spreadsheet application that is part of Calligra Suite, an integrated graphic art and office suite developed by KDE.
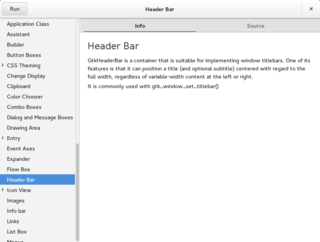
A control element in a graphical user interface is an element of interaction, such as a button or a scroll bar. Controls are software components that a computer user interacts with through direct manipulation to read or edit information about an application. User interface libraries such as Windows Presentation Foundation, GTK, and Cocoa, contain a collection of controls and the logic to render these.

iWork is an office suite of applications created by Apple Inc. for its macOS and iOS operating systems, and also available cross-platform through the iCloud website.

A grid view or a datagrid is a graphical control element that presents a tabular view of data. A typical grid view also supports some or all of the following:
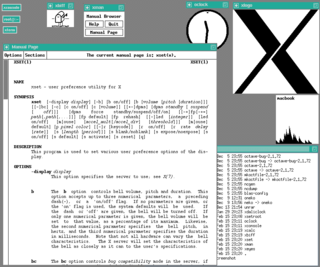
In computing, a shell is a user interface for access to an operating system's services. In general, operating system shells use either a command-line interface (CLI) or graphical user interface (GUI), depending on a computer's role and particular operation. It is named a shell because it is the outermost layer around the operating system kernel.

LabPlot is a free software and cross-platform computer program for interactive scientific graphing and data analysis, written for the KDE desktop. It is similar to Origin and is able to import Origin's data files.
EditGrid was a Web 2.0 spreadsheet service, operated via Internet access. It offered both a free-of-charge service to personal users and a subscription service to organisations and was available on a number of partner sites and channels.

XMind is a mind mapping and brainstorming software, developed by XMind Ltd. In addition to the management elements, the software can be used to capture ideas, clarify thinking, manage complex information, and promote team collaboration. As of April 2013, XMind was selected as the most popular mind mapping software on Lifehacker.
PSPP is a free software application for analysis of sampled data, intended as a free alternative for IBM SPSS Statistics. It has a graphical user interface and conventional command-line interface. It is written in C and uses GNU Scientific Library for its mathematical routines. The name has "no official acronymic expansion".
A software widget is a relatively simple and easy-to-use software application or component made for one or more different software platforms.
StatView is a statistics application originally released for Apple Macintosh computers in 1985.

Sheetster is a GPL open-source Web Spreadsheet and a Java Application Server created by Extentech Inc. The product was created for the enterprise and small and medium-sized businesses as an Open Source alternative to closed document management systems.
Productivity software is application software used for producing information. Its names arose from the fact that it increases productivity, especially of individual office workers, from typists to knowledge workers, although its scope is now wider than that. Office suites, which brought word processing, spreadsheet, and relational database programs to the desktop in the 1980s, are the core example of productivity software. They revolutionized the office with the magnitude of the productivity increase they brought as compared with the pre-1980s office environments of typewriters, paper filing, and handwritten lists and ledgers. In the United States, some 78% of "middle-skill" occupations now require the use of productivity software. In the 2010s, productivity software has become even more consumerized than it already was, as computing becomes ever more integrated into daily personal life.

Google Sheets is a spreadsheet program included as part of a free, web-based software office suite offered by Google within its Google Drive service. The service also includes Google Docs and Google Slides, a word processor and presentation program respectively. Google Sheets is available as a web application, mobile app for Android, iOS, Windows, BlackBerry, and as a desktop application on Google's ChromeOS. The app is compatible with Microsoft Excel file formats. The app allows users to create and edit files online while collaborating with other users in real-time. Edits are tracked by user with a revision history presenting changes. An editor's position is highlighted with an editor-specific color and cursor and a permissions system regulates what users can do. Updates have introduced features using machine learning, including "Explore", offering answers based on natural language questions in a spreadsheet.
