Econometrics is an application of statistical methods to economic data in order to give empirical content to economic relationships. More precisely, it is "the quantitative analysis of actual economic phenomena based on the concurrent development of theory and observation, related by appropriate methods of inference." An introductory economics textbook describes econometrics as allowing economists "to sift through mountains of data to extract simple relationships." Jan Tinbergen is one of the two founding fathers of econometrics. The other, Ragnar Frisch, also coined the term in the sense in which it is used today.
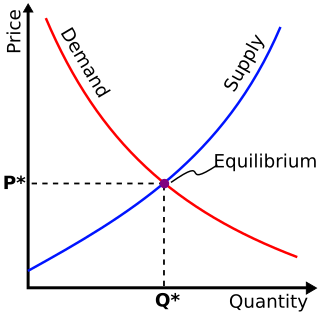
Simultaneous equations models are a type of statistical model in which the dependent variables are functions of other dependent variables, rather than just independent variables. This means some of the explanatory variables are jointly determined with the dependent variable, which in economics usually is the consequence of some underlying equilibrium mechanism. Take the typical supply and demand model: whilst typically one would determine the quantity supplied and demanded to be a function of the price set by the market, it is also possible for the reverse to be true, where producers observe the quantity that consumers demand and then set the price.

In statistical modeling, regression analysis is a set of statistical processes for estimating the relationships between a dependent variable and one or more error-free independent variables. The most common form of regression analysis is linear regression, in which one finds the line that most closely fits the data according to a specific mathematical criterion. For example, the method of ordinary least squares computes the unique line that minimizes the sum of squared differences between the true data and that line. For specific mathematical reasons, this allows the researcher to estimate the conditional expectation of the dependent variable when the independent variables take on a given set of values. Less common forms of regression use slightly different procedures to estimate alternative location parameters or estimate the conditional expectation across a broader collection of non-linear models.
In statistics, and particularly in econometrics, the reduced form of a system of equations is the result of solving the system for the endogenous variables. This gives the latter as functions of the exogenous variables, if any. In econometrics, the equations of a structural form model are estimated in their theoretically given form, while an alternative approach to estimation is to first solve the theoretical equations for the endogenous variables to obtain reduced form equations, and then to estimate the reduced form equations.
In statistics, econometrics, epidemiology and related disciplines, the method of instrumental variables (IV) is used to estimate causal relationships when controlled experiments are not feasible or when a treatment is not successfully delivered to every unit in a randomized experiment. Intuitively, IVs are used when an explanatory variable of interest is correlated with the error term (endogenous), in which case ordinary least squares and ANOVA give biased results. A valid instrument induces changes in the explanatory variable but has no independent effect on the dependent variable and is not correlated with the error term, allowing a researcher to uncover the causal effect of the explanatory variable on the dependent variable.
In statistics, omitted-variable bias (OVB) occurs when a statistical model leaves out one or more relevant variables. The bias results in the model attributing the effect of the missing variables to those that were included.
In econometrics, endogeneity broadly refers to situations in which an explanatory variable is correlated with the error term. The distinction between endogenous and exogenous variables originated in simultaneous equations models, where one separates variables whose values are determined by the model from variables which are predetermined. Ignoring simultaneity in the estimation leads to biased estimates as it violates the exogeneity assumption of the Gauss–Markov theorem. The problem of endogeneity is often ignored by researchers conducting non-experimental research and doing so precludes making policy recommendations. Instrumental variable techniques are commonly used to mitigate this problem.
Panel (data) analysis is a statistical method, widely used in social science, epidemiology, and econometrics to analyze two-dimensional panel data. The data are usually collected over time and over the same individuals and then a regression is run over these two dimensions. Multidimensional analysis is an econometric method in which data are collected over more than two dimensions.
In statistics, Poisson regression is a generalized linear model form of regression analysis used to model count data and contingency tables. Poisson regression assumes the response variable Y has a Poisson distribution, and assumes the logarithm of its expected value can be modeled by a linear combination of unknown parameters. A Poisson regression model is sometimes known as a log-linear model, especially when used to model contingency tables.
In econometrics, the seemingly unrelated regressions (SUR) or seemingly unrelated regression equations (SURE) model, proposed by Arnold Zellner in (1962), is a generalization of a linear regression model that consists of several regression equations, each having its own dependent variable and potentially different sets of exogenous explanatory variables. Each equation is a valid linear regression on its own and can be estimated separately, which is why the system is called seemingly unrelated, although some authors suggest that the term seemingly related would be more appropriate, since the error terms are assumed to be correlated across the equations.
Nonparametric regression is a category of regression analysis in which the predictor does not take a predetermined form but is constructed according to information derived from the data. That is, no parametric equation is assumed for the relationship between predictors and dependent variable. Nonparametric regression requires larger sample sizes than regression based on parametric models because the data must supply the model structure as well as the parameter estimates.
In statistics, semiparametric regression includes regression models that combine parametric and nonparametric models. They are often used in situations where the fully nonparametric model may not perform well or when the researcher wants to use a parametric model but the functional form with respect to a subset of the regressors or the density of the errors is not known. Semiparametric regression models are a particular type of semiparametric modelling and, since semiparametric models contain a parametric component, they rely on parametric assumptions and may be misspecified and inconsistent, just like a fully parametric model.
The Heckman correction is a statistical technique to correct bias from non-randomly selected samples or otherwise incidentally truncated dependent variables, a pervasive issue in quantitative social sciences when using observational data. Conceptually, this is achieved by explicitly modelling the individual sampling probability of each observation together with the conditional expectation of the dependent variable. The resulting likelihood function is mathematically similar to the tobit model for censored dependent variables, a connection first drawn by James Heckman in 1974. Heckman also developed a two-step control function approach to estimate this model, which avoids the computational burden of having to estimate both equations jointly, albeit at the cost of inefficiency. Heckman received the Nobel Memorial Prize in Economic Sciences in 2000 for his work in this field.

In statistics, an errors-in-variables model or a measurement error model is a regression model that accounts for measurement errors in the independent variables. In contrast, standard regression models assume that those regressors have been measured exactly, or observed without error; as such, those models account only for errors in the dependent variables, or responses.
The methodology of econometrics is the study of the range of differing approaches to undertaking econometric analysis.
In econometrics, the Arellano–Bond estimator is a generalized method of moments estimator used to estimate dynamic models of panel data. It was proposed in 1991 by Manuel Arellano and Stephen Bond, based on the earlier work by Alok Bhargava and John Denis Sargan in 1983, for addressing certain endogeneity problems. The GMM-SYS estimator is a system that contains both the levels and the first difference equations. It provides an alternative to the standard first difference GMM estimator.
In statistics, a fixed-effect Poisson model is a Poisson regression model used for static panel data when the outcome variable is count data. Hausman, Hall, and Griliches pioneered the method in the mid 1980s. Their outcome of interest was the number of patents filed by firms, where they wanted to develop methods to control for the firm fixed effects. Linear panel data models use the linear additivity of the fixed effects to difference them out and circumvent the incidental parameter problem. Even though Poisson models are inherently nonlinear, the use of the linear index and the exponential link function lead to multiplicative separability, more specifically
In applied statistics, fractional models are, to some extent, related to binary response models. However, instead of estimating the probability of being in one bin of a dichotomous variable, the fractional model typically deals with variables that take on all possible values in the unit interval. One can easily generalize this model to take on values on any other interval by appropriate transformations. Examples range from participation rates in 401(k) plans to television ratings of NBA games.
Issues of heterogeneity in duration models can take on different forms. On the one hand, unobserved heterogeneity can play a crucial role when it comes to different sampling methods, such as stock or flow sampling. On the other hand, duration models have also been extended to allow for different subpopulations, with a strong link to mixture models. Many of these models impose the assumptions that heterogeneity is independent of the observed covariates, it has a distribution that depends on a finite number of parameters only, and it enters the hazard function multiplicatively.
A dynamic unobserved effects model is a statistical model used in econometrics for panel analysis. It is characterized by the influence of previous values of the dependent variable on its present value, and by the presence of unobservable explanatory variables.


