This article needs additional citations for verification . (March 2017) (Learn how and when to remove this template message) |
An Election to the Edinburgh Corporation was held on 6 May 1969, alongside municipal elections across Scotland. Of the councils 68 seats, 23 were up for election. [1]
Following the election, with two by-elections pending, Edinburgh Corporation was composed of 29 Progressives, 17 Labour councillors, 10 SNP councillors, 7 Conservatives, 2 Liberals, and 2 independents. The Conservatives in particular did well, gaining 4 councillors. Two of these gains were at the expense of Labour, in mainly working class wards. The SNP, in contrast, who had done so well at the previous election, only gained Sighthill. [1]
Following the election, the Progressives and Conservative coalition retained controlled of the council with a majority of 2. There was some friction between the two sides however, with the Conservatives unseating Mr Robert McLaughlin, the former leader of the Progressive group and the deputy chairman of the council for 7 years, in the St. Andrews ward. The Conservatives also gained Colinton, the seat of the retiring Lord Provost Brechin. The seat was not contested by the Progressives. [1] Most Progressive losses, with the exception of St. Andrews ward, were caused by incumbent Progressives stepping down and being replaced with new Conservative councillors. In Merchiston however the Conservative candidate was defeated, with the Liberals instead gaining the seat, meaning that the Liberals controlled 2 out of the 3 Merchiston ward seats. [1]
Sir Herbert Archbold Brechin was a British politician who served as Lord Provost of Edinburgh from 1966 to 1969.
Turnout was 114,582.
Party | Seats | Gains | Losses | Net gain/loss | Seats % | Votes % | Votes | +/− | |
---|---|---|---|---|---|---|---|---|---|
Progressives | 10 | 1 | 3 | 43.48 | 25.85 | 29,625 | |||
Labour | 6 | 0 | 5 | 26.09 | 19.68 | 22,548 | |||
Conservative | 4 | 4 | 0 | 17.39 | 14.91 | 17,086 | |||
SNP | 1 | 1 | 0 | 4.35 | 27.90 | 31,967 | |||
Liberal | 1 | 1 | 0 | 4.35 | 8.22 | 9,418 | |||
Independent | 1 | 0 | 0 | 4.35 | 2.73 | 3,124 | |||
Communist | 0 | 0 | 0 | 0 | 0.71 | 814 | |||
Party | Candidate | Votes | % | ± | |
---|---|---|---|---|---|
Progressives | H. G. P. Fraser | 2136 | |||
SNP | J. C. MacDougall | 1427 | |||
Liberal | J. J. Rickard | 731 | |||
Majority | 709 | ||||
Turnout | 36.06 | ||||
Progressives hold | Swing | ||||
Party | Candidate | Votes | % | ± | |
---|---|---|---|---|---|
Progressives | Josephine Dickson | 1901 | |||
Labour | J. S. Cook | 970 | |||
SNP | R. J. W. Swanson | 666 | |||
Majority | 931 | ||||
Turnout | 35.12 | ||||
Progressives hold | Swing | ||||
Party | Candidate | Votes | % | ± | |
---|---|---|---|---|---|
Labour | W. S. Dalgleish | 1967 | |||
Conservative | W. R. V. Percy | 1819 | |||
SNP | J. Deans | 1328 | |||
Majority | 148 | ||||
Turnout | 35.79 | ||||
SNP gain from Labour | Swing | ||||
Party | Candidate | Votes | % | ± | |
---|---|---|---|---|---|
Labour | R. A. Fox | 2179 | |||
SNP | T. Flemming | 1897 | |||
Communist | M. D'Arcy | 150 | |||
Majority | 282 | ||||
Turnout | 28.98 | ||||
Labour hold | Swing | ||||
Party | Candidate | Votes | % | ± | |
---|---|---|---|---|---|
Labour | A. Crichton | 1745 | |||
SNP | A. Stoddart | 938 | |||
Conservative | M. Doyle | 718 | |||
Communist | T. C. Taylor | 46 | |||
Majority | 807 | ||||
Turnout | 31.77 | ||||
Labour hold | Swing | ||||
Party | Candidate | Votes | % | ± | |
---|---|---|---|---|---|
Conservative | B. A. Meek | 4526 | 53.33 | ||
SNP | A. Westwood | 1938 | 22.83 | ||
Liberal | Geraldine R. Johnston | 1015 | 11.96 | ||
Labour | Mary Hutchison | 1008 | 11.88 | ||
Majority | 2588 | 30.49 | |||
Turnout | 8487 | 42.43 | |||
Conservative gain from Progressives | Swing | ||||
Party | Candidate | Votes | % | ± | |
---|---|---|---|---|---|
Progressives | Mary Robertson Murray | 4050 | 55.18 | ||
SNP | R. J. D. Scott | 1860 | 25.34 | ||
Liberal | Vera P. Heggie | 1430 | 19.48 | ||
Majority | 2190 | 29.84 | |||
Turnout | 7340 | 44.76 | |||
Progressives hold | Swing | ||||
Party | Candidate | Votes | % | ± | |
---|---|---|---|---|---|
Progressives | C. F. Murray | 1545 | 53.55 | ||
SNP | T. C. Bogle | 934 | 32.37 | ||
Liberal | Joan M. Gallacher | 406 | 14.07 | ||
Majority | 611 | 21.18 | |||
Turnout | 2885 | 30.09 | |||
Progressives hold | Swing | ||||
Party | Candidate | Votes | % | ± | |
---|---|---|---|---|---|
Conservative | M. Pirie | 1769 | |||
Labour | T. McGregor | 1401 | |||
SNP | A. B. Moore | 1096 | |||
Majority | 368 | ||||
Turnout | 31.97 | ||||
Conservative gain from Labour | Swing | ||||
Party | Candidate | Votes | % | ± | |
---|---|---|---|---|---|
Labour | O. Hand | 960 | |||
SNP | J. G. B. Henderson | 818 | |||
Communist | C. B. Swan | 173 | |||
Majority | 142 | ||||
Turnout | 27.08 | ||||
Labour hold | Swing | ||||
Party | Candidate | Votes | % | ± | |
---|---|---|---|---|---|
Conservative | A. H. Lester | 3218 | |||
Labour | F. M. Lawson | 3025 | |||
SNP | A. G. Symington | 2295 | |||
Majority | 193 | ||||
Turnout | 37.50 | ||||
Conservative gain from Labour | Swing | ||||
Party | Candidate | Votes | % | ± | |
---|---|---|---|---|---|
Liberal | J. G. Gray | 2613 | |||
Conservative | C. H. Richards | 1855 | |||
SNP | N. B. Harris | 644 | |||
Majority | 758 | ||||
Turnout | 45.77 | ||||
Liberal gain from Progressives | Swing | ||||
Party | Candidate | Votes | % | ± | |
---|---|---|---|---|---|
Progressives | J. Bateman | 3316 | |||
Liberal | G. Duke | 1192 | |||
SNP | Bethia L. Howden | 896 | |||
Majority | 2124 | ||||
Turnout | 41.99 | ||||
Progressives hold | Swing | ||||
Party | Candidate | Votes | % | ± | |
---|---|---|---|---|---|
Progressives | H. Macpherson | 5078 | |||
SNP | W. R. Platt | 2000 | |||
Labour | I. M. Christie | 914 | |||
Majority | 3078 | ||||
Turnout | 40.14 | ||||
Progressives hold | Swing | ||||
Party | Candidate | Votes | % | ± | |
---|---|---|---|---|---|
Independent | J. D. Kidd | 3124 | |||
SNP | G. Telford | 1819 | |||
Liberal | W. McLeod | 1088 | |||
Labour | G. C. Campbell | 778 | |||
Majority | 1305 | ||||
Turnout | 44.17 | ||||
Independent hold | Swing | ||||
Party | Candidate | Votes | % | ± | |
---|---|---|---|---|---|
Labour | R. W. Irvine | 1639 | |||
SNP | W. Thomson | 1542 | |||
Conservative | R. Beattie | 1012 | |||
Communist | C. McManus | 163 | |||
Majority | 97 | ||||
Turnout | 22.58 | ||||
Labour hold | Swing | ||||
Party | Candidate | Votes | % | ± | |
---|---|---|---|---|---|
Progressives | K. W. Borthwick | 3143 | |||
SNP | R. G. Kelly | 2044 | |||
Labour | J. E. Boyack | 792 | |||
Majority | 1099 | ||||
Turnout | 43.83 | ||||
Progressives hold | Swing | ||||
Party | Candidate | Votes | % | ± | |
---|---|---|---|---|---|
Progressives | C. Waugh | 1798 | |||
SNP | J. S. Marshall | 1681 | |||
Labour | Sheila King Murray | 1557 | |||
Majority | 117 | ||||
Turnout | 39.79 | ||||
Progressives gain from Labour | Swing | ||||
Party | Candidate | Votes | % | ± | |
---|---|---|---|---|---|
Conservative | I. A. Crammond | 1467 | 57.78 | ||
SNP | D. M. Miller | 625 | 24.62 | ||
Progressives | R. McLaughlin | 447 | 17.61 | ||
Majority | 842 | 33.16 | |||
Turnout | 2539 | 33.5 | |||
Conservative gain from Progressives | Swing | ||||
Party | Candidate | Votes | % | ± | |
---|---|---|---|---|---|
Progressives | D. A. Adamson | 3037 | |||
SNP | W. K. Archibald | 968 | |||
Liberal | W. Murray | 943 | |||
Labour | T. H. Greig | 584 | |||
Majority | 2069 | ||||
Turnout | 32.85 | ||||
Progressives hold | Swing | ||||
Party | Candidate | Votes | % | ± | |
---|---|---|---|---|---|
Labour | J. McInally | 1036 | |||
SNP | A. A. Edmonds | 842 | |||
Conservative | A. J. A. Bell | 702 | |||
Majority | 194 | ||||
Turnout | 27.67 | ||||
Labour hold | Swing | ||||
Party | Candidate | Votes | % | ± | |
---|---|---|---|---|---|
SNP | K. D. A. Johnston | 2481 | 52.17 | ||
Labour | G. Foulkes | 1993 | 41.90 | ||
Communist | W. Millar | 282 | 5.93 | ||
Majority | 488 | 10.26 | |||
Turnout | 4756 | 30.05 | |||
SNP gain from Labour | Swing | ||||
Party | Candidate | Votes | % | ± | |
---|---|---|---|---|---|
Progressives | B. W. Lyle | 3174 | 72.10 | ||
SNP | T. J. D. MacDonald | 1228 | 27.90 | ||
Majority | 1946 | 44.21 | |||
Turnout | 4402 | 40.15 | |||
Progressives hold | Swing | ||||
Aberdeen City Council represents the Aberdeen City council area of Scotland.
Liverpool City Council is the governing body for the city of Liverpool in Merseyside, England. It consists of 90 councillors, three for each of the city's 30 wards.
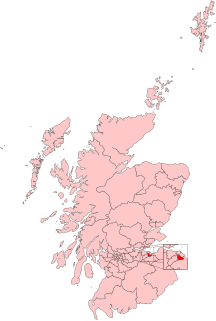
Edinburgh South is a constituency of the House of Commons of the UK Parliament created in 1885. The constituency has been represented by the Labour Party's Ian Murray since 2010. Murray was the only Labour MP in Scotland to retain his seat at the 2015 general election, and did so with an increased majority, where he result rendered it the 23rd-most marginal Labour seat by percentage of majority nationwide.
Elections to the Borough Council in Slough, England, were held on 1 May 2008. This was the 123rd Slough general local authority election since Slough became a local government unit in 1863.
The 2007 Hull City Council election took place on 3 May 2007 to elect members of Hull City Council in England. One third of the council was up for election and the Liberal Democrats gained overall control of the council from no overall control. Overall turnout was 27%.
The 2012 Scottish local elections, were held on 3 May, in all 32 local authorities. The Scottish National Party (SNP) overtook Labour to win the highest share of the vote, and retained and strengthened its position as the party with most councillors. Labour also made gains, while the Liberal Democrats experienced meltdown, falling behind the Conservatives. For the first time since the introduction of the Single Transferable Vote system, the SNP won majority control of 2 councils, from no overall control. Labour also won majority control of 2 councils from no overall control, while retaining majority control over 2 councils.
The second Guildford Borough Council full-council elections were held on 6 May 1976. The Conservatives retained control of the council with an increased majority, winning 35 of the 45 seats.
The 2011 council elections in Guildford saw the Conservatives retain control over Guildford Borough Council with an increased majority of 20 seats. Full results for each ward can be found at Guildford Council election, full results, 2011.
Elections to Glasgow City Council were held on 3 May 2012, the same day as the other Scottish local government elections. The election was the second using 21 new wards created as a results of the Local Governance (Scotland) Act 2004, each ward elected three or four councillors using the single transferable vote system a form of proportional representation.
Elections to East Lothian Council were held on 3 May 2012, on the same day as the other Scottish local government elections. The election used the 7 wards created as a result of the Local Governance (Scotland) Act 2004, with each ward electing three or four councillors using the single transferable vote system a form of proportional representation, with 23 councillors elected.
The 2017 Scottish local elections were held on Thursday 4 May, in all 32 local authorities. The SNP retained its position as the largest party in terms of votes and councillors, despite suffering minor losses. The Conservatives made gains and displaced Labour as the second largest party, while the Liberal Democrats suffered a net loss of councillors despite increasing their share of the vote. Minor parties and independents polled well; and independent councillors retained majority control over the 3 island councils. For the first time since the local government reforms in 1995, all councils fell under no overall control.
The 2003 South Kesteven District Council election took place on 1 May 2003 to elect members of South Kesteven District Council in Lincolnshire, England. The whole council was up for election and the Conservative party gained control of the council from no overall control.
An Election to the Edinburgh Corporation was held on 7 May 1968, alongside municipal elections across Scotland. Of the councils 68 seats, 22 were up for election. Despite receiving the most votes of any single party, the SNP won only 7 seats. Unlike in Glasgow, the Progressives and Conservatives did not run on a joint ticket. Despite that however the parties only ran competing candidates in the Gorgie-Dalry ward.
An Election to the Edinburgh Corporation was held on 2 May 1972, alongside municipal elections across Scotland. Of the councils 69 seats, 23 were up for election.
An Election to the Edinburgh Corporation was held on 1 May 1973, alongside municipal elections across Scotland. Of the councils 69 seats, 26 were up for election. Labour, despite needing only 1 gain to take control of the council, failed to do so, preventing them from a historic win.
An Election to Glasgow City Council was held on 6 May 1969, alongside municipal elections across Scotland. Of the councils 111 seats, 37 were up for election. The election saw Labour losing its majority, with the council being gained by a Progressive-Conservative alliance, who emerged from the election with a total of 57 of the council's 111 seats.
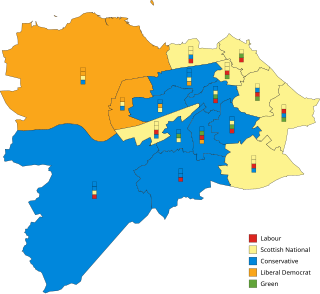
The most recent elections to the City of Edinburgh Council were held on Thursday 4 May 2017, on the same day as the 31 other local authorities in Scotland. It was the third successive Local Council election to run under the single transferable vote (STV) electoral system.
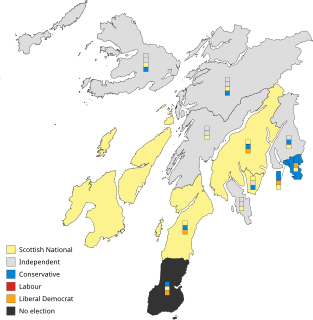
The 2017 Argyll and Bute Council elections took place on 4 May 2017 alongside local elections across Scotland. This was the third local election to take place using the Single Transferable Vote electoral system.
Elections to East Dunbartonshire Council were held on Thursday 4 May, the same day as the 31 other local authorities in Scotland. The election used seven wards created under the Local Governance (Scotland) Act 2004, a reduction of one from 2012, with 22 Councillors being elected, 2 fewer overall. Each ward elected either 3 or 4 members, using the STV electoral system.
Elections to Stirling Council were held on 4 May 2017, the same day as the 31 other local authorities in Scotland. The election used the seven wards created under the Local Governance (Scotland) Act 2004, with 23 councillors being elected, an increase of 1 from 2012. Each ward elected either 3 or 4 members, using the STV electoral system. Following the Fifth Electoral Review by the Local Government Boundary Commission for Scotland, minor changes were made to several of the ward boundaries and one additional Councillor was added moving the total number of Councillors from twenty-two to twenty-three.