| |||||||||||||||||||||||||||||||||||||||||||||||||||||||||||||
All 58 seats to Edinburgh City Council 30 seats needed for a majority | |||||||||||||||||||||||||||||||||||||||||||||||||||||||||||||
| |||||||||||||||||||||||||||||||||||||||||||||||||||||||||||||
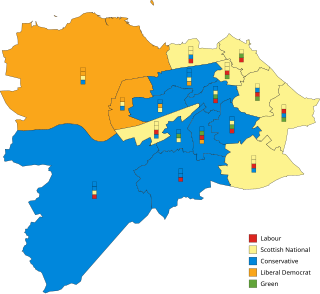
Map of council wards |
Elections to the City of Edinburgh Council were held on 3 May 2007 the same day as the Scottish Parliament general election. The election was the first one using 17 new wards created as a results of the Local Governance (Scotland) Act 2004, each ward will elect three or four councillors using the single transferable vote system a form of proportional representation. [1] The new wards replace 58 single-member wards which used the plurality (first past the post) system of election.
The Scottish Parliament is the devolved unicameral legislature of Scotland. Located in the Holyrood area of the capital city, Edinburgh, it is frequently referred to by the metonym Holyrood.
The Local Governance (Scotland) Act 2004 is an Act of the Scottish Parliament which provided, amongst other things, for the election of councillors to the local authorities in Scotland by the single transferable vote system.
Party | Seats | Gains | Losses | Net gain/loss | Seats % | Votes % | Votes | +/− | |
---|---|---|---|---|---|---|---|---|---|
Liberal Democrats | 17 | N/A | N/A | +2 | 29.31 | 21.99 | 42,657 | -5.00 | |
Labour | 15 | N/A | N/A | -15 | 25.86 | 22.93 | 44,489 | -4.75 | |
SNP | 12 | N/A | N/A | +12 | 20.69 | 20.32 | 39,431 | +4.60 | |
Conservative | 11 | N/A | N/A | -1 | 18.97 | 22.08 | 42,840 | -1.91 | |
Scottish Green | 3 | N/A | N/A | +3 | 5.17 | 8.23 | 15,959 | +8.23 | |
Scottish Socialist | 0 | N/A | N/A | ±0 | 0.00 | 1.07 | 2,077 | -3.10 | |
Solidarity | 0 | N/A | N/A | ±0 | 0.00 | 0.85 | 1,651 | +0.85 | |
Liberal | 0 | N/A | N/A | ±0 | 0.00 | 0.63 | 1,221 | +0.42 | |
Independent | 0 | N/A | N/A | ±0 | 0.00 | 1.90 | 3,681 | +0.70 | |
Ward | % | Cllrs | % | Cllrs | % | Cllrs | % | Cllrs | % | Cllrs | % | Cllrs | Total Cllrs |
---|---|---|---|---|---|---|---|---|---|---|---|---|---|
Lib Dem | Lab | SNP | Conservative | Green | Others | ||||||||
Almond | 36.6 | 1 | 10.7 | 0 | 18.2 | 1 | 28.1 | 1 | 4.4 | 0 | 1.2 | 0 | 3 |
Pentland Hills | 11.4 | 0 | 19.5 | 1 | 20.3 | 1 | 41.7 | 1 | 4.3 | 0 | 2.0 | 0 | 3 |
Drum Brae/Gyle | 44.8 | 2 | 14.8 | 0 | 18.4 | 1 | 16.1 | 0 | 3.2 | 0 | 1.6 | 0 | 3 |
Forth | 17.9 | 1 | 29.0 | 1 | 22.7 | 1 | 20.2 | 1 | 5.8 | 0 | 4.4 | 0 | 4 |
Inverleith | 20.2 | 1 | 18.2 | 1 | 13.3 | 1 | 27.6 | 1 | 7.5 | 0 | 11.2 | 0 | 4 |
Corstorphine/Murrayfield | 37.7 | 2 | 15.2 | 0 | 14.9 | 0 | 25.7 | 1 | 4.8 | 0 | 2.7 | 0 | 3 |
Sighthill/Gorgie | 10.6 | 1 | 35.3 | 2 | 30.9 | 1 | 9.6 | 0 | 5.7 | 0 | 6.0 | 0 | 4 |
Colinton/Fairmilehead | 14.8 | 0 | 18.7 | 1 | 14.9 | 0 | 45.7 | 2 | 4.2 | 0 | 0.6 | 0 | 3 |
Fountainbridge/Craiglockhart | 17.1 | 1 | 22.6 | 1 | 18.6 | 0 | 27.1 | 1 | 11.2 | 0 | 2.4 | 0 | 3 |
Meadows/Morningside | 30.8 | 1 | 14.0 | 1 | 10.5 | 0 | 26.4 | 1 | 15.2 | 1 | 1.4 | 0 | 4 |
City Centre | 19.7 | 1 | 17.9 | 0 | 20.3 | 1 | 20.1 | 1 | 16.8 | 0 | 4.4 | 0 | 3 |
Leith Walk | 19.0 | 1 | 26.9 | 1 | 22.3 | 1 | 9.7 | 0 | 15.3 | 1 | 3.4 | 0 | 4 |
Leith | 21.8 | 1 | 26.8 | 1 | 27.4 | 1 | 7.1 | 0 | 11.2 | 0 | 4.2 | 0 | 3 |
Craigentinny/Duddingston | 10.0 | 1 | 34.2 | 1 | 29.2 | 1 | 14.4 | 0 | 5.9 | 0 | 5.0 | 0 | 3 |
Southside/Newington | 31.0 | 1 | 18.6 | 1 | 13.1 | 0 | 18.5 | 1 | 14.1 | 1 | 2.7 | 0 | 4 |
Liberton/Gilmerton | 14.2 | 1 | 34.7 | 2 | 26.0 | 1 | 14.3 | 0 | 3.5 | 0 | 5.1 | 0 | 4 |
Portobello/Craigmillar | 08.3 | 1 | 30.8 | 1 | 28.0 | 1 | 11.0 | 0 | 6.7 | 0 | 13.2 | 0 | 3 |
Total | 22.0 | 17 | 22.9 | 15 | 20.3 | 12 | 22.1 | 11 | 8.2 | 3 | 4.5 | 0 | 58 |
2007 Council election: Almond | ||||||||||
---|---|---|---|---|---|---|---|---|---|---|
Party | Candidate | % 1st Pref | Count 1 | Count 2 | Count 3 | Count 4 | Count 5 | Count 6 | Count 7 | |
Conservative | Kate Mackenzie | 28.1 | 3,352 | |||||||
Liberal Democrats | George Grubb | 23.6 | 2,809 | 2,864.78 | 2,884.14 | 3,076.36 | ||||
SNP | Norman Work | 18.2 | 2,164 | 2,193.84 | 2,219.08 | 2,325.21 | 2,341.37 | 2,568.21 | 3,300.77 | |
Liberal Democrats | Neil MacLean | 13.0 | 1,548 | 1,654.82 | 1,664.94 | 1,761.03 | 1,823.11 | 2,351.21 | ||
Labour | John Longstaff | 10.7 | 1,280 | 1,298.24 | 1,317.36 | 1,382.61 | 1,399.23 | |||
Scottish Green | Jill Boulton | 4.4 | 520 | 548.42 | 586.54 | |||||
Scottish Socialist | Ross Clark | 1.2 | 144 | 145.42 | ||||||
Electorate: 18,779 Valid: 11,817 Spoilt: 104 Quota: 2,955 Turnout: 62.93% |
2007 Council election: Pentland Hills | |||||||||
---|---|---|---|---|---|---|---|---|---|
Party | Candidate | % 1st Pref | Count 1 | Count 2 | Count 3 | Count 4 | Count 5 | Count 6 | |
Conservative | Alastair S Paisley | 22.9 | 2,523 | 2,532 | 2,536 | 2,565 | 2,718 | 4,401 | |
SNP | Ronald Cairns | 20.3 | 2,238 | 2,247 | 2,274 | 2,374 | 2,661 | 2,789 | |
Labour | Ricky Henderson | 19.5 | 2,148 | 2,161 | 2,181 | 2,263 | 2,663 | 2,798 | |
Conservative | Andy MacIver | 18.8 | 2,074 | 2,081 | 2,084 | 2,113 | 2,285 | ||
Liberal Democrats | Iain J Coleman | 11.4 | 1,255 | 1,281 | 1,299 | 1,471 | |||
Scottish Green | Shonagh McEwan | 4.3 | 479 | 488 | 518 | ||||
Scottish Socialist | Alister H Black | 1.1 | 116 | 117 | |||||
Liberal | Irvine McMinn | 0.9 | 94 | ||||||
Electorate: 17,390 Valid: 10,927 Spoilt: 104 Quota: 2,732 Turnout: 62.83% |
2007 Council election: Drum Brae/Gyle Ward | |||||||||||
---|---|---|---|---|---|---|---|---|---|---|---|
Party | Candidate | % 1st Pref | Count 1 | Count 2 | Count 3 | Count 4 | Count 5 | Count 6 | Count 7 | Count 8 | |
Liberal Democrats | Robert Aldridge | 25.2 | 2,630 | ||||||||
Liberal Democrats | Jenny Dawe | 19.6 | 2,049 | 2,078.99 | 2,100.27 | 2,113.31 | 2,234.21 | 2,702.55 | |||
SNP | Colin G Keir | 18.4 | 1,917 | 1,920.20 | 1,939.32 | 1,956.32 | 2,018.71 | 2,263.43 | 2,287.23 | 2,725.43 | |
Conservative | Steven Binney | 16.1 | 1,676 | 1,679.60 | 1,684.67 | 1,687.67 | 1,716.86 | 1,865.21 | 1,889.87 | ||
Labour | Cameron Day | 14.8 | 1,545 | 1,549.01 | 1,559.12 | 1,576.19 | 1,631.28 | ||||
Scottish Green | Fiona A Paterson | 3.2 | 330 | 331.94 | 337.99 | 361.09 | |||||
Scottish Socialist | Iain Pendreich | 0.8 | 88 | 88.24 | 89.26 | ||||||
Liberal | Roy Isserlis | 0.8 | 85 | 85.84 | |||||||
Electorate: 17,364 Valid: 10,320 Spoilt: 113 Quota: 2,581 Turnout: 60.1% |
2007 Council election: Forth | ||||||||||||
---|---|---|---|---|---|---|---|---|---|---|---|---|
Party | Candidate | % 1st Pref | Count 1 | Count 2 | Count 3 | Count 4 | Count 5 | Count 6 | Count 7 | Count 8 | Count 9 | |
SNP | Steve Cardownie | 22.67 | 2,472 | |||||||||
Conservative | Allan Jackson | 20.23 | 2,206 | |||||||||
Liberal Democrats | Elaine P Morris† | 17.91 | 1,953 | 2,000.44 | 2,008.23 | 2,020.41 | 2,059.83 | 2,094.96 | 2,436.61 | |||
Labour | Elizabeth Maginnis | 14.82 | 1,616 | 1,640.13 | 1,642.50 | 1,650.86 | 1,676.12 | 1,694.00 | 1,795.54 | 1,856.72 | 3,100.78 | |
Labour | Billy Fitzpatrick | 14.19 | 1,547 | 1,581.61 | 1,582.56 | 1,588.91 | 1,612.69 | 1,672.18 | 1,755.67 | 1,797.68 | ||
Scottish Green | Kate Joester | 5.75 | 627 | 670.55 | 672.98 | 698.89 | 744.24 | 822.04 | ||||
Independent | Fred Marinello | 1.84 | 201 | 217.44 | 218.71 | 225.06 | ||||||
Solidarity | Willie Black | 1.81 | 197 | 227.49 | 227.70 | 246.67 | 270.03 | |||||
Scottish Socialist | Marilyn Sangster | 0.77 | 84 | 92.95 | 93.03 | |||||||
Electorate: 20,744 Valid: 10,903 Spoilt: 180 Quota: 2,181 Turnout: 53.4% |
2007 Council election: Inverleith | ||||||||||||||
---|---|---|---|---|---|---|---|---|---|---|---|---|---|---|
Party | Candidate | % 1st Pref | Count 1 | Count 2 | Count 3 | Count 4 | Count 5 | Count 6 | Count 7 | Count 8 | Count 9 | Count 10 | Count 11 | |
Labour | Lesley A Hinds | 18.2 | 2,689 | 2,706 | 2,714 | 2,724 | 2,743 | 2,904 | 3,025 | |||||
Conservative | Lindsay Paterson | 14.1 | 2,085 | 2,087 | 2,089 | 2,102 | 2,114 | 2,166 | 2,284 | 2,288.52 | 2,411.12 | 2,449.96 | ||
Conservative | Iain Whyte | 13.5 | 1,986 | 1,986 | 1,988 | 1,999 | 1,999 | 2,022 | 2,346 | 2,349.91 | 2,465.52 | 2,498.29 | 4,277.64 | |
SNP | Stuart McIvor | 13.3 | 1,961 | 1,970 | 1,990 | 2,010 | 2,036 | 2,239 | 2,406 | 2,418.74 | 2,563.85 | 2,614.11 | 2,729.02 | |
Liberal Democrats | Tim McKay | 11.1 | 1,644 | 1,648 | 1,656 | 1,666 | 1,710 | 2,020 | 2,223 | 2,246.26 | 3,269.54 | |||
Liberal Democrats | Tom Ponton | 9.1 | 1,339 | 1,340 | 1,347 | 1,355 | 1,376 | 1,529 | 1,744 | 1,755.80 | ||||
Independent | Kristina Woolnough | 9.0 | 1,323 | 1,324 | 1,329 | 1,364 | 1,367 | 1,449 | ||||||
Scottish Green | Melanie A M Main | 7.5 | 1,113 | 1,135 | 1,165 | 1,177 | 1,192 | |||||||
Liberal | Seumas MacMhicean | 1.0 | 148 | 151 | 151 | 162 | ||||||||
Independent | John Y Anderson | 0.9 | 129 | 131 | 134 | |||||||||
Solidarity | Raymond Watt | 0.7 | 103 | 117 | ||||||||||
Scottish Socialist | Sean H Donnelly | 0.6 | 92 | |||||||||||
Electorate: 22,903 Valid: 14,612 Spoilt: 138 Quota: 2,923 Turnout: 64.4% |
2007 Council election: Corstorphine/Murrayfield | ||||||||||
---|---|---|---|---|---|---|---|---|---|---|
Party | Candidate | % 1st Pref | Count 1 | Count 2 | Count 3 | Count 4 | Count 5 | Count 6 | Count 7 | |
Conservative | Jeremy Balfour | 25.7 | 2,972 | |||||||
Liberal Democrats | Paul Edie | 21.1 | 2,444 | 2,474.88 | 2,481.88 | 2,633.48 | 3,046.01 | |||
Liberal Democrats | Phil Wheeler | 16.6 | 1,915 | 1,927.83 | 1,936.87 | 2,054.48 | 2,459.35 | 2,578.54 | 3,536.57 | |
Labour | Daniel Donaldson | 15.2 | 1,757 | 1,762.90 | 1,773.90 | 1,863.38 | 2,136.86 | 2,164.33 | ||
SNP | Robin J A MacCormick | 14.9 | 1,727 | 1,734.77 | 1,750.92 | 1,852.76 | ||||
Scottish Green | Charles Kennedy | 4.8 | 556 | 565.68 | 582.75 | |||||
Scottish Socialist | Andrew Weir | 0.7 | 80 | 80.29 | ||||||
Electorate: 17,531 Valid: 11,451 Spoilt: 119 Quota: 2,863 Turnout: 66.0% |
2007 Council election: Sighthill/Gorgie | ||||||||||||
---|---|---|---|---|---|---|---|---|---|---|---|---|
Party | Candidate | % 1st Pref | Count 1 | Count 2 | Count 3 | Count 4 | Count 5 | Count 6 | Count 7 | Count 8 | Count 9 | |
SNP | Nick Elliott-Canon | 30.9 | 3,785 | |||||||||
Labour | Eric Milligan | 26.0 | 3,185 | |||||||||
Liberal Democrats | Joanna Toomey | 10.6 | 1,300 | 1,510.76 | 1,562.88 | 1,581.62 | 1,612.21 | 1,649.38 | 1,713.14 | 2,158.92 | 2,618.40 | |
Conservative | Iain G Gibson | 9.6 | 1,180 | 1,257.57 | 1,271.31 | 1,285.52 | 1,296.09 | 1,341.93 | 1,358.27 | 1,432.83 | ||
Labour | Donald C Wilson | 9.3 | 1,142 | 1,270.43 | 1,718.61 | 1,746.99 | 1,769.54 | 1,810.64 | 1,877.65 | 2,027.13 | 2,158.60 | |
Scottish Green | James N G Mackenzie | 5.7 | 702 | 891.91 | 919.34 | 941.22 | 1,007.12 | 1,063.20 | 1,172.87 | |||
Solidarity | Jason J Mangan | 1.9 | 238 | 349.60 | 362.97 | 368.67 | 431.73 | 463.41 | ||||
Independent | Keith J Bell | 1.7 | 209 | 289.50 | 300.63 | 334.49 | 347.87 | |||||
Scottish Socialist | Gerry Corbett | 1.4 | 168 | 249.96 | 263.70 | 267.17 | ||||||
Independent | Tam Smith | 1.0 | 127 | 156.27 | 164.33 | |||||||
Electorate: 24,717 Valid: 11,996 Spoilt: 236 Quota: 2,400 Turnout: 49.5% |
2007 Council election: Colinton/Fairmilehead | |||||||||
---|---|---|---|---|---|---|---|---|---|
Party | Candidate | % 1st Pref | Count 1 | Count 2 | Count 3 | Count 4 | Count 5 | Count 6 | |
Conservative | Elaine Aitken | 23.1 | 2,877 | 2,878 | 2,907 | 3,111 | |||
Conservative | Jason Rust | 22.6 | 2,815 | 2,816 | 2,844 | 2,994 | 3,012.70 | 3,595.21 | |
Labour | Eric Barry | 18.7 | 2,332 | 2,41 | 2,442 | 2,758 | 2,760.15 | 3,639.03 | |
SNP | Thomas Kielty | 14.9 | 1,861 | 1,881 | 1,983 | ||||
Liberal Democrats | Stuart Bridges | 14.8 | 1,842 | 1,845 | 2,020 | 2,589 | 2,593.21 | ||
Scottish Green | Alastair J Tibbitt | 4.2 | 517 | 546 | |||||
Scottish Socialist | Robert Mathie | 0.6 | 80 | ||||||
Electorate: 18,413 Valid: 12,324 Spoilt: 132 Quota: 3,082 Turnout: 67.6% |
2007 Council election: Fountainbridge/Craiglockhart | ||||||||||
---|---|---|---|---|---|---|---|---|---|---|
Party | Candidate | % 1st Pref | Count 1 | Count 2 | Count 3 | Count 4 | Count 5 | Count 6 | Count 7 | |
Conservative | Gordon Buchan | 27.1 | 2,729 | |||||||
Labour | Andrew Burns | 22.6 | 2,272 | 2,297.42 | 2,308.51 | 2,327.68 | 2,568.58 | |||
SNP | Denis C Dixon | 18.6 | 1,875 | 1,900.25 | 1,919.42 | 1,948.60 | 2,157.10 | 2,169.89 | ||
Liberal Democrats | Jim Lowrie | 17.1 | 1,725 | 1,799.83 | 1,811.09 | 1,843.70 | 2,357.16 | 2,387.72 | 3,430.41 | |
Scottish Green | Jeni MacKay | 11.2 | 1,123 | 1,146.09 | 1,165.35 | 1,215.70 | ||||
Solidarity | Anne Edmonds | 1.4 | 142 | 143.64 | 163.90 | |||||
Scottish Socialist | Barbara J Scott | 1.0 | 105 | 106.90 | ||||||
Electorate: 16,800 Valid: 9,970 Spoilt: 87 Quota: 2,493 Turnout: 59.9% |
2007 Council election: Meadows/Morningside | ||||||||||||
---|---|---|---|---|---|---|---|---|---|---|---|---|
Party | Candidate | % 1st Pref | Count 1 | Count 2 | Count 3 | Count 4 | Count 5 | Count 6 | Count 7 | Count 8 | Count 9 | |
Conservative | Mark McInnes | 26.4 | 3,844 | |||||||||
Liberal Democrats | Marilyne Angela MacLaren | 19.3 | 2,817 | 3,021.25 | ||||||||
Scottish Green | Alison Johnstone | 15.2 | 2,209 | 2,309.16 | 2,329.46 | 2,353.12 | 2,386.31 | 2,477.31 | 3,070.46 | |||
Labour | Paul Godzik | 14.0 | 2,043 | 2,108.95 | 2,122.35 | 2,126.64 | 2,142.19 | 2,168.09 | 2,358.63 | 2,396.23 | 3,103.04 | |
Liberal Democrats | Sue Tritton | 11.5 | 1,683 | 1,811.71 | 1,879.14 | 1,889.71 | 1,927.65 | 1,937.82 | 2,235.48 | 2,301.73 | ||
SNP | Richard Lewis | 10.5 | 1,529 | 1,584.86 | 1,592.03 | 1,609.31 | 1,624.52 | 1,649.46 | ||||
Scottish Socialist | Helga Janzen | 0.9 | 137 | 139.71 | 140.51 | 179.76 | 184.00 | |||||
Solidarity | Pat Smith | 0.8 | 122 | 125.94 | 126.40 | |||||||
Independent | Duncan Thorp | 0.7 | 105 | 151.76 | 152.93 | 157.98 | ||||||
Electorate: 23,263 Valid: 14,489 Spoilt: 83 Quota: 2,898 Turnout: 62.6% |
2007 Council election: City Centre | |||||||||||
---|---|---|---|---|---|---|---|---|---|---|---|
Party | Candidate | % 1st Pref | Count 1 | Count 2 | Count 3 | Count 4 | Count 5 | Count 6 | Count 7 | Count 8 | |
SNP | David Beckett | 20.3 | 1,630 | 1,644 | 1,661 | 1,688 | 1,983 | 2,027.02 | |||
Conservative | Joanna Mowat | 20.1 | 1,614 | 1,628 | 1,665 | 1,670 | 1,742 | 1,783.63 | 1,788.75 | 2,221.13 | |
Liberal Democrats | Charles C Dundas | 19.7 | 1,587 | 1,605 | 1,627 | 1,637 | 2,225 | ||||
Labour | Bill Cunningham | 17.9 | 1,437 | 1,446 | 1,454 | 1,468 | 1,705 | 1,774.35 | 1,782.67 | ||
Scottish Green | Gavin N Corbett | 16.8 | 1,352 | 1,363 | 1,384 | 1,450 | |||||
Scottish Socialist | Catriona Grant | 1.8 | 142 | 143 | 146 | ||||||
Independent | Brian R Ferrier | 1.6 | 130 | 133 | |||||||
Liberal | Karen M Hetherington | 1.0 | 83 | ||||||||
Electorate: 15,829 Valid: 7,975 Spoilt: 73 Quota: 1,994 Turnout: 50.8% |
2007 Council election: Leith Walk | |||||||||||||
---|---|---|---|---|---|---|---|---|---|---|---|---|---|
Party | Candidate | % 1st Pref | Count 1 | Count 2 | Count 3 | Count 4 | Count 5 | Count 6 | Count 7 | Count 8 | Count 9 | Count 10 | |
SNP | Deidre Brock | 22.3 | 2,550 | ||||||||||
Liberal Democrats | Louise A Lang | 19.0 | 2,170 | 2,217.17 | 2,217.29 | 2,240.22 | 2,291.06 | ||||||
Labour | Angela Blacklock | 16.9 | 1,937 | 1,965.54 | 1,966.54 | 1,975.35 | 1,997.40 | 2,003.09 | 2,041.43 | 2,173.28 | 2,215.25 | 3,161.41 | |
Scottish Green | Maggie Chapman | 15.3 | 1,754 | 1,824.81 | 1,829.81 | 1,911.26 | 1,953.36 | 1,967.18 | 2,103.10 | 2,424.74 | |||
Labour | Trevor Davies | 10.0 | 1,144 | 1,156.81 | 1,156.81 | 1,165.28 | 1,180.09 | 1,183.88 | 1,196.35 | 1,312.35 | 1,333.29 | ||
Conservative | Iain McGill | 9.7 | 1,114 | 1,129.49 | 1,133.61 | 1,133.96 | 1,149.24 | 1,154.49 | 1,162.67 | ||||
Solidarity | Adrian Cannon | 1.8 | 203 | 228.16 | 230.27 | 273.069 | 283.23 | 284.33 | |||||
Liberal | John Hein | 1.7 | 193 | 207.33 | 207.44 | 211.02 | |||||||
Scottish Socialist | Linda Somerville | 1.6 | 182 | 192.95 | 193.06 | ||||||||
Independent | Peter Clifford | 0.1 | 16 | 16.58 | |||||||||
Electorate: 21,485 Valid: 11,263 Spoilt: 188 Quota: 2,253 Turnout: 53.3% |
2007 Council election: Leith | ||||||||||
---|---|---|---|---|---|---|---|---|---|---|
Party | Candidate | % 1st Pref | Count 1 | Count 2 | Count 3 | Count 4 | Count 5 | Count 6 | Count 7 | |
SNP | Rob Munn | 27.4 | 2,333 | |||||||
Liberal Democrats | Marjorie Thomas | 21.8 | 1,854 | 1,891.37 | 1,912.39 | 1,976.82 | 2,191.85 | |||
Labour | Gordon Munro | 18.1 | 1,544 | 1,569.18 | 1,586.49 | 1,617.60 | 1,694.31 | 1,705.06 | 2,243.18 | |
Scottish Green | Chas Booth | 11.2 | 957 | 1,010.38 | 1,090.54 | 1,132.27 | 1,205.39 | 1,238.08 | 1,325.58 | |
Labour | Matthew Wilson | 8.7 | 741 | 751.27 | 763.58 | 778.09 | 801.59 | 818.81 | ||
Conservative | Andrew Robertson | 7.1 | 604 | 614.37 | 616.18 | 632.39 | ||||
Liberal | Joseph Hill | 2.4 | 208 | 224.62 | 234.93 | |||||
Scottish Socialist | Grzegorz J Rybak | 1.8 | 150 | 169.14 | ||||||
Electorate: 16,178 Valid: 8,391 Spoilt: 124 Quota: 2,098 Turnout: 52.6% |
2007 Council election: Craigentinny/Duddingston | ||||||||||||||
---|---|---|---|---|---|---|---|---|---|---|---|---|---|---|
Party | Candidate | % 1st Pref | Count 1 | Count 2 | Count 3 | Count 4 | Count 5 | Count 6 | Count 7 | Count 8 | Count 9 | Count 10 | Count 11 | |
Labour | Ewan Aitken | 29.2 | 3,487 | |||||||||||
SNP | Stefan Tymkewycz | 29.2 | 3,484 | |||||||||||
Conservative | Victoria Roberts | 14.4 | 1,720 | 1,741.18 | 1,787.05 | 1,793.61 | 1,795.76 | 1,809.50 | 1,828.19 | 1,843.14 | 1,899.42 | 1,966.96 | ||
Liberal Democrats | Gary J Peacock | 10.0 | 1,190 | 1,228.77 | 1,308.59 | 1,318.99 | 1,323.01 | 1,341.42 | 1,413.95 | 1,447.78 | 1,607.02 | 2,087.98 | 2,706.74 | |
Scottish Green | Stan Blackley | 5.9 | 701 | 741.64 | 819.14 | 824.00 | 854.96 | 884.39 | 913.46 | 1,012.66 | 1,184.22 | |||
Labour | Shami Khan | 5.0 | 600 | 881.07 | 922.61 | 938.21 | 938.21 | 948.23 | 963.96 | 989.98 | ||||
Solidarity | Kevin Connor | 1.6 | 187 | 203.66 | 242.56 | 246.81 | 272.77 | 279.48 | 294.89 | |||||
Liberal | Peter McDougall | 1.3 | 152 | 163.06 | 192.81 | 196.90 | 202.46 | 215.01 | ||||||
Independent | Jet Cameron | 0.8 | 100 | 107.63 | 118.63 | 149.00 | 152.24 | |||||||
Scottish Socialist | Nick Eardley | 0.7 | 82 | 89.79 | 105.59 | 107.06 | ||||||||
Independent | John Wallace | 0.6 | 69 | 75.23 | 89.95 | |||||||||
Electorate: 19,693 Valid: 11,772 Spoilt: 169 Quota: 2,944 Turnout: 60.6% |
2007 Council election: Southside/Newington | |||||||||||
---|---|---|---|---|---|---|---|---|---|---|---|
Party | Candidate | % 1st Pref | Count 1 | Count 2 | Count 3 | Count 4 | Count 5 | Count 6 | Count 7 | Count 8 | |
Labour | Ian Perry | 18.6 | 2,530 | 2,537 | 2,548 | 2,554 | 2,568 | 2,763 | |||
Conservative | Cameron Rose | 18.5 | 2,516 | 2,529 | 2,531 | 2,546 | 2,551 | 2,686 | 2,691.32 | 2,835.77 | |
Liberal Democrats | Gordon Mackenzie | 17.0 | 2,304 | 2,309 | 2,315 | 2,356 | 2,378 | 2,670 | 2,681.66 | 4,168.10 | |
Scottish Green | Steve Burgess | 14.1 | 1,920 | 1,935 | 1,961 | 1,974 | 2,062 | 2,610 | 2,623.58 | 2,893.41 | |
Liberal Democrats | Liz O' Malley | 14.0 | 1,907 | 1,913 | 1,917 | 1,939 | 1,945 | 2,087 | 2,097.96 | ||
SNP | Susanna Lacey | 13.1 | 1,780 | 1,790 | 1,824 | 1,845 | 1,876 | ||||
Scottish Socialist | Scott Simpson | 1.1 | 146 | 150 | 183 | 189 | |||||
Liberal | Margaret Lea | 1.1 | 144 | 148 | 156 | ||||||
Solidarity | James C Allinson | 1.0 | 140 | 142 | |||||||
Independent | George E Pitcher | 0.6 | 81 | ||||||||
Electorate: 23,620 Valid: 13,468 Spoilt: 121 Quota: 2,694 Turnout: 57.5% |
2007 Council election: Liberton/Gilmerton | ||||||||||||
---|---|---|---|---|---|---|---|---|---|---|---|---|
Party | Candidate | % 1st Pref | Count 1 | Count 2 | Count 3 | Count 4 | Count 5 | Count 6 | Count 7 | Count 8 | Count 9 | |
SNP | Tom Buchanan | 26.0 | 3,471 | |||||||||
Labour | Norma M Hart | 18.9 | 2,524 | 2,610.82 | ||||||||
Labour | Ian Murray | 15.8 | 2,104 | 2,142.45 | 2,143.08 | 2,156.82 | 2,176.04 | 2,207.78 | 2,252.96 | 2,356.10 | 2,569.78 | |
Conservative | Gavin Easton | 14.3 | 1,912 | 1,976.74 | 1,976.76 | 1,985.00 | 1,991.48 | 2,017.96 | 2,032.43 | 2,101.05 | ||
Liberal Democrats | Conor Snowden | 14.2 | 1,902 | 2,028.26 | 2,028.29 | 2,049.51 | 2,068.47 | 2,113.43 | 2,161.85 | 2,449.48 | 3179.72 | |
Scottish Green | Joan E Carter | 3.5 | 464 | 589.02 | 589.04 | 605.50 | 639.44 | 639.44 | 788.50 | |||
Scottish Socialist | Colin A Fox | 1.6 | 208 | 265.30 | 265.31 | 268.05 | 310.22 | 330.45 | ||||
Independent | Max Volino | 1.6 | 207 | 225.60 | 225.61 | 276.49 | 302.45 | |||||
Solidarity | John Wight | 1.0 | 132 | 180.62 | 180.62 | 194.10 | ||||||
Independent | Alex Scott | 0.9 | 123 | 161.94 | 161.95 | |||||||
Electorate: 24,133 Valid: 13,047 Spoilt: 306 Quota: 2,610 Turnout: 55.3% |
2007 Council election: Portobello/Craigmillar | |||||||||||||||||
---|---|---|---|---|---|---|---|---|---|---|---|---|---|---|---|---|---|
Party | Candidate | % 1st Pref | Count 1 | Count 2 | Count 3 | Count 4 | Count 5 | Count 6 | Count 7 | Count 8 | Count 9 | Count 10 | Count 11 | Count 12 | Count 13 | Count 14 | |
SNP | Michael A Bridgeman | 28.0 | 3,471 | ||||||||||||||
Labour | Maureen Child | 21.9 | 2,076 | 2,125.94 | 2,125.94 | 2127.94 | 2,138.44 | 2,158.45 | 2,189.70 | 2,227.08 | 2,295.83 | 2,337.97 | |||||
Conservative | Alison Miller | 11.0 | 1,041 | 1,057.31 | 1,058.69 | 1,058.69 | 1,061.44 | 1,068.82 | 1,072.45 | 1,089.45 | 1,102.83 | 1,156.59 | 1,157.08 | 1,202.78 | 1,262.92 | ||
Labour | Lawrence Marshall | 8.9 | 849 | 857.91 | 857.91 | 858.91 | 862.28 | 867.79 | 880.42 | 900.42 | 935.80 | 958.30 | 967.58 | 1,100.53 | |||
Liberal Democrats | Stephen I Hawkins | 8.3 | 791 | 817.98 | 817.98 | 817.98 | 820.98 | 857.87 | 875.25 | 910.76 | 923.76 | 1,006.27 | 1,007.97 | 1,290.09 | 1,481.76 | 1,850.76 | |
Scottish Green | Peter McColl | 6.7 | 635 | 668.63 | 668.63 | 668.63 | 693.01 | 701.89 | 762.80 | 803.30 | 827.56 | 885.08 | 886.40 | ||||
Independent | Norrie Davies | 3.2 | 302 | 316.30 | 316.43 | 317.81 | 320.18 | 325.68 | 342.81 | 367.32 | |||||||
Independent | Archie Burns | 3.1 | 291 | 306.56 | 307.93 | 310.19 | 311.31 | 315.94 | 332.70 | 376.83 | 415.09 | ||||||
Independent | Margaret Munro | 2.6 | 244 | 251.40 | 251.65 | 257.78 | 260.41 | 262.91 | 268.41 | ||||||||
Solidarity | Caroline J Hosking | 2.0 | 187 | 214.35 | 214.73 | 214.85 | 231.61 | 238.62 | |||||||||
Liberal | Massimo Circi | 1.2 | 114 | 131.94 | 131.94 | 131.94 | 133.07 | ||||||||||
Scottish Socialist | Jan Moran | 0.8 | 73 | 81.91 | 82.03 | 82.03 | |||||||||||
Independent | John Smart | 0.2 | 19 | 20.13 | 20.13 | ||||||||||||
Independent | Gerry Kerr | 0.1 | 5 | 7.001 | |||||||||||||
Electorate: 17,404 Valid: 9,281 Spoilt: 206 Quota: 2,321 Turnout: 54.5% |
Forth By-Election (6 November 2008)- 1 seat [2] | ||||||||||||
---|---|---|---|---|---|---|---|---|---|---|---|---|
Party | Candidate | % 1st Pref | Count 1 | Count 2 | Count 3 | Count 4 | Count 5 | Count 6 | Count 7 | Count 8 | Count 9 | |
Labour | Cammy Day | 29.53 | 2,013 | 2,014 | 2,023 | 2,042 | 2,134 | 2,228 | 2,543 | 2,810 | 3,735 | |
SNP | George Gordon | 27.01 | 1,841 | 1,843 | 1,849 | 1,861 | 1,920 | 2,005 | 2,259 | 2,529 | ||
Conservative | Iain McGill | 17.31 | 1,180 | 1,184 | 1,187 | 1,188 | 1,199 | 1,225 | 1,453 | |||
Liberal Democrats | Sanne C Djikstra-Downie | 14.45 | 985 | 987 | 989 | 995 | 1,033 | 1,155 | ||||
Scottish Green | Kate Joester | 5.06 | 341 | 343 | 360 | 373 | 410 | |||||
Independent | John Loughton | 4.36 | 297 | 303 | 307 | 323 | ||||||
Solidarity | Willie Black | 1.17 | 80 | 80 | 84 | |||||||
Scottish Socialist | Robert Richard | 1.0 | 53 | 54 | ||||||||
Independent | James G MacLean | 0.05 | 26 | |||||||||
Labour hold | Swing | |||||||||||
Electorate: 21,560 Valid: 6,816 Spoilt: 70 Quota: 3,409 Turnout: 6,886 |
|}
Liberton/Gilmerton By-Election (9 September 2010)- 1 seat [3] | |||||||||
---|---|---|---|---|---|---|---|---|---|
Party | Candidate | % 1st Pref | Count 1 | Count 2 | Count 3 | Count 4 | Count 5 | Count 6 | |
Labour | Bill Cook | 44.8 | 2,974 | ||||||
SNP | Richard Lewis | 20.8 | 1,382 | ||||||
Conservative | Stephanie Murray | 15.4 | 1,020 | ||||||
Liberal Democrats | John Christopher Knox | 10.9 | 722 | ||||||
Scottish Green | Peter McColl | 3.0 | 201 | ||||||
Scottish Socialist | Colin Fox | 2.5 | 169 | ||||||
Independent | Mev Brown | 1.9 | 128 | ||||||
Pirate | Philip Hunt | 0.6 | 43 | ||||||
Labour hold | Swing | ||||||||
Electorate: 23,912 Valid: 6,639 Spoilt: 65 Quota: 3,320 Turnout: 6,704 |
|}
City Centre By-Election (18 August 2011)- 1 seat [4] | |||||||||
---|---|---|---|---|---|---|---|---|---|
Party | Candidate | % 1st Pref | Count 1 | Count 2 | Count 3 | Count 4 | Count 5 | ||
Conservative | Iain McGill | 24.2 | 837 | 904 | 1,043 | 1,110 | 1,264 | ||
SNP | Alasdair Rankin | 23.1 | 797 | 825 | 893 | 1,081 | 1,368 | ||
Labour | Karen Doran | 19.7 | 682 | 716 | 745 | 968 | |||
Scottish Green | Melanie Main | 14.3 | 494 | 576 | 635 | ||||
Independent | John Carson | 11.4 | 394 | 402 | |||||
Liberal Democrats | Alistair Hodgson | 7.3 | 251 | ||||||
SNP hold | Swing | ||||||||
Electorate: 14,810 Valid: 3,455 Spoilt: 11 Quota: 1,728 Turnout: 3,466 |
|}
Elections to Glasgow City Council were held on 3 May 2007, the same day as the other Scottish local government elections and the Scottish Parliament general election. The election was the first one using 21 new wards created as a results of the Local Governance (Scotland) Act 2004, each ward elected three or four councillors using the single transferable vote system a form of proportional representation. The new wards replaced 79 single-member wards which used the plurality system of election. It also saw the election of Glasgow's first councillors for the Scottish Green Party and for Solidarity.
Elections to Dundee City Council were held on 3 May 2007, the same day as the other Scottish local government elections and the Scottish Parliament general election.
Elections to the Highland Council were held on 3 May 2007; the same day as elections to the Scottish Parliament and to the 31 other councils in Scotland. Previous elections to the Council had been conducted using the single member plurality system. Changes implemented by the Local Governance (Scotland) Act 2004 meant that future local government elections were to be conducted using the Single Transferable Vote, beginning with those in 2007. The 80 Highland Councillors were now to be elected from 22 wards, returning either three or four members.
Elections to South Lanarkshire Council were held on 3 May 2007 the same day as the other Scottish local government elections and the Scottish Parliament general election. The election was the first one using 20 new wards created as a results of the Local Governance (Scotland) Act 2004, each ward will elect three or four councillors using the single transferable vote system a form of proportional representation. The new wards replace 67 single-member wards which used the plurality system of election.
Elections to North Ayrshire Council were held on 3 May 2007, the same day as the other Scottish local government elections and the Scottish Parliament general election. The election was the first one using eight new wards created as a results of the Local Governance (Scotland) Act 2004, each ward will elect three or four councillors using the single transferable vote system a form of proportional representation. The new wards replace 30 single-member wards which used the plurality system of election.
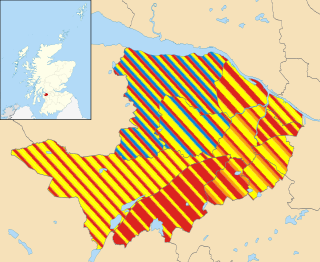
Elections to Renfrewshire Council were held on 3 May 2007, the same day as the other Scottish local government elections and the Scottish Parliament general election. The election was the first one using 11 new wards created as a results of the Local Governance (Scotland) Act 2004, each ward will elect three or four councillors using the single transferable vote system a form of proportional representation. The new wards replace 40 single-member wards which used the plurality system of election.
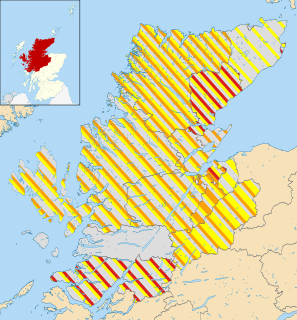
The 2012 Highland Council election took place on 3 May 2012 to elect members of Highland Council. The election used the twenty-two wards created as a result of the Local Governance (Scotland) Act 2004, with each ward electing three or four Councillors using the single transferable vote system and 80 Councillors being elected.
Elections to Angus Council were held on 3 May 2012 the same day as the other Scottish local government elections. The election used the eight wards, created as a result of the Local Governance (Scotland) Act 2004, with each ward electing three or four Councillors using the single transferable vote system a form of proportional representation, with 29 Councillors being elected.
Elections to Comhairle nan Eilean Siar were held on 3 May 2012, the same day as the other Scottish local government elections. The election was the second one using the 9 wards created as a result of the Local Governance (Scotland) Act 2004. Each ward elected three or four Councillors using the single transferable vote system: a form of proportional representation. A total of 31 Councillors were elected.
Elections to Aberdeenshire Council were held on 3 May 2012, on the same day as the other Scottish local government elections. The election used the 19 wards created as a result of the Local Governance (Scotland) Act 2004, with each ward electing three or four Councillors using the single transferable vote system a form of proportional representation, with 68 Councillors being elected.
The 2012 Aberdeen City Council election took place on 3 May 2012 to elect members of Aberdeen City Council. The election used the 13 wards created as a result of the Local Governance (Scotland) Act 2004, with each ward electing three or four Councillors using the single transferable vote system a form of proportional representation, with 43 Councillors elected.
Elections to the Moray Council were held on 3 May 2012, the same day as the other 31 local authorities in Scotland. The election used the eight wards created under the Local Governance (Scotland) Act 2004, with 26 councillors being elected. Each ward elected either 3 or 4 members, using the STV electoral system.
Elections to Falkirk Council were held on 3 May 2012, the same day as the 31 other local authorities in Scotland. The election used the nine wards created under the Local Governance (Scotland) Act 2004, with 32 councillors being elected. Each ward elected either 3 or 4 members, using the STV electoral system.
The 2012 Midlothian Council election took place on 3 May 2012 to elect members of Midlothian Council. The election used the six wards created as a result of the Local Governance (Scotland) Act 2004, with each ward electing three or four Councillors using the single transferable vote system a form of proportional representation, with 18 Councillors being elected.
Elections to South Lanarkshire Council were held on 3 May 2012 on the same day as the 31 other local authorities in Scotland. The election used the twenty wards created under the Local Governance (Scotland) Act 2004, with 67 Councillors being elected. Each ward elected either 3 or 4 members, using the STV electoral system.
Elections to North Lanarkshire Council were held on 3 May 2012 on the same day as the 31 other local authorities in Scotland. The election used the twenty wards created under the Local Governance (Scotland) Act 2004, with 70 Councillors being elected. Each ward elected either 3 or 4 members, using the STV electoral system.
The most recent elections to the City of Edinburgh Council were held on Thursday 4 May 2017, on the same day as the 31 other local authorities in Scotland. It was the third successive Local Council election to run under the single transferable vote (STV) electoral system.
The Clackmannanshire Council election of 2017 was held on 4 May 2017, on the same day as the 31 other local authorities in Scotland. It was the third successive election to run under the STV electoral system and used the five wards created under the Local Governance (Scotland) Act 2004, with 18 councillors being elected.
Elections to Falkirk Council will be held on 4 May 2017, the same day as the 31 other local authorities in Scotland. The election will use the nine wards created under the Local Governance (Scotland) Act 2004, with 30 councillors being elected, a reduction of 2 members from 2012. Each ward will elect either 3 or 4 members, using the STV electoral system.
The 2017 Highland Council election was held on 4 May 2017 to elect members of Highland Council. The election used the 21 wards created under the Local Governance (Scotland) Act 2004; each ward elected three or four councillors using the single transferable vote system. A total of 74 councillors were elected, six less than in 2012.