West Berkshire Council election, 2007

Last updated
Map of the results of the 2007 West Berkshire Borough Council election. Conservative in blue and Liberal Democrats in yellow. West Berkshire UK local election 2007 map.svg
Map of the results of the 2007 West Berkshire Borough Council election. Conservative in blue and Liberal Democrats in yellow.

The 2007 West Berkshire Council election took place on 3 May 2007 to elect members of West Berkshire Council in Berkshire, England. The whole council was up for election and the Conservative party stayed in overall control of the council. [1]

West Berkshire Council

West Berkshire Council is the local authority of West Berkshire in Berkshire, England. It is a unitary authority, having the powers of a non-metropolitan county and district council combined. West Berkshire is divided into 30 wards, electing 52 councillors. The council was created by the Local Government Act 1972 as the Newbury District Council and replaced five local authorities: Bradfield Rural District Council, Hungerford Rural District Council, Newbury Borough Council, Newbury Rural District Council and Wantage Rural District Council. On 1 April 1998 it was renamed West Berkshire Council and since then has been a unitary authority, assuming the powers and functions of Berkshire County Council. In the 2015 election the Conservatives won 48 out of 52 seats. The next election to the authority will be in 2019.

Berkshire County of England

Berkshire is one of the home counties in England. It was recognised by the Queen as the Royal County of Berkshire in 1957 because of the presence of Windsor Castle, and letters patent were issued in 1974. Berkshire is a county of historic origin, a ceremonial county and a non-metropolitan county without a county council. The county town is Reading.

England Country in north-west Europe, part of the United Kingdom

England is a country that is part of the United Kingdom. It shares land borders with Wales to the west and Scotland to the north-northwest. The Irish Sea lies west of England and the Celtic Sea lies to the southwest. England is separated from continental Europe by the North Sea to the east and the English Channel to the south. The country covers five-eighths of the island of Great Britain, which lies in the North Atlantic, and includes over 100 smaller islands, such as the Isles of Scilly and the Isle of Wight.

Contents

Background

At the last election in 2003 both the Conservatives and Liberal Democrats won 26 seats and the Liberal Democrats kept control with the chairman's casting vote. [2] However the Conservatives took control in May 2005 after gaining a seat from the Liberal Democrats at a by-election. [3]

Liberal Democrats (UK) Political party in the United Kingdom

The Liberal Democrats are a liberal political party in the United Kingdom. It is currently led by Vince Cable. They have 11 Members of Parliament in the House of Commons, 96 members of the House of Lords, one member of the European Parliament, five Members of the Scottish Parliament and one member in the Welsh Assembly and London Assembly. At the height of its influence, the party formed a coalition government with the Conservative Party from 2010 to 2015 with its leader Nick Clegg serving as Deputy Prime Minister.

A casting vote is a vote that someone may exercise to resolve a deadlock. A casting vote is typically by the presiding officer of a council, legislative body, committee, etc., and may only be exercised to break a deadlock. Examples of officers who hold casting votes are the Speaker of the British House of Commons and the President of the United States Senate.

Election result

The Conservatives increased their majority to 20 seats after gaining seats from the Liberal Democrats. [4] Conservative gains included taking seats in Clay Hill, Falkland and Thatcham Central wards to win 36 seats on the council, but they did lose one seat in Thatcham North to leave the Liberal Democrats on 16 seats. [4] Overall turnout at the election improved to 45%. [4]

Thatcham a town in West Berkshire, United Kindom

Thatcham is a market town in the historic county of Berkshire, England, centred 3 miles (5 km) east of Newbury, 14 miles (24 km) west of Reading and 54 miles west of London. Its population grew rapidly in the second half of the 20th century: from 5,000 in 1951 and 7,500 in 1961 to 22,824 in 2001. During World War II, Thatcham housed one of the biggest Prisoner of War camps in the South, known as camp 1001.

The wards and electoral divisions in the United Kingdom are electoral districts at sub-national level represented by one or more councillors. The ward is the primary unit of English electoral geography for civil parishes and borough and district councils, electoral ward is the unit used by Welsh principal councils, while the electoral division is the unit used by English county councils and some unitary authorities. Each ward/division has an average electorate of about 5,500 people, but ward-population counts can vary substantially. As at the end of 2014 there were 9,456 electoral wards/divisions in the UK.

Voter turnout percentage of eligible voters who cast a ballot in an election

Voter turnout is the percentage of eligible voters who cast a ballot in an election. Eligibility varies by country, and the voting-eligible population should not be confused with the total adult population. Age and citizenship status are often among the criteria used to determine eligibility, but some countries further restrict eligibility based on sex, race, or religion.

West Berkshire local election result 2007 [5] [6]
PartySeatsGainsLossesNet gain/lossSeats %Votes %Votes+/−
  Conservative 36101+969.259.452,047+9.1%
  Liberal Democrat 16110-930.835.330,962-10.3%
  Labour 000002.21,966-0.9%
  Independent 000001.51,330+1.1%
  Green 000000.9831+0.4%
  BNP 000000.3232+0.3%
  UKIP 000000.3224+0.3%

Ward results

Aldermaston [6]
PartyCandidateVotes%±
Conservative Irene Neill76279.7+9.3
Liberal Democrat Kath Evans19420.3-9.3
Majority56859.4+18.5
Turnout 95646.5-1
Conservative hold Swing
Basildon [6]
PartyCandidateVotes%±
Conservative Alan Law96883.2+27.3
Liberal Democrat Silvia Boschetto19516.8-27.3
Majority77366.5+54.6
Turnout 1,16351.2-4
Conservative hold Swing
Birch Copse (3 seats) [6]
PartyCandidateVotes%±
Conservative Joe Mooney1,390
Conservative Tony Linden1,340
Conservative Emma Webster1,265
Labour Sean Hartney509
Liberal Democrat Clive Hillman486
Liberal Democrat Susan Prime425
Liberal Democrat Paul Pritchard357
Turnout 5,77234.6
Conservative hold Swing
Bucklebury (2 seats) [6]
PartyCandidateVotes%±
Conservative Graham Pask1,340
Conservative Quentin Webb1,283
Liberal Democrat Ben Morgan382
Liberal Democrat James Cullen283
Turnout 3,28849.0
Conservative hold Swing
Burghfield (2 seats) [6]
PartyCandidateVotes%±
Liberal Democrat Royce Longton991
Conservative Carol Jackson-Doerge956
Conservative Michael Wright946
Liberal Democrat John Farrin921
Turnout 3,81444.9
Liberal Democrat hold Swing
Conservative gain from Liberal Democrat Swing
Calcot (3 seats) [6]
PartyCandidateVotes%±
Conservative Brian Bedwell1,507
Conservative Peter Argyle1,354
Conservative Manohar Gopal1,254
Independent Edmund Savage531
Labour Glenn Dennis504
Liberal Democrat Chris Day311
Liberal Democrat Gina Houghton282
Green Jacob Sanders270
Liberal Democrat Mark Thatcher197
Turnout 6,21034.10
Conservative hold Swing
Chieveley [6]
PartyCandidateVotes%±
Conservative Hilary Cole72082.2+13.9
Liberal Democrat John Steels15617.8-13.9
Majority56464.4+27.8
Turnout 87646.8+9
Conservative hold Swing
Clay Hill (2 seats) [6]
PartyCandidateVotes%±
Conservative Jeff Beck986
Conservative Dave Goff892
Liberal Democrat Phil Barnett817
Liberal Democrat Pam Taylor717
Labour Barry Lambert88
Turnout 3,50038.6+4
Conservative gain from Liberal Democrat Swing
Cold Ash [6]
PartyCandidateVotes%±
Conservative Geoff Findlay83469.0+13.8
Liberal Democrat Rod King37431.0-13.8
Majority46038.1+27.8
Turnout 1,20854.1+4.1
Conservative hold Swing
Compton [6]
PartyCandidateVotes%±
Conservative Barbara Alexander79868.3+7.9
Liberal Democrat Peter Newman37131.7-7.9
Majority42736.5+15.7
Turnout 1,16952.8+7
Conservative hold Swing
Downlands [6]
PartyCandidateVotes%±
Conservative George Chandler82670.8+10.8
Liberal Democrat Paul Walter16013.7+13.7
Green Adrian Hollister1048.9+8.9
Labour Yogi Johnston776.6-4.4
Majority66657.1+26.1
Turnout 1,16751.7+6
Conservative hold Swing
Falkland (2 seats) [6]
PartyCandidateVotes%±
Conservative Adrian Edwards1,537
Conservative Howard Bairstow1,510
Liberal Democrat Mavis Greenhalgh1,070
Liberal Democrat Peter Greenhalgh1,070
Labour Derek Brear100
Turnout 5,28757.9+12
Conservative gain from Liberal Democrat Swing
Greenham (2 seats) [6]
PartyCandidateVotes%±
Liberal Democrat Billy Drummond868
Liberal Democrat Julian Swift-Hook804
Conservative Chris Austin663
Conservative Ken Neal621
Labour Hannah Cooper101
Turnout 3,05741.5+4
Liberal Democrat hold Swing
Hungerford (2 seats) [6]
PartyCandidateVotes%±
Conservative Paul Hewer1,244
Conservative David Holtby1,189
Liberal Democrat Denise Gaines924
Liberal Democrat James Mole821
Turnout 4,17849.0
Conservative gain from Liberal Democrat Swing
Kintbury (2 seats) [6]
PartyCandidateVotes%±
Conservative Andrew Rowles1,224
Conservative Anthony Stansfeld1,211
Liberal Democrat Christopher Doyle455
Liberal Democrat Ian O'Callaghan380
Turnout 3,27046.5+10
Conservative hold Swing
Lambourn Valley (2 seats) [6]
PartyCandidateVotes%±
Conservative Graham Jones1,514
Conservative Gordon Lundie1,343
Liberal Democrat John Davies409
Liberal Democrat Joyce Easteal350
Labour Grahame Murphy85
Turnout 3,70146.8+23
Conservative hold Swing
Mortimer (2 seats) [6]
PartyCandidateVotes%±
Liberal Democrat Keith Lock1,183
Liberal Democrat Mollie Lock1,063
Conservative John Bull1,017
Conservative Ben Bovill928
Turnout 4,19154.1+15
Liberal Democrat hold Swing
Northcroft (2 seats) [6]
PartyCandidateVotes%±
Liberal Democrat Tony Vickers749
Liberal Democrat Gwen Mason712
Conservative John Tristam644
Conservative Charlie Farrow643
Independent David Yates342
Independent Lee Harris290
Turnout 3,38045.5
Liberal Democrat hold Swing
Pangbourne [6]
PartyCandidateVotes%±
Conservative Pamela Bale74282.8+8.6
Green Katherine Kennet566.3+6.3
Liberal Democrat Teresa Wareham505.6-10.3
Labour Robert Tutton485.4-4.5
Majority68676.6+18.4
Turnout 89641.0+5
Conservative hold Swing
Purley on Thames (2 seats) [6]
PartyCandidateVotes%±
Conservative Tim Metcalfe1,272
Conservative David Betts1,261
Liberal Democrat Stephen Bown278
Green Miriam Kennet264
Labour Riyad Abboushi261
Liberal Democrat David Wood238
Turnout 3,57437.7+14
Conservative hold Swing
Speen (2 seats) [6]
PartyCandidateVotes%±
Conservative Paul Bryant1,336
Conservative Marcus Franks1,295
Liberal Democrat Chris Hood517
Liberal Democrat Sam Elliott488
Turnout 3,63644.2+5
Conservative hold Swing
St Johns (2 seats) [6]
PartyCandidateVotes%±
Conservative Mike Johnston1,269
Conservative Ieuan Tuck1,227
Liberal Democrat Malik Azam848
Liberal Democrat Cheryl McAlinn837
Turnout 4,18148.9+9
Conservative gain from Liberal Democrat Swing
Conservative hold Swing
Sulhamstead [6]
PartyCandidateVotes%±
Conservative Keith Chopping66367.0+15.8
Liberal Democrat James Kerry32633.0-15.8
Majority33734.1+31.8
Turnout 98950.9+7
Conservative hold Swing
Thatcham Central (2 seats) [6]
PartyCandidateVotes%±
Conservative Richard Crumly818
Conservative Ellen Crumly793
Liberal Democrat Patrick Denys773
Liberal Democrat Alexander Payton720
UKIP Craig Sandelands127
Green Volker Heinemann110
Turnout 3,34139.9
Conservative gain from Liberal Democrat Swing
Thatcham North (2 seats) [6]
PartyCandidateVotes%±
Liberal Democrat David Rendel 1,019
Liberal Democrat Lee Dillon920
Conservative Sheila Ellison904
Conservative Kay Smurthwaite854
BNP Andy Clasper119
BNP Jacqui Hunt113
Turnout 3,92949.7
Liberal Democrat gain from Conservative Swing
Liberal Democrat hold Swing
Thatcham South and Crookham (2 seats) [6]
PartyCandidateVotes%±
Liberal Democrat Owen Jeffery898
Liberal Democrat Terry Port861
Conservative Peter Ellison817
Conservative Sandra Warham764
Turnout 3,34038.7
Liberal Democrat hold Swing
Thatcham West (2 seats) [6]
PartyCandidateVotes%±
Liberal Democrat Keith Woodhams960
Liberal Democrat Jeff Brooks957
Conservative Rodney Arnold837
Conservative James Crumly797
Turnout 3,55137.2
Liberal Democrat hold Swing
Theale [6]
PartyCandidateVotes%±
Liberal Democrat Alan Macro44550.9+9.5
Conservative Ian MacFarlane30034.3+0.5
Labour Terry Jackson10211.7-13.0
Green Nicholas Foster273.1+3.1
Majority14516.6+9.0
Turnout 87442.0+10
Liberal Democrat hold Swing
Victoria (2 seats) [6]
PartyCandidateVotes%±
Liberal Democrat Roger Hunneman609
Liberal Democrat Gabrielle McGarvey578
Conservative Brian Goodall504
Conservative Pearl Hancock425
Independent Philip Parry167
UKIP David McMahon97
Turnout 2,38035.1+5
Liberal Democrat hold Swing
Westwood [6]
PartyCandidateVotes%±
Conservative Laszlo Zverko46064.4+23.7
Liberal Democrat Sid Sidamparappillai16322.8-17.3
Labour Charles Croal9112.7-6.5
Majority29741.6+41.0
Turnout 71438.7+7
Conservative hold Swing

By-elections between 2007 and 2011

Thatcham South and Crookham by-election 22 July 2010 [7] [8]
PartyCandidateVotes%±
Liberal Democrat Robert Morgan93654.3+2.0
Conservative Dominic Boeck78745.7-2.0
Majority1498.6
Turnout 1,72334.0-4.7
Liberal Democrat hold Swing

Related Research Articles

The 1998 St Helens Metropolitan Borough Council election took place on 7 May 1998 to elect members of St Helens Metropolitan Borough Council in Merseyside, England. One third of the council was up for election and the Labour party stayed in overall control of the council.

2004 Craven District Council election

The 2004 Craven District Council election took place on 10 June 2004 to elect members of Craven District Council in North Yorkshire, England. One third of the council was up for election and the council stayed under no overall control.

The 2000 Harlow District Council election took place on 4 May 2000 to elect members of Harlow District Council in Essex, England. One third of the council was up for election and the Labour party stayed in overall control of the council.

The 1998 Wyre Forest District Council election took place on 7 May 1998 to elect members of Wyre Forest District Council in Worcestershire, England. One third of the council was up for election and the Labour party stayed in overall control of the council.

The 2002 Wokingham District Council election took place on 2 May 2002 to elect members of Wokingham Unitary Council in Berkshire, England. One third of the council was up for election and the Conservative party gained overall control of the council from no overall control.

The 1998 Pendle Borough Council election took place on 7 May 1998 to elect members of Pendle Borough Council in Lancashire, England. One third of the council was up for election and the Liberal Democrats stayed in overall control of the council.

2007 Pendle Borough Council election

The 2007 Pendle Borough Council election took place on 3 May 2007 to elect members of Pendle Borough Council in Lancashire, England. One third of the council was up for election and the Liberal Democrats stayed in overall control of the council.

2010 Wokingham Borough Council election

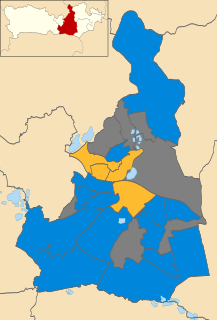
The 2010 Wokingham Borough Council election took place on 6 May 2010 to elect members of Wokingham Unitary Council in Berkshire, England. One third of the council was up for election and the Conservative party stayed in overall control of the council.

2007 Derbyshire Dales District Council election

The 2007 Derbyshire Dales District Council election took place on 3 May 2007 to elect members of Derbyshire Dales District Council in Derbyshire, England. The whole council was up for election and the Conservative party stayed in overall control of the council.

The 1999 Wealden District Council election took place on 6 May 1999 to elect members of Wealden District Council in East Sussex, England. The whole council was up for election and the Conservative party stayed in overall control of the council.

2004 Colchester Borough Council election

The 2004 Colchester Borough Council election took place on 10 June 2004 to elect members of Colchester Borough Council in Essex, England. This was the same day as the other 2004 United Kingdom local elections and as the 2004 European Parliament Elections. One third of the seats were up for election and the council stayed under no overall control.

2008 Colchester Borough Council election

The 2008 Colchester Borough Council election took place on 1 May 2008 to elect members of Colchester Borough Council in Essex, England. One third of the council was up for election and the Conservative party lost overall control of the council to no overall control.

2004 Havant Borough Council election

The 2004 Havant Borough Council election took place on 10 June 2004 to elect members of Havant Borough Council in Hampshire, England. One third of the council was up for election and the Conservative party stayed in overall control of the council.

2006 Havant Borough Council election

The 2006 Havant Borough Council election took place on 4 May 2006 to elect members of Havant Borough Council in Hampshire, England. One third of the council was up for election and the Conservative party stayed in overall control of the council.

2007 Torridge District Council election

The 2007 Torridge District Council election took place on 3 May 2007 to elect members of Torridge District Council in Devon, England. The whole council was up for election and independents lost overall control of the council to no overall control.

2006 Huntingdonshire District Council election

The 2006 Huntingdonshire District Council election took place on 4 May 2006 to elect members of Huntingdonshire District Council in Cambridgeshire, England. One third of the council was up for election and the Conservative party stayed in overall control of the council.

2007 Rother District Council election

The 2007 Rother District Council election took place on 3 May 2007 to elect members of Rother District Council in East Sussex, England. The whole council was up for election and the Conservative party stayed in overall control of the council.

The 2000 West Berkshire Council election took place on 4 May 2000 to elect members of West Berkshire Council in Berkshire, England. The whole council was up for election and the Liberal Democrats stayed in overall control of the council.

2003 West Berkshire Council election

The 2003 West Berkshire Council election took place on 1 May 2003 to elect members of West Berkshire Council in Berkshire, England. The whole council was up for election with boundary changes since the last election in 2000 reducing the number of seats by 2. The Liberal Democrats lost overall control of the council to no overall control.

2011 West Berkshire Council election

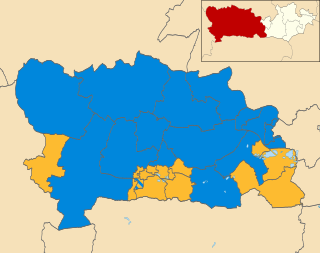
The 2011 West Berkshire Council election took place on 5 May 2011 to elect members of West Berkshire Council in Berkshire, England. The whole council was up for election and the Conservative party stayed in overall control of the council.

References

  1. "West Berkshire". BBC News Online. 4 May 2007. Retrieved 26 December 2014.
  2. "West Berks Council hung - Lib Dems' 12-year grip over". Reading Post . NewsBank. 2 May 2003.
  3. "English elect councils and mayors". BBC News Online. 7 May 2005. Retrieved 27 December 2014.
  4. 1 2 3 "West Berkshire election snaps". Reading Post . 4 May 2007.
  5. "Results - Election 2007". The Times . NewsBank. 5 May 2007. p. 83.
  6. 1 2 3 4 5 6 7 8 9 10 11 12 13 14 15 16 17 18 19 20 21 22 23 24 25 26 27 28 29 30 31 "District Council election". West Berkshire Council. Retrieved 26 December 2014.
  7. "By-election results: 30 July 2010". Local Government Chronicle . 30 July 2010. Retrieved 27 December 2014.
  8. "Local Authority Byelection Results - July 2010". Local Authority Byelection Results. Retrieved 27 December 2014.