The 2008 Wokingham Borough Council election took place on 1 May 2008 to elect members of Wokingham Unitary Council in Berkshire, England. One third of the council was up for election and the Conservative party stayed in overall control of the council. [1]
A unitary authority is a type of local authority that has a single tier and is responsible for all local government functions within its area or performs additional functions which elsewhere in the relevant country are usually performed by national government or a higher level of sub-national government.
Berkshire is one of the home counties in England. It was recognised by the Queen as the Royal County of Berkshire in 1957 because of the presence of Windsor Castle, and letters patent were issued in 1974. Berkshire is a county of historic origin, a ceremonial county and a non-metropolitan county without a county council. The county town is Reading.
The Conservative Party, officially the Conservative and Unionist Party, is a centre-right political party in the United Kingdom. The governing party since 2010, it is the largest in the House of Commons, with 313 Members of Parliament, and also has 249 members of the House of Lords, 18 members of the European Parliament, 31 Members of the Scottish Parliament, 12 members of the Welsh Assembly, eight members of the London Assembly and 8,916 local councillors.
After the election, the composition of the council was
18 seats were contested in the election with candidates from the Conservatives, Liberal Democrats, Labour, United Kingdom Independence Party, Green Party and British National Party standing. [3] The leader of the council, Conservative councillor Frank Browne, was one of a number of councillors who stood down at the election. [3] The Conservatives were defending 14 seats compared to 4 for the Liberal Democrats. [4]
The Liberal Democrats are a centrist, liberal political party in the United Kingdom. It is currently led by Vince Cable. It has 11 Members of Parliament in the House of Commons, 96 members of the House of Lords, one member of the European Parliament, five Members of the Scottish Parliament and one member in the Welsh Assembly and London Assembly. At the height of its influence, the party served as junior partners in a coalition government with the Conservative Party from 2010 to 2015.
The Labour Party is a centre-left political party in the United Kingdom that has been described as an alliance of social democrats, democratic socialists and trade unionists. The party's platform emphasises greater state intervention, social justice and strengthening workers' rights.
The Green Party of England and Wales is a green, left-wing political party in England and Wales. Headquartered in London, since September 2018, its co-leaders are Siân Berry and Jonathan Bartley. The Green Party has one representative in the House of Commons, one in the House of Lords, and three in the European Parliament. In addition, it has various councillors in UK local government and two members of the London Assembly.
The Conservatives defended their record in running the council and committed themselves to keeping a weekly bin collection, fight to keep down the number of new houses being built in the council area and continue investing in services. [4] Meanwhile, the Liberal Democrats criticised cuts in adult social care services and school maintenance funds and attacked a lack of democracy over proposed developments. [4] Other issues raised in the election included crime and council tax increases. [4]
Waste collection is a part of the process of waste management. It is the transfer of solid waste from the point of use and disposal to the point of treatment or landfill. Waste collection also includes the curbside collection of recyclable materials that technically are not waste, as part of a municipal landfill diversion program.
Social care in the United Kingdom is a devolved matter, so England, Northern Ireland, Scotland and Wales each have their own separate systems of private and publicly funded social care. Each country has differing policies, priorities and funding levels which has resulted in a variety of differences existing between the systems.
The election saw only one seat change hands with the Conservatives gaining Hillside from the Liberal Democrats to remain in control of the council with 44 of the 54 seats. [5] Hillside ward had seen the former Liberal Democrat councillor, Alan Spratling, step down at the election and he was succeeded by Conservative Pauline Jorgensen, wife of another councillor for Hillside, Norman Jorgensen. [6] The election also saw the United Kingdom Independence Party overtake Labour in the number of votes won across the council to win the third most number of votes. [6] Overall turnout in the election was 38.23%. [7]
Voter turnout is the percentage of eligible voters who cast a ballot in an election. Eligibility varies by country, and the voting-eligible population should not be confused with the total adult population. Age and citizenship status are often among the criteria used to determine eligibility, but some countries further restrict eligibility based on sex, race, or religion.
Following the election David Lee was elected as the new leader of the council to replace Frank Browne after he had stood down at the election. [8]
Party | Seats | Gains | Losses | Net gain/loss | Seats % | Votes % | Votes | +/− | |
---|---|---|---|---|---|---|---|---|---|
Conservative | 15 | 1 | 0 | +1 | 83.3 | 57.7 | 21,241 | +6.2% | |
Liberal Democrat | 3 | 0 | 1 | -1 | 16.7 | 30.5 | 11,218 | -1.8% | |
UKIP | 0 | 0 | 0 | 0 | 0 | 6.1 | 2,239 | -0.4% | |
Labour | 0 | 0 | 0 | 0 | 0 | 4.8 | 1,781 | -1.9% | |
Green | 0 | 0 | 0 | 0 | 0 | 0.7 | 272 | -0.1% | |
BNP | 0 | 0 | 0 | 0 | 0 | 0.1 | 44 | +0.1% |
Party | Candidate | Votes | % | ± | |
---|---|---|---|---|---|
Liberal Democrat | Jennifer Lissaman | 1,168 | 45.1 | -5.8 | |
Conservative | Mohammed Younis | 944 | 36.5 | +6.9 | |
Labour | Gregory Bello | 345 | 13.3 | -0.9 | |
UKIP | Peter Jackson | 131 | 5.1 | -0.2 | |
Majority | 224 | 8.6 | -12.7 | ||
Turnout | 2,588 | 40.8 | +2.8 | ||
Liberal Democrat hold | Swing |
Party | Candidate | Votes | % | ± | |
---|---|---|---|---|---|
Conservative | Emma Hobbs | 746 | 65.8 | +14.8 | |
Liberal Democrat | Arthur Illenden | 317 | 28.0 | -14.0 | |
Labour | Brian Scott | 51 | 4.5 | +1.5 | |
UKIP | Joan Huntley | 20 | 1.8 | -2.3 | |
Majority | 429 | 37.8 | +28.8 | ||
Turnout | 1,134 | 50.3 | -3.1 | ||
Conservative hold | Swing |
Party | Candidate | Votes | % | ± | |
---|---|---|---|---|---|
Conservative | Ullakarin Clark | 1,521 | 55.8 | +6.6 | |
Liberal Democrat | Keith Malvern | 788 | 28.9 | -4.7 | |
UKIP | Ann Davis | 289 | 10.6 | -1.3 | |
Labour | Paul Sharples | 128 | 4.7 | -0.5 | |
Majority | 733 | 26.9 | +11.3 | ||
Turnout | 2,726 | 44.0 | +0.5 | ||
Conservative hold | Swing |
Party | Candidate | Votes | % | ± | |
---|---|---|---|---|---|
Conservative | Dianne King | 1,456 | 63.1 | +5.3 | |
Liberal Democrat | Jeremy Harley | 521 | 22.6 | -1.8 | |
UKIP | Michael Spencer | 203 | 8.8 | -2.6 | |
Labour | Anthony Skuse | 128 | 5.5 | -0.9 | |
Majority | 935 | 40.5 | +7.1 | ||
Turnout | 2,308 | 35.2 | -1.2 | ||
Conservative hold | Swing |
Party | Candidate | Votes | % | ± | |
---|---|---|---|---|---|
Conservative | Michael Gore | 1,420 | 76.2 | +5.1 | |
Liberal Democrat | James May | 325 | 17.4 | -2.5 | |
UKIP | Ian Gordon | 118 | 6.3 | +0.3 | |
Majority | 1,095 | 58.8 | +7.6 | ||
Turnout | 1,863 | 44.2 | -2.6 | ||
Conservative hold | Swing |
Party | Candidate | Votes | % | ± | |
---|---|---|---|---|---|
Conservative | Gerald Cockcroft | 1,177 | 67.0 | -1.9 | |
Liberal Democrat | Roland Cundy | 438 | 24.9 | +5.1 | |
UKIP | Geoffrey Bulpitt | 142 | 8.1 | +1.7 | |
Majority | 739 | 42.1 | -7.0 | ||
Turnout | 1,757 | 39.9 | -2.1 | ||
Conservative hold | Swing |
Party | Candidate | Votes | % | ± | |
---|---|---|---|---|---|
Conservative | Matthew Deegan | 1,275 | 67.0 | +7.1 | |
Liberal Democrat | John Eastwell | 538 | 28.3 | +3.4 | |
UKIP | David Lamb | 90 | 4.7 | +2.0 | |
Majority | 737 | 38.7 | +3.7 | ||
Turnout | 1,903 | 27.5 | -2.7 | ||
Conservative hold | Swing |
Party | Candidate | Votes | % | ± | |
---|---|---|---|---|---|
Conservative | Pauline Jorgensen | 1,449 | 52.5 | +2.0 | |
Liberal Democrat | David Hare | 1,038 | 37.6 | -2.7 | |
Labour | David Sharp | 174 | 6.3 | +0.9 | |
UKIP | Geraint Jones | 99 | 3.6 | -0.2 | |
Majority | 411 | 14.9 | +4.7 | ||
Turnout | 2,760 | 42.2 | -0.6 | ||
Conservative gain from Liberal Democrat | Swing | ||||
Party | Candidate | Votes | % | ± | |
---|---|---|---|---|---|
Conservative | Annette Drake | 699 | 75.4 | +3.8 | |
Liberal Democrat | Haydon Trott | 136 | 14.7 | -6.5 | |
Labour | Daniel Clifton | 53 | 5.7 | -1.5 | |
UKIP | Amy Thornton | 39 | 4.2 | +4.2 | |
Majority | 563 | 60.7 | +10.3 | ||
Turnout | 927 | 43.6 | +0.2 | ||
Conservative hold | Swing |
Party | Candidate | Votes | % | ± | |
---|---|---|---|---|---|
Liberal Democrat | Phillip Challis | 1,234 | 54.3 | +12.1 | |
Conservative | Parvinder Batth | 842 | 37.1 | -8.4 | |
Labour | Alberto Troccoli | 112 | 4.9 | -2.5 | |
UKIP | Bernard Wakeford | 84 | 3.7 | -1.2 | |
Majority | 392 | 17.2 | |||
Turnout | 2,272 | 34.9 | +1.7 | ||
Liberal Democrat hold | Swing |
Party | Candidate | Votes | % | ± | |
---|---|---|---|---|---|
Conservative | Christopher Edmunds | 1,508 | 58.7 | +2.5 | |
Liberal Democrat | Caroline Smith | 584 | 22.7 | -3.5 | |
Labour | Jacqueline Rupert | 206 | 8.0 | +0.6 | |
Green | David Hogg | 136 | 5.3 | -0.4 | |
UKIP | Peter Williams | 134 | 5.2 | +0.8 | |
Majority | 924 | 36.0 | +6.0 | ||
Turnout | 2,568 | 35.2 | -0.6 | ||
Conservative hold | Swing |
Party | Candidate | Votes | % | ± | |
---|---|---|---|---|---|
Conservative | Lee Gordon-Walker | 1,369 | 59.4 | +0.0 | |
Liberal Democrat | Stephen Bacon | 446 | 19.3 | +0.5 | |
UKIP | Keith Knight | 257 | 11.1 | +3.6 | |
Labour | Jennifer Spratley | 234 | 10.1 | -0.2 | |
Majority | 923 | 40.1 | -0.5 | ||
Turnout | 2,306 | 35.2 | -3.1 | ||
Conservative hold | Swing |
Party | Candidate | Votes | % | ± | |
---|---|---|---|---|---|
Conservative | Claire Stretton | 1,330 | 74.5 | +1.0 | |
Liberal Democrat | Martin Alder | 382 | 21.4 | +2.6 | |
Labour | Stuart Crainer | 73 | 4.1 | +0.3 | |
Majority | 948 | 53.1 | -1.6 | ||
Turnout | 1,785 | 42.3 | -4.7 | ||
Conservative hold | Swing |
Party | Candidate | Votes | % | ± | |
---|---|---|---|---|---|
Conservative | Malcolm Bryant | 1,140 | 71.6 | +19.0 | |
Liberal Democrat | Richard Mitchell | 259 | 16.3 | +16.3 | |
Green | Marjory Bisset | 136 | 8.5 | +0.6 | |
UKIP | Andrew Findlay | 57 | 3.6 | +0.8 | |
Majority | 881 | 55.3 | +39.5 | ||
Turnout | 1,592 | 32.7 | -10.0 | ||
Conservative hold | Swing |
Party | Candidate | Votes | % | ± | |
---|---|---|---|---|---|
Liberal Democrat | Stephen Conway | 1,441 | 68.3 | +7.6 | |
Conservative | John Jarvis | 560 | 26.5 | +2.7 | |
Labour | Roy Mantel | 65 | 3.1 | -9.2 | |
UKIP | Gerald Sleep | 45 | 2.1 | -1.1 | |
Majority | 881 | 41.8 | +4.9 | ||
Turnout | 2,111 | 46.9 | -0.2 | ||
Liberal Democrat hold | Swing |
Party | Candidate | Votes | % | ± | |
---|---|---|---|---|---|
Conservative | Robert Wyatt | 929 | 60.2 | +0.2 | |
Liberal Democrat | David Vaughan | 304 | 19.7 | -3.8 | |
UKIP | Franklin Carstairs | 164 | 10.6 | -0.2 | |
Labour | John Woodward | 102 | 6.6 | +0.9 | |
BNP | Mark Burke | 44 | 2.9 | +2.9 | |
Majority | 625 | 40.5 | +4.0 | ||
Turnout | 1,543 | 37.9 | -0.9 | ||
Conservative hold | Swing |
Party | Candidate | Votes | % | ± | |
---|---|---|---|---|---|
Conservative | Elizabeth Siggery | 1,162 | 48.4 | +5.5 | |
Liberal Democrat | John Peffers | 997 | 41.5 | -6.2 | |
UKIP | Vincent Pearson | 134 | 5.6 | -0.1 | |
Labour | John Baker | 110 | 4.6 | +1.0 | |
Majority | 165 | 6.9 | |||
Turnout | 2,403 | 36.1 | -2.8 | ||
Conservative hold | Swing |
Party | Candidate | Votes | % | ± | |
---|---|---|---|---|---|
Conservative | Pauline Helliar-Symons | 1,714 | 76.2 | +4.6 | |
Liberal Democrat | Robert May | 302 | 13.4 | -3.5 | |
UKIP | Graham Widdows | 233 | 10.4 | -1.1 | |
Majority | 1,412 | 62.8 | +8.1 | ||
Turnout | 2,249 | 37.4 | -0.7 | ||
Conservative hold | Swing |
Elections to Weymouth and Portland Borough Council in Dorset, England were held on 1 May 2008. One third of the council was up for election and the council stayed under no overall control as it has been since 1980.
The 2002 Wokingham District Council election took place on 2 May 2002 to elect members of Wokingham Unitary Council in Berkshire, England. One third of the council was up for election and the Conservative party gained overall control of the council from no overall control.
The 2004 Wokingham District Council election took place on 10 June 2004 to elect members of Wokingham Unitary Council in Berkshire, England. The whole council was up for election with boundary changes since the last election in 2003. The Conservative party stayed in overall control of the council.
The 2006 Wokingham District Council election took place on 4 May 2006 to elect members of Wokingham Unitary Council in Berkshire, England. One third of the council was up for election and the Conservative party stayed in overall control of the council.
The 2007 Wokingham District Council election took place on 3 May 2007 to elect members of Wokingham Unitary Council in Berkshire, England. One third of the council was up for election and the Conservative party stayed in overall control of the council.
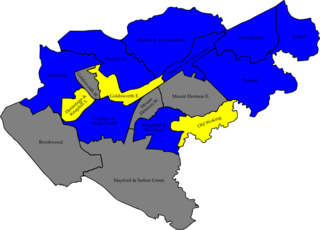
The 2007 Woking Council election took place on 3 May 2007 to elect members of Woking Borough Council in Surrey, England. One third of the council was up for election and the Conservative party gained overall control of the council from no overall control.
The 2003 Rushmoor Council election took place on 1 May 2003 to elect members of Rushmoor Borough Council in Hampshire, England. One third of the council was up for election and the Conservative party stayed in overall control of the council.
The 2008 Rushmoor Council election took place on 1 May 2008 to elect members of Rushmoor Borough Council in Hampshire, England. One third of the council was up for election and the Conservative party stayed in overall control of the council.
The 2007 Solihull Metropolitan Borough Council election took place on 4 May 2007 to elect members of Solihull Metropolitan Borough Council in the West Midlands, England. One third of the council was up for election and the Conservative party lost overall control of the council to no overall control.
The 2008 Basildon District Council election took place on 1 May 2008 to elect members of Basildon District Council in Essex, England. One third of the council was up for election and the Conservative party stayed in overall control of the council.
The 2006 Basingstoke and Deane Council election took place on 4 May 2006 to elect members of Basingstoke and Deane Borough Council in Hampshire, England. One third of the council was up for election and the council stayed under no overall control.
The 2007 Basingstoke and Deane Council election took place on 3 May 2007 to elect members of Basingstoke and Deane Borough Council in Hampshire, England. One third of the council was up for election and the Conservative party stayed in overall control of the council.
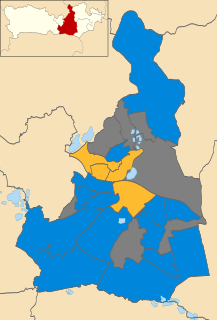
The 2010 Wokingham Borough Council election took place on 6 May 2010 to elect members of Wokingham Unitary Council in Berkshire, England. One third of the council was up for election and the Conservative party stayed in overall control of the council.
The 2011 Wokingham Borough Council election took place on 5 May 2011 to elect members of Wokingham Unitary Council in Berkshire, England. One third of the council was up for election and the Conservative party stayed in overall control of the council.
The 2003 Hertsmere Borough Council election took place on 1 May 2003 to elect members of Hertsmere Borough Council in Hertfordshire, England. One third of the council was up for election and the Conservative party stayed in overall control of the council.
The 2004 Hertsmere Borough Council election took place on 10 June 2004 to elect members of Hertsmere Borough Council in Hertfordshire, England. One third of the council was up for election and the Conservative party stayed in overall control of the council.
The 2012 Wokingham Borough Council election took place on Thursday 3 May 2012, the same day as other United Kingdom local elections, 2012, to elect members of Wokingham Unitary Council in Berkshire, England. One third of the council was up for election and the Conservative party stayed in overall control of the council.
The 2012 Pendle Borough Council election took place on 3 May 2012 to elect members of Pendle Borough Council in Lancashire, England. One third of the council was up for election and the council stayed under no overall control.
The 2010 Havant Borough Council election took place on 6 May 2010 to elect members of Havant Borough Council in Hampshire, England. One third of the council was up for election and the Conservative party stayed in overall control of the council.
The 2011 Harlow District Council election took place on 5 May 2011 to elect members of Harlow District Council in Essex, England. One third of the council was up for election and the Conservative party stayed in overall control of the council.