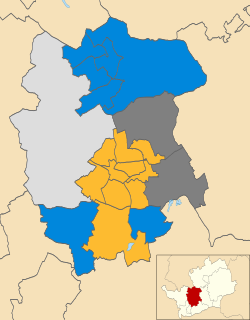
The 2006 Wokingham District Council election took place on 4 May 2006 to elect members of Wokingham Unitary Council in Berkshire, England. One third of the council was up for election and the Conservative party stayed in overall control of the council. [1]
A unitary authority is a type of local authority that has a single tier and is responsible for all local government functions within its area or performs additional functions which elsewhere in the relevant country are usually performed by national government or a higher level of sub-national government.
Berkshire is one of the home counties in England. It was recognised by the Queen as the Royal County of Berkshire in 1957 because of the presence of Windsor Castle, and letters patent were issued in 1974. Berkshire is a county of historic origin, a ceremonial county and a non-metropolitan county without a county council. The county town is Reading.
The Conservative Party, officially the Conservative and Unionist Party, is a centre-right political party in the United Kingdom. The governing party since 2010, it is the largest in the House of Commons, with 313 Members of Parliament, and also has 249 members of the House of Lords, 18 members of the European Parliament, 31 Members of the Scottish Parliament, 12 members of the Welsh Assembly, eight members of the London Assembly and 8,916 local councillors.
After the election, the composition of the council was
The election saw the United Kingdom Independence Party put forward a candidate in all of the 18 wards which were being contested. [3] This was the first time they had done this and meant they put forward more candidates than Labour who contested 16 of the wards. [3]
The Labour Party is a centre-left political party in the United Kingdom that has been described as an alliance of social democrats, democratic socialists and trade unionists. The party's platform emphasises greater state intervention, social justice and strengthening workers' rights.
During the campaign the Liberal Democrat leader on the council, Coling Lawley, received death threats, which led the police launch an investigation. [4]
The Liberal Democrats are a centrist, liberal political party in the United Kingdom. It is currently led by Vince Cable. It has 11 Members of Parliament in the House of Commons, 96 members of the House of Lords, one member of the European Parliament, five Members of the Scottish Parliament and one member in the Welsh Assembly and London Assembly. At the height of its influence, the party served as junior partners in a coalition government with the Conservative Party from 2010 to 2015.
The results saw the Conservatives strengthen their control of the council after gaining three seats from the Liberal Democrats. [5] The gains came in Coronation, Loddon and Hillside wards with one of the defeated Liberal Democrats being their leader Coling Lawley who lost by 472 votes in Coronation ward. [6] Overall turnout in the election was 39.8%. [7]
Voter turnout is the percentage of eligible voters who cast a ballot in an election. Eligibility varies by country, and the voting-eligible population should not be confused with the total adult population. Age and citizenship status are often among the criteria used to determine eligibility, but some countries further restrict eligibility based on sex, race, or religion.
Party | Seats | Gains | Losses | Net gain/loss | Seats % | Votes % | Votes | +/− | |
---|---|---|---|---|---|---|---|---|---|
Conservative | 15 | 3 | 0 | +3 | 83.3 | 56.3 | 20,353 | +3.1% | |
Liberal Democrat | 3 | 0 | 3 | -3 | 16.7 | 29.0 | 10,497 | -6.3% | |
Labour | 0 | 0 | 0 | 0 | 0 | 6.9 | 2,512 | +1.5% | |
UKIP | 0 | 0 | 0 | 0 | 0 | 6.5 | 2,333 | +0.8% | |
Green | 0 | 0 | 0 | 0 | 0 | 0.8 | 291 | +0.4% | |
Monster Raving Loony | 0 | 0 | 0 | 0 | 0 | 0.5 | 171 | +0.5% |
Party | Candidate | Votes | % | ± | |
---|---|---|---|---|---|
Conservative | Gary Cowan | 541 | 72.7 | -5.6 | |
Liberal Democrat | Stephen Bacon | 172 | 23.1 | +10.1 | |
UKIP | Ronald Bristow | 31 | 4.2 | -4.5 | |
Majority | 369 | 49.6 | -15.7 | ||
Turnout | 744 | 41.1 | +1.5 | ||
Conservative hold | Swing |
Party | Candidate | Votes | % | ± | |
---|---|---|---|---|---|
Liberal Democrat | Sellam Rahmouni | 999 | 43.8 | ||
Conservative | Tanya De Hoedt | 727 | 31.9 | ||
Labour | Gregory Bello | 338 | 14.8 | ||
UKIP | Peter Williams | 216 | 9.5 | ||
Majority | 272 | 11.9 | |||
Turnout | 2,280 | 38.7 | +0.6 | ||
Liberal Democrat hold | Swing |
Party | Candidate | Votes | % | ± | |
---|---|---|---|---|---|
Conservative | Keith Baker | 1,285 | 56.9 | ||
Liberal Democrat | Coling Lawley | 813 | 36.0 | ||
Labour | Jasdip Garcha | 88 | 3.9 | ||
UKIP | Amy Thornton | 72 | 3.2 | ||
Majority | 472 | 20.9 | |||
Turnout | 2,258 | 52.8 | +6.7 | ||
Conservative gain from Liberal Democrat | Swing | ||||
Party | Candidate | Votes | % | ± | |
---|---|---|---|---|---|
Conservative | Deborah Lewis | 1,448 | 54.6 | ||
Liberal Democrat | Keith Malvern | 757 | 28.5 | ||
UKIP | Ann Davis | 277 | 10.4 | ||
Labour | Anna Rogerson | 171 | 6.4 | ||
Majority | 691 | 26.1 | |||
Turnout | 2,653 | 44.6 | -0.3 | ||
Conservative hold | Swing |
Party | Candidate | Votes | % | ± | |
---|---|---|---|---|---|
Conservative | Denis Morgan | 1,367 | 58.2 | ||
Liberal Democrat | Jeremy Harley | 639 | 27.2 | ||
UKIP | Franklin Carstairs | 197 | 8.4 | ||
Labour | Franco Valente | 144 | 6.1 | ||
Majority | 728 | 31.0 | |||
Turnout | 2,347 | 37.0 | -3.7 | ||
Conservative hold | Swing |
Party | Candidate | Votes | % | ± | |
---|---|---|---|---|---|
Conservative | Robert Stanton | 1,363 | 71.1 | ||
Liberal Democrat | Roland Cundy | 382 | 19.9 | ||
UKIP | Ian Gordon | 116 | 6.0 | ||
Labour | Pippa White | 57 | 3.0 | ||
Majority | 981 | 51.2 | |||
Turnout | 1,918 | 46.8 | -0.1 | ||
Conservative hold | Swing |
Party | Candidate | Votes | % | ± | |
---|---|---|---|---|---|
Conservative | Simon Weeks | 1,221 | 68.9 | ||
Liberal Democrat | James May | 351 | 19.8 | ||
UKIP | Leslie Huntley | 113 | 6.4 | ||
Labour | Roger Hayes | 86 | 4.9 | ||
Majority | 870 | 49.1 | |||
Turnout | 1,771 | 42.0 | +1.8 | ||
Conservative hold | Swing |
Party | Candidate | Votes | % | ± | |
---|---|---|---|---|---|
Conservative | Michael Firmager | 1,152 | 59.9 | ||
Liberal Democrat | Jennifer Orchard | 505 | 26.3 | ||
Labour | Jacqueline Pluves | 175 | 9.1 | ||
UKIP | Vincent Pearson | 91 | 4.7 | ||
Majority | 607 | 33.6 | |||
Turnout | 1,923 | 30.9 | -1.3 | ||
Conservative hold | Swing |
Party | Candidate | Votes | % | ± | |
---|---|---|---|---|---|
Conservative | Andrew Bradley | 1,303 | 46.8 | ||
Liberal Democrat | Tania Christidis | 1,109 | 39.8 | ||
Labour | David Sharp | 183 | 6.6 | ||
Monster Raving Loony | Peter Owen | 120 | 4.3 | ||
UKIP | Andrew Findlay | 70 | 2.5 | ||
Majority | 194 | 7.0 | |||
Turnout | 2,785 | 42.6 | +3.2 | ||
Conservative gain from Liberal Democrat | Swing | ||||
Party | Candidate | Votes | % | ± | |
---|---|---|---|---|---|
Conservative | Abdul Loyes | 941 | 45.6 | ||
Liberal Democrat | Carol Jewell | 736 | 35.7 | ||
Labour | Alberto Troccoli | 241 | 11.7 | ||
UKIP | William Brooks | 144 | 7.0 | ||
Majority | 205 | 9.9 | |||
Turnout | 2,062 | 33.6 | +4.9 | ||
Conservative gain from Liberal Democrat | Swing | ||||
Party | Candidate | Votes | % | ± | |
---|---|---|---|---|---|
Conservative | Paul Swaddle | 1,295 | 52.2 | ||
Liberal Democrat | Caroline Smith | 735 | 29.6 | ||
Labour | Jacqueline Rupert | 173 | 7.0 | ||
Green | David Hogg | 164 | 6.6 | ||
UKIP | David Lamb | 112 | 4.5 | ||
Majority | 560 | 22.6 | |||
Turnout | 2,479 | 34.7 | -4.6 | ||
Conservative hold | Swing |
Party | Candidate | Votes | % | ± | |
---|---|---|---|---|---|
Conservative | David Lee | 1,452 | 63.7 | ||
Liberal Democrat | Michael Harper | 390 | 17.1 | ||
Labour | John Woodward | 228 | 10.0 | ||
UKIP | Keith Knight | 209 | 9.2 | ||
Majority | 1,062 | 46.6 | |||
Turnout | 2,279 | 37.9 | -1.1 | ||
Conservative hold | Swing |
Party | Candidate | Votes | % | ± | |
---|---|---|---|---|---|
Conservative | Christopher Schutz | 1,398 | 73.5 | ||
Liberal Democrat | Martin Alder | 357 | 18.8 | ||
UKIP | Geoffrey Bulpit | 75 | 3.9 | ||
Labour | Richard Fort | 72 | 3.8 | ||
Majority | 1,041 | 54.7 | |||
Turnout | 1,902 | 47.0 | -3.2 | ||
Conservative hold | Swing |
Party | Candidate | Votes | % | ± | |
---|---|---|---|---|---|
Conservative | Barrie Patman | 969 | 65.9 | ||
Liberal Democrat | Fiona Rolls | 203 | 13.8 | ||
Green | Marjory Bisset | 127 | 8.6 | ||
Labour | Julianne Grafton | 112 | 7.6 | ||
UKIP | Joan Huntley | 59 | 4.0 | ||
Majority | 766 | 52.1 | |||
Turnout | 1,470 | 35.7 | -2.0 | ||
Conservative hold | Swing |
Party | Candidate | Votes | % | ± | |
---|---|---|---|---|---|
Liberal Democrat | Elizabeth Rowland | 724 | 45.9 | ||
Conservative | Parvindar Batth | 611 | 38.7 | ||
Labour | Paul Sharples | 134 | 8.5 | ||
UKIP | David Hill | 108 | 6.8 | ||
Majority | 113 | 7.2 | |||
Turnout | 1,577 | 35.8 | +3.8 | ||
Liberal Democrat hold | Swing |
Party | Candidate | Votes | % | ± | |
---|---|---|---|---|---|
Conservative | Stuart Munro | 637 | 76.2 | +7.8 | |
Liberal Democrat | Denis Thair | 144 | 17.2 | -3.3 | |
UKIP | Jeremy Allison | 55 | 6.6 | -4.5 | |
Majority | 493 | 59.0 | +11.1 | ||
Turnout | 836 | 43.2 | +2.5 | ||
Conservative hold | Swing |
Party | Candidate | Votes | % | ± | |
---|---|---|---|---|---|
Liberal Democrat | Prue Bray | 1,199 | 47.9 | ||
Conservative | Derek Sefton | 1,083 | 43.2 | ||
UKIP | Anthony Pollock | 109 | 4.4 | ||
Labour | Keith Wilson | 63 | 2.5 | ||
Monster Raving Loony | Colin Forrestal | 51 | 2.0 | ||
Majority | 116 | 4.7 | |||
Turnout | 2,505 | 42.6 | +1.0 | ||
Liberal Democrat hold | Swing |
Party | Candidate | Votes | % | ± | |
---|---|---|---|---|---|
Conservative | Angus Ross | 1,560 | 65.9 | ||
Liberal Democrat | Philip Bristow | 282 | 11.9 | ||
UKIP | Graham Widdows | 279 | 11.8 | ||
Labour | Rosemary Chapman | 247 | 10.4 | ||
Majority | 1,278 | 54.0 | |||
Turnout | 2,368 | 40.3 | -0.7 | ||
Conservative hold | Swing |
The 2008 St Albans City and District Council election took place on 1 May 2008 to elect members of St Albans District Council in Hertfordshire, England. One third of the council was up for election and the Liberal Democrats gained overall control of the council from no overall control.
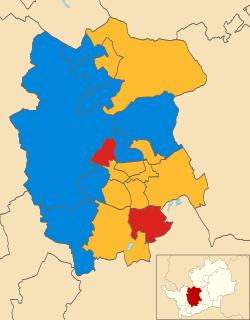
The 2006 St Albans City and District Council election took place on 4 May 2006 to elect members of St Albans District Council in Hertfordshire, England. One third of the council was up for election and the Liberal Democrats gained overall control of the council from no overall control.
The 2007 St Albans City and District Council election took place on 3 May 2007 to elect members of St Albans District Council in Hertfordshire, England. One third of the council was up for election and the Liberal Democrats lost overall control of the council to no overall control.
The 2002 Wokingham District Council election took place on 2 May 2002 to elect members of Wokingham Unitary Council in Berkshire, England. One third of the council was up for election and the Conservative party gained overall control of the council from no overall control.
The 2003 Wokingham District Council election took place on 1 May 2003 to elect members of Wokingham Unitary Council in Berkshire, England. One third of the council was up for election and the Conservative party stayed in overall control of the council.
The 2004 Wokingham District Council election took place on 10 June 2004 to elect members of Wokingham Unitary Council in Berkshire, England. The whole council was up for election with boundary changes since the last election in 2003. The Conservative party stayed in overall control of the council.
The 2007 Wokingham District Council election took place on 3 May 2007 to elect members of Wokingham Unitary Council in Berkshire, England. One third of the council was up for election and the Conservative party stayed in overall control of the council.
The 2008 Wokingham Borough Council election took place on 1 May 2008 to elect members of Wokingham Unitary Council in Berkshire, England. One third of the council was up for election and the Conservative party stayed in overall control of the council.
The 2006 Winchester Council election took place on 4 May 2006 to elect members of Winchester District Council in Hampshire, England. One third of the council was up for election and the Conservative party gained overall control of the council from no overall control.
The 2007 Winchester Council election took place on 3 May 2007 to elect members of Winchester District Council in Hampshire, England. One third of the council was up for election and the Conservative party stayed in overall control of the council.
The 2002 Halton Borough Council election took place on 2 May 2002 to elect members of Halton Unitary Council in Cheshire, England. One third of the council was up for election and the Labour party stayed in overall control of the council.
The 2007 Halton Borough Council election took place on 3 May 2007 to elect members of Halton Unitary Council in Cheshire, England. One third of the council was up for election and the Labour party stayed in overall control of the council.
Elections to Bolton Metropolitan Borough Council was held on 6 May 2010, on the same day as the General Election which led to a much higher turnout than in recent years. One third of the council was up for election and the council stayed under no overall control.
The 2008 Rushmoor Council election took place on 1 May 2008 to elect members of Rushmoor Borough Council in Hampshire, England. One third of the council was up for election and the Conservative party stayed in overall control of the council.
The 2006 Sunderland Council election took place on 4 May 2006 to elect members of Sunderland City Council in Tyne and Wear, England. One third of the Council was up for election and the Labour party stayed in overall control.
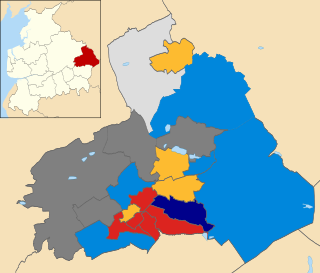
The 2008 Pendle Borough Council election took place on 1 May 2008 to elect members of Pendle Borough Council in Lancashire, England. One third of the council was up for election and the Liberal Democrats lost overall control of the council to no overall control.
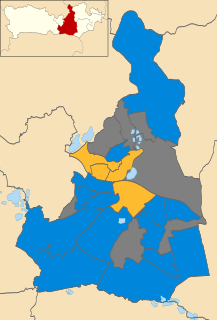
The 2010 Wokingham Borough Council election took place on 6 May 2010 to elect members of Wokingham Unitary Council in Berkshire, England. One third of the council was up for election and the Conservative party stayed in overall control of the council.
The 2011 Wokingham Borough Council election took place on 5 May 2011 to elect members of Wokingham Unitary Council in Berkshire, England. One third of the council was up for election and the Conservative party stayed in overall control of the council.
The 2012 Wokingham Borough Council election took place on Thursday 3 May 2012, the same day as other United Kingdom local elections, 2012, to elect members of Wokingham Unitary Council in Berkshire, England. One third of the council was up for election and the Conservative party stayed in overall control of the council.
The 2011 Harlow District Council election took place on 5 May 2011 to elect members of Harlow District Council in Essex, England. One third of the council was up for election and the Conservative party stayed in overall control of the council.