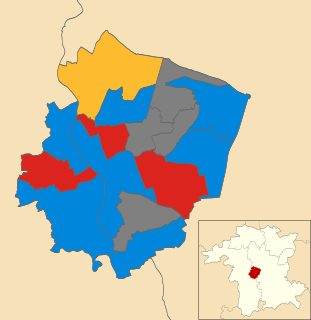
The 2006 Worcester City Council election took place on 4 May 2006 to elect members of Worcester District Council in Worcestershire, England. One third of the council was up for election and the Conservative party stayed in overall control of the council. [1]
Worcester is a city in Worcestershire, England, 31 miles (50 km) southwest of Birmingham, 101 miles (163 km) west-northwest of London, 27 miles (43 km) north of Gloucester and 23 miles (37 km) northeast of Hereford. The population is approximately 100,000. The River Severn flanks the western side of the city centre, which is overlooked by Worcester Cathedral.
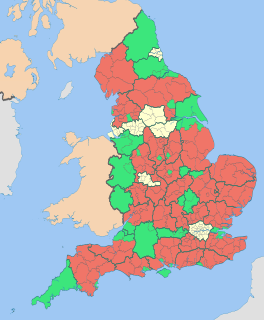
Non-metropolitan districts, or colloquially "shire districts", are a type of local government district in England. As created, they are sub-divisions of non-metropolitan counties in a two-tier arrangement.
Worcestershire is a county in the West Midlands of England. Between 1974 and 1998, it was merged with the neighbouring county of Herefordshire as Hereford and Worcester.
After the election, the composition of the council was
The Conservative Party, officially the Conservative and Unionist Party, is a centre-right political party in the United Kingdom. Presently led by Theresa May, it has been the governing party since 2010. It presently has 314 Members of Parliament in the House of Commons, 249 members of the House of Lords, and 18 members of the European Parliament. It also has 31 Members of the Scottish Parliament, 12 members of the Welsh Assembly, eight members of the London Assembly and 9,008 local councillors. One of the major parties of UK politics, it has formed the government on 45 occasions, more than any other party.
The Labour Party is a centre-left political party in the United Kingdom which has been described as an alliance of social democrats, democratic socialists and trade unionists. The party's platform emphasises greater state intervention, social justice and strengthening workers' rights. Labour is a full member of the Party of European Socialists and Progressive Alliance, and holds observer status in the Socialist International. As of 2017, the party was considered the "largest party in Western Europe" in terms of party membership, with more than half a million members.
The Liberal Democrats are a liberal, centrist political party in the United Kingdom. They presently have 11 Members of Parliament in the House of Commons, 96 members of the House of Lords, and one member of the European Parliament. They also have five Members of the Scottish Parliament and a member each in the Welsh Assembly and London Assembly. The party reached the height of its influence in the early 2010s, forming a junior partner in a coalition government from 2010 to 2015. It is presently led by Vince Cable.
45 candidates competed in the election for the 12 seats which were being contested. [3] Before the election the Conservatives had a one-seat majority with 18 of the 35 councillors, as compared to 10 Labour, 4 independents and 3 Liberal Democrats. [3]
A Councillor is a member of a local government council.
The results saw the Conservatives defend what was regarded as their most marginal council in the country, however Labour did make one gain from an independent. [4] [5] The Conservatives were seen as having benefited from the troubles of the national Labour government which helped them stay in control of the council. [6] Voter turnout was higher than expectations with Claines ward seeing a 49% turnout and Battenhall 43.1%. [6]
Voter turnout is the percentage of eligible voters who cast a ballot in an election. Eligibility varies by country, and the voting-eligible population should not be confused with the total adult population. Age and citizenship status are often among the criteria used to determine eligibility, but some countries further restrict eligibility based on sex, race, or religion.
Following the election the leader of the council, Stephen Inman, stood down and was succeeded by fellow Conservative councillor Simon Geraghty. [7]
Party | Seats | Gains | Losses | Net gain/loss | Seats % | Votes % | Votes | +/− | |
---|---|---|---|---|---|---|---|---|---|
Conservative | 6 | 0 | 0 | 0 | 50.0 | 39.7 | 8,458 | -5.9% | |
Labour | 5 | 1 | 0 | +1 | 41.7 | 29.1 | 6,196 | +0.3% | |
Liberal Democrat | 1 | 0 | 0 | 0 | 8.3 | 13.0 | 2,764 | -2.4% | |
Green | 0 | 0 | 0 | 0 | 0 | 11.6 | 2,461 | +11.6% | |
BNP | 0 | 0 | 0 | 0 | 0 | 3.5 | 751 | +1.9% | |
Independent | 0 | 0 | 1 | -1 | 0 | 3.2 | 673 | -5.4% |
Party | Candidate | Votes | % | ± | |
---|---|---|---|---|---|
Conservative | David Tibbutt | 1,015 | 57.0 | ||
Labour | Christopher Winwood | 374 | 21.0 | ||
Liberal Democrat | Paul Griffiths | 220 | 12.4 | ||
Green | Ruth Stafford | 171 | 9.6 | ||
Majority | 641 | 36.0 | |||
Turnout | 1,780 | 43.1 | |||
Conservative hold | Swing |
Party | Candidate | Votes | % | ± | |
---|---|---|---|---|---|
Conservative | Barry Mackenzie-Williams | 1,203 | 51.9 | ||
Labour | Jennifer Barnes | 547 | 23.6 | ||
Liberal Democrat | Vaughan Hencher | 315 | 13.6 | ||
Green | Janet Dyer | 252 | 10.9 | ||
Majority | 656 | 28.3 | |||
Turnout | 2,317 | 37.4 | |||
Conservative hold | Swing |
Party | Candidate | Votes | % | ± | |
---|---|---|---|---|---|
Conservative | Mohammed Riaz | 1,127 | 48.3 | ||
Labour | Matthew Lamb | 597 | 25.6 | ||
Liberal Democrat | Iain MacBriar | 329 | 14.1 | ||
Green | Martin Sullivan | 280 | 12.0 | ||
Majority | 530 | 22.7 | |||
Turnout | 2,333 | 35.6 | |||
Conservative hold | Swing |
Party | Candidate | Votes | % | ± | |
---|---|---|---|---|---|
Liberal Democrat | Alexander Kear | 1,649 | 51.9 | ||
Conservative | Robert Campbell | 1,067 | 33.6 | ||
Labour | Colin Layland | 253 | 8.0 | ||
Green | Peter Robinson | 209 | 6.6 | ||
Majority | 582 | 18.3 | |||
Turnout | 3,178 | 49.3 | |||
Liberal Democrat hold | Swing |
Party | Candidate | Votes | % | ± | |
---|---|---|---|---|---|
Labour | Geoffrey Williams | 594 | 44.0 | ||
BNP | Martin Roberts | 331 | 24.5 | ||
Conservative | Gordon Hazelton | 200 | 14.8 | ||
Independent | Dennis Powell | 149 | 11.0 | ||
Green | Linda Smith | 76 | 5.6 | ||
Majority | 263 | 19.5 | |||
Turnout | 1,350 | 33.0 | |||
Labour hold | Swing |
Party | Candidate | Votes | % | ± | |
---|---|---|---|---|---|
Labour | Patricia Agar | 711 | 32.5 | ||
Independent | Stanley Knowles | 524 | 24.0 | ||
BNP | Michael Peat | 420 | 19.2 | ||
Conservative | Nicholas Turner | 364 | 16.7 | ||
Green | Alexander Gwinn | 167 | 7.6 | ||
Majority | 187 | 8.5 | |||
Turnout | 2,186 | 36.0 | |||
Labour gain from Independent | Swing | ||||
Party | Candidate | Votes | % | ± | |
---|---|---|---|---|---|
Labour | Paul Denham | 515 | 48.7 | ||
Green | James Roberts | 332 | 31.4 | ||
Conservative | Wasib Shah | 211 | 19.9 | ||
Majority | 183 | 17.3 | |||
Turnout | 1,058 | 25.1 | |||
Labour hold | Swing |
Party | Candidate | Votes | % | ± | |
---|---|---|---|---|---|
Labour | Samuel Arnold | 878 | 49.3 | ||
Conservative | Melanie Heider | 537 | 30.2 | ||
Green | Clive Matthews | 365 | 20.5 | ||
Majority | 341 | 19.1 | |||
Turnout | 1,780 | 30.1 | |||
Labour hold | Swing |
Party | Candidate | Votes | % | ± | |
---|---|---|---|---|---|
Conservative | Frank Tarbuck | 856 | 59.0 | ||
Liberal Democrat | Louis Stephen | 251 | 17.3 | ||
Labour | Richard Udall | 219 | 15.1 | ||
Green | Louise Diamond | 125 | 8.6 | ||
Majority | 637 | 41.7 | |||
Turnout | 1,451 | 34.0 | |||
Conservative hold | Swing |
Party | Candidate | Votes | % | ± | |
---|---|---|---|---|---|
Labour | Josephine Hodges | 498 | 53.1 | ||
Conservative | Colin Bruton | 270 | 28.8 | ||
Green | Catherine Wildish | 170 | 18.1 | ||
Majority | 228 | 24.3 | |||
Turnout | 938 | 24.8 | |||
Labour hold | Swing |
Party | Candidate | Votes | % | ± | |
---|---|---|---|---|---|
Conservative | Stephen Hodgson | 730 | 46.5 | ||
Labour | Marc Bayliss | 676 | 43.1 | ||
Green | Robert Wilkins | 163 | 10.4 | ||
Majority | 54 | 3.4 | |||
Turnout | 1,569 | 39.1 | |||
Conservative hold | Swing |
Party | Candidate | Votes | % | ± | |
---|---|---|---|---|---|
Conservative | Andrew Roberts | 878 | 64.4 | ||
Labour | John Buckley | 334 | 24.5 | ||
Green | Olaf Twiehaus | 151 | 11.1 | ||
Majority | 544 | 39.9 | |||
Turnout | 1,363 | 34.2 | |||
Conservative hold | Swing |
The 1998 Solihull Metropolitan Borough Council election took place on 7 May 1998 to elect members of Solihull Metropolitan Borough Council in the West Midlands, England. One third of the council was up for election and the council stayed under no overall control.
The 2002 St Albans City and District Council election took place on 2 May 2002 to elect members of St Albans District Council in Hertfordshire, England. One third of the council was up for election and the council stayed under no overall control.
The 2006 Wyre Forest District Council election took place on 4 May 2006 to elect members of Wyre Forest District Council in Worcestershire, England. One third of the council was up for election and the council stayed under no overall control.
The 2008 Wyre Forest District Council election took place on 1 May 2008 to elect members of Wyre Forest District Council in Worcestershire, England. One third of the council was up for election and the Conservative party gained overall control of the council from no overall control.
The 1999 Worcester City Council election took place on 6 May 1999 to elect members of Worcester District Council in Worcestershire, England. One third of the council was up for election and the Labour party stayed in overall control of the council.
The 2003 Worcester City Council election took place on 1 May 2003 to elect members of Worcester District Council in Worcestershire, England. One third of the council was up for election and the Conservative party gained overall control of the council from no overall control.
The 2007 Worcester City Council election took place on 3 May 2007 to elect members of Worcester District Council in Worcestershire, England. One third of the council was up for election and the Conservative party stayed in overall control of the council.
The 2008 Worcester City Council election took place on 1 May 2008 to elect members of Worcester District Council in Worcestershire, England. One third of the council was up for election and the council stayed under no overall control.
The 2006 Woking Council election took place on 4 May 2006 to elect members of Woking Borough Council in Surrey, England. One third of the council was up for election and the council stayed under no overall control.
The 2006 Winchester Council election took place on 4 May 2006 to elect members of Winchester District Council in Hampshire, England. One third of the council was up for election and the Conservative party gained overall control of the council from no overall control.
The 2007 Southend-on-Sea Council election took place on 3 May 2007 to elect members of Southend-on-Sea Unitary Council in Essex, England. One third of the council was up for election and the Conservative party stayed in overall control of the council.
The 1999 Solihull Metropolitan Borough Council election took place on 6 May 1999 to elect members of Solihull Metropolitan Borough Council in the West Midlands, England. One third of the council was up for election and the council stayed under no overall control.
The 2006 Solihull Metropolitan Borough Council election took place on 4 May 2006 to elect members of Solihull Metropolitan Borough Council in the West Midlands, England. One third of the council was up for election and the Conservative party stayed in overall control of the council.
The 2006 Sunderland Council election took place on 4 May 2006 to elect members of Sunderland City Council in Tyne and Wear, England. One third of the Council was up for election and the Labour party stayed in overall control.
The 2007 Sunderland Council election took place on 3 May 2007 to elect members of Sunderland Metropolitan Borough Council in Tyne and Wear, England. One third of the council was up for election and the Labour party stayed in overall control of the council.
The 2008 Sunderland Council election took place on 1 May 2008 to elect members of Sunderland Metropolitan Borough Council in Tyne and Wear, England. One third of the council was up for election and the Labour party stayed in overall control of the council.
The 2010 Sunderland Council election took place on 6 May 2010 to elect members of Sunderland Metropolitan Borough Council in Tyne and Wear, England. One third of the council was up for election and the Labour party stayed in overall control of the council. The election took place on the same day as the 2010 General Election.
The 2006 Harrogate Council election took place on 4 May 2006 to elect members of Harrogate Borough Council in North Yorkshire, England. One third of the council was up for election and the Conservative party lost overall control of the council to no overall control.
The 2006 Maidstone Borough Council election took place on 4 May 2006 to elect members of Maidstone Borough Council in Kent, England. One third of the council was up for election and the council stayed under no overall control.
The 2006 West Oxfordshire District Council election took place on 4 May 2006 to elect members of West Oxfordshire District Council in Oxfordshire, England. One third of the council was up for election and the Conservative party stayed in overall control of the council.