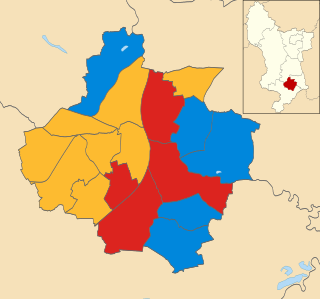
The 2006 Derby City Council election took place on 4 May 2006 to elect members of Derby City Council in England. One third of the council was up for election and the Labour party lost their majority on the council to no overall control. [1]
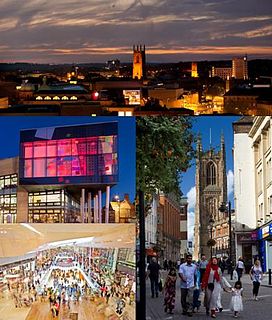
Derby is a city and unitary authority area in Derbyshire, England. It lies on the banks of the River Derwent in the south of Derbyshire, of which it was traditionally the county town. At the 2011 census, the population was 248,700. Derby gained city status in 1977.
Derby City Council is the local government unitary authority for Derby, a city in the East Midlands region of England. It is composed of 51 councillors, three for each of the 17 electoral wards of Derby. Currently there is no overall control of the council, with the Labour Party being the biggest party. The acting council chief executive is Christine Durrant. Carole Mills will take over as Chief Executive from August 2018.
England is a country that is part of the United Kingdom. It shares land borders with Wales to the west and Scotland to the north-northwest. The Irish Sea lies west of England and the Celtic Sea lies to the southwest. England is separated from continental Europe by the North Sea to the east and the English Channel to the south. The country covers five-eighths of the island of Great Britain, which lies in the North Atlantic, and includes over 100 smaller islands, such as the Isles of Scilly and the Isle of Wight.
The Labour party had regained a majority of one on the council after a gain from the Liberal Democrats in a July 2005 by-election in Abbey ward. [2] [3] However they were expected to lose control of the council in the 2006 election. [2] The campaign saw controversy over the Conservative candidate for Sinfin ward, Randeep Kaur Samra, who was under the legal age of 21 for standing in the election, leading to other political parties demanding an apology from the Conservatives. [4]
The Liberal Democrats are a liberal political party in the United Kingdom. They presently have 11 Members of Parliament in the House of Commons, 96 members of the House of Lords, and one member of the European Parliament. They also have five Members of the Scottish Parliament and a member each in the Welsh Assembly and London Assembly. The party reached the height of its influence in the early 2010s, forming a junior partner in a coalition government from 2010 to 2015. It is presently led by Vince Cable.
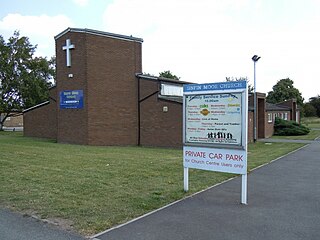
Sinfin is a suburb and ward of the city of Derby, in Derbyshire, England. It is situated approximately 3 miles (4.8 km) south-southwest of the city centre on Derby's southern outskirts. The ward, which includes Osmaston as well as Sinfin itself, had a population of 15,128 in 2011. Historically, Sinfin and Osmaston were separate villages before being swallowed up by the expansion of Derby. Osmaston is characterised by inter-war housing developments while much of the housing in Sinfin is postwar. Between the two suburbs lies a more industrialised area dominated by the Rolls-Royce works.
The Conservative Party, officially the Conservative and Unionist Party, is a centre-right political party in the United Kingdom. Presently led by Theresa May, it has been the governing party since 2010. It presently has 314 Members of Parliament in the House of Commons, 249 members of the House of Lords, and 18 members of the European Parliament. It also has 31 Members of the Scottish Parliament, 12 members of the Welsh Assembly, eight members of the London Assembly and 9,008 local councillors. One of the major parties of UK politics, it has formed the government on 45 occasions, more than any other party.
The results saw the Liberal Democrats gain three seats from Labour to deprive them of their majority, although Labour gained one seat from the Conservatives. [5] Overall turnout was 35.2% and talks followed the election to decide who would run the council. [5] These resulted in an agreement between Labour and the Conservatives, which meant Labour would continue to form the administration but with the Conservatives taking 3 of the 10 seats in the cabinet. [6]
Voter turnout is the percentage of eligible voters who cast a ballot in an election. Eligibility varies by country, and the voting-eligible population should not be confused with the total adult population. Age and citizenship status are often among the criteria used to determine eligibility, but some countries further restrict eligibility based on sex, race, or religion.
After the election, the composition of the council was
The Labour Party is a centre-left political party in the United Kingdom which has been described as an alliance of social democrats, democratic socialists and trade unionists. The party's platform emphasises greater state intervention, social justice and strengthening workers' rights.
Party | Seats | Gains | Losses | Net gain/loss | Seats % | Votes % | Votes | +/− | |
---|---|---|---|---|---|---|---|---|---|
Labour | 8 | 1 | 3 | -2 | 41.2 | 34.3 | 20,512 | +2.1% | |
Liberal Democrat | 7 | 3 | 0 | +3 | 41.2 | 29.9 | 17,867 | +1.0% | |
Conservative | 3 | 0 | 1 | -1 | 17.6 | 32.0 | 19,143 | +4.2% | |
Green | 0 | 0 | 0 | 0 | 0 | 2.0 | 1,173 | +2.0% | |
Independent | 0 | 0 | 0 | 0 | 0 | 1.7 | 1,041 | +0.8% |
Party | Candidate | Votes | % | ± | |
---|---|---|---|---|---|
Liberal Democrat | Deirdre Mitchell | 1,365 | 45.8 | +3.4 | |
Labour | Samuel Greer | 1,134 | 38.0 | +9.3 | |
Conservative | Robin Wood | 299 | 10.0 | -2.4 | |
Green | Stephen Shelton | 184 | 6.2 | +6.2 | |
Majority | 231 | 7.8 | -5.9 | ||
Turnout | 2,982 | 26.7 | -15.2 | ||
Liberal Democrat hold | Swing |
Party | Candidate | Votes | % | ± | |
---|---|---|---|---|---|
Conservative | Roy Webb | 3,228 | 65.2 | +19.8 | |
Labour | Margot Keats | 962 | 19.4 | -0.3 | |
Liberal Democrat | Roger Jackson | 763 | 15.4 | -1.0 | |
Majority | 2,266 | 45.8 | +20.1 | ||
Turnout | 4,953 | 46.3 | -14.1 | ||
Conservative hold | Swing |
Party | Candidate | Votes | % | ± | |
---|---|---|---|---|---|
Liberal Democrat | Julie Ginns | 1,455 | 43.2 | +28.1 | |
Labour | Jonathan Bayliss | 1,226 | 36.4 | -3.7 | |
Conservative | Simon Hart | 486 | 14.4 | -2.8 | |
Green | Jean MacDonald | 201 | 6.0 | +6.0 | |
Majority | 229 | 6.8 | |||
Turnout | 3,368 | 31.9 | -9.4 | ||
Liberal Democrat gain from Labour | Swing | ||||
Party | Candidate | Votes | % | ± | |
---|---|---|---|---|---|
Liberal Democrat | Rehmet Kham | 1,454 | 42.9 | +3.2 | |
Labour | Abdul Rehman | 1,394 | 41.1 | -4.5 | |
Conservative | Mohammed Yaqub | 540 | 15.9 | +1.3 | |
Majority | 60 | 1.8 | |||
Turnout | 3,388 | 35.4 | -14.0 | ||
Liberal Democrat gain from Labour | Swing | ||||
Party | Candidate | Votes | % | ± | |
---|---|---|---|---|---|
Liberal Democrat | Ruth Skelton | 2,085 | 48.5 | -6.6 | |
Labour | Bhagat Shanker | 1,283 | 29.9 | +3.2 | |
Conservative | David Greenway | 724 | 16.8 | -1.4 | |
Green | Clare Shelton | 206 | 4.8 | +4.8 | |
Majority | 802 | 18.6 | -9.8 | ||
Turnout | 4,298 | 45.0 | -7.2 | ||
Liberal Democrat hold | Swing |
Party | Candidate | Votes | % | ± | |
---|---|---|---|---|---|
Labour | Ranjit Banwait | 1,536 | 46.2 | ||
Independent | Brenda Longworth | 729 | 21.9 | ||
Conservative | Adam Thomas | 699 | 21.0 | ||
Liberal Democrat | Grahame Elson | 364 | 10.9 | ||
Majority | 807 | 24.3 | |||
Turnout | 3,328 | 33.6 | -12.0 | ||
Labour hold | Swing |
Party | Candidate | Votes | % | ± | |
---|---|---|---|---|---|
Labour | Sara Bolton | 1,541 | 46.8 | +3.6 | |
Conservative | Alan Grimadell | 1,273 | 38.7 | +1.9 | |
Liberal Democrat | David Batey | 477 | 14.5 | -1.1 | |
Majority | 268 | 8.1 | +1.7 | ||
Turnout | 3,291 | 33.8 | -14.4 | ||
Labour hold | Swing |
Party | Candidate | Votes | % | ± | |
---|---|---|---|---|---|
Labour | Philip Ingall | 1,717 | 45.6 | +4.3 | |
Conservative | Paul Willitts | 1,709 | 45.4 | +16.5 | |
Liberal Democrat | John Banks | 338 | 9.0 | +0.3 | |
Majority | 8 | 0.2 | -12.2 | ||
Turnout | 3,764 | 37.3 | -13.4 | ||
Labour gain from Conservative | Swing | ||||
Party | Candidate | Votes | % | ± | |
---|---|---|---|---|---|
Liberal Democrat | Wendy Harbon | 1,393 | 36.4 | -2.3 | |
Labour | Martin Repton | 1,250 | 32.7 | +1.5 | |
Conservative | Andrew Hill | 831 | 21.7 | -8.5 | |
Green | Jane Temple | 348 | 9.1 | +9.1 | |
Majority | 143 | 3.7 | -3.8 | ||
Turnout | 3,822 | 41.2 | -7.2 | ||
Liberal Democrat gain from Labour | Swing | ||||
Party | Candidate | Votes | % | ± | |
---|---|---|---|---|---|
Labour | David Roberts | 1,179 | 48.0 | -1.4 | |
Conservative | Franklyn Harwood | 677 | 27.6 | -3.6 | |
Independent | William Wright | 312 | 12.7 | +12.7 | |
Liberal Democrat | Christopher Goacher | 288 | 11.7 | -7.7 | |
Majority | 502 | 20.4 | +2.2 | ||
Turnout | 2,456 | 17.5 | -24.1 | ||
Labour hold | Swing |
Party | Candidate | Votes | % | ± | |
---|---|---|---|---|---|
Liberal Democrat | Lucy Care | 2,603 | 61.3 | +1.4 | |
Conservative | Terry Boston | 1,057 | 24.9 | -0.3 | |
Labour | Jogindar Johal | 586 | 13.8 | -1.1 | |
Majority | 1,546 | 36.4 | +1.7 | ||
Turnout | 4,246 | 43.8 | -7.2 | ||
Liberal Democrat hold | Swing |
Party | Candidate | Votes | % | ± | |
---|---|---|---|---|---|
Labour | Raymond Baxter | 1,331 | 49.8 | +6.2 | |
Conservative | Alexander Williams | 737 | 27.6 | +3.9 | |
Liberal Democrat | Lorraine Brown | 606 | 22.7 | -9.9 | |
Majority | 594 | 22.2 | +11.2 | ||
Turnout | 2,674 | 29.4 | -12.9 | ||
Labour hold | Swing |
Party | Candidate | Votes | % | ± | |
---|---|---|---|---|---|
Liberal Democrat | Marilyn Winter | 2,421 | 47.9 | -11.0 | |
Conservative | Matthew Holmes | 2,022 | 40.0 | +11.8 | |
Labour | Clair Hinson | 613 | 12.1 | -0.8 | |
Majority | 399 | 7.9 | -22.8 | ||
Turnout | 5,056 | 45.9 | -10.9 | ||
Liberal Democrat hold | Swing |
Party | Candidate | Votes | % | ± | |
---|---|---|---|---|---|
Labour | Christopher Williamson | 1,657 | 53.5 | +20.6 | |
Liberal Democrat | Harjinder Naitta | 839 | 27.1 | +8.1 | |
Conservative | Masadiq Hussain | 601 | 19.4 | +10.4 | |
Majority | 818 | 26.4 | +12.5 | ||
Turnout | 3,097 | 31.6 | -21.4 | ||
Labour hold | Swing |
Party | Candidate | Votes | % | ± | |
---|---|---|---|---|---|
Conservative | Pauline Latham | 1,753 | 56.8 | +7.1 | |
Labour | Phillip Woodhead | 780 | 25.3 | -7.4 | |
Liberal Democrat | Eric Asburner | 317 | 10.3 | -7.2 | |
Green | Henrik Skov | 234 | 7.6 | +7.6 | |
Majority | 973 | 31.5 | +14.5 | ||
Turnout | 3,084 | 31.0 | -16.2 | ||
Conservative hold | Swing |
Party | Candidate | Votes | % | ± | |
---|---|---|---|---|---|
Labour | Robin Turner | 1,295 | 58.7 | +13.6 | |
Liberal Democrat | Leigh Alcock | 549 | 24.9 | -5.7 | |
Conservative | Randeep Samra | 362 | 16.4 | -7.9 | |
Majority | 746 | 33.8 | +19.3 | ||
Turnout | 2,206 | 24.6 | -12.8 | ||
Labour hold | Swing |
Party | Candidate | Votes | % | ± | |
---|---|---|---|---|---|
Conservative | Christopher Poulter | 2,145 | 57.6 | +4.6 | |
Labour | Richard Morgan | 1,028 | 27.6 | +2.3 | |
Liberal Democrat | Patrick Peat | 550 | 14.8 | -6.9 | |
Majority | 1,117 | 30.0 | +2.3 | ||
Turnout | 3,723 | 39.9 | -12.4 | ||
Conservative hold | Swing |
The 2003 Redditch Borough Council election took place on 1 May 2003 to elect members of Redditch Borough Council in the West Midlands region, England. One third of the council was up for election and the council stayed under no overall control.
The 2008 Derby City Council election took place on 1 May 2008 to elect members of Derby City Council in England. One third of the council was up for election and the council stayed under no overall control. Overall turnout was 34.6%.
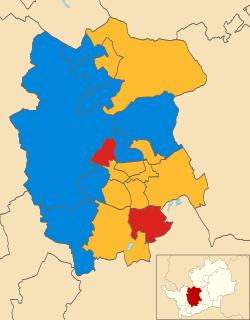
The 2006 St Albans City and District Council election took place on 4 May 2006 to elect members of St Albans District Council in Hertfordshire, England. One third of the council was up for election and the Liberal Democrats gained overall control of the council from no overall control.
The 2008 Wyre Forest District Council election took place on 1 May 2008 to elect members of Wyre Forest District Council in Worcestershire, England. One third of the council was up for election and the Conservative party gained overall control of the council from no overall control.
The 2003 Worcester City Council election took place on 1 May 2003 to elect members of Worcester District Council in Worcestershire, England. One third of the council was up for election and the Conservative party gained overall control of the council from no overall control.
The 2006 Worcester City Council election took place on 4 May 2006 to elect members of Worcester District Council in Worcestershire, England. One third of the council was up for election and the Conservative party stayed in overall control of the council.
The 2008 Worcester City Council election took place on 1 May 2008 to elect members of Worcester District Council in Worcestershire, England. One third of the council was up for election and the council stayed under no overall control.
The 2010 Winchester Council election took place on 6 May 2010 to elect members of Winchester District Council in Hampshire, England. One third of the council was up for election and the Liberal Democrats gained overall control of the council from the Conservative party.
The 2006 Winchester Council election took place on 4 May 2006 to elect members of Winchester District Council in Hampshire, England. One third of the council was up for election and the Conservative party gained overall control of the council from no overall control.
The 2006 Welwyn Hatfield District Council election took place on 4 May 2006 to elect members of Welwyn Hatfield District Council in Hertfordshire, England. One third of the council was up for election and the Conservative party stayed in overall control of the council.
The 2000 Southend-on-Sea Council election took place on 4 May 2000 to elect members of Southend-on-Sea Unitary Council in Essex, England. One third of the council was up for election and the Conservative party gained overall control of the council from no overall control.
The 2003 Southend-on-Sea Council election took place on 1 May 2003 to elect members of Southend-on-Sea Unitary Council in Essex, England. One third of the council was up for election and the Conservative party stayed in overall control of the council.
The 2007 West Lancashire District Council election took place on 3 May 2007 to elect members of West Lancashire District Council in Lancashire, England. One third of the council was up for election and the Conservative party stayed in overall control of the council.
The 2010 Craven District Council election took place on 6 May 2010 to elect members of Craven District Council in North Yorkshire, England. One third of the council was up for election and the Conservative party gained overall control of the council from no overall control.
The 2010 West Lancashire Borough Council election took place on 6 May 2010 to elect members of West Lancashire Borough Council in Lancashire, England. One third of the council was up for election and the Conservative party stayed in overall control of the council.
The 2003 Solihull Metropolitan Borough Council election took place on 1 May 2003 to elect members of Solihull Metropolitan Borough Council in the West Midlands, England. One third of the council was up for election and the Conservative party stayed in overall control of the council.
The 2006 Solihull Metropolitan Borough Council election took place on 4 May 2006 to elect members of Solihull Metropolitan Borough Council in the West Midlands, England. One third of the council was up for election and the Conservative party stayed in overall control of the council.
The 2006 Sunderland Council election took place on 4 May 2006 to elect members of Sunderland City Council in Tyne and Wear, England. One third of the Council was up for election and the Labour party stayed in overall control.
The 2008 Sunderland Council election took place on 1 May 2008 to elect members of Sunderland Metropolitan Borough Council in Tyne and Wear, England. One third of the council was up for election and the Labour party stayed in overall control of the council.
The 2006 Havant Borough Council election took place on 4 May 2006 to elect members of Havant Borough Council in Hampshire, England. One third of the council was up for election and the Conservative party stayed in overall control of the council.