The 2015 Derbyshire Dales District Council election took place on 7 May 2015 to elect members of Derbyshire Dales District Council in England. [1] This was on the same day as other local elections.
After the election, the composition of the council was:
The Conservative Party, officially the Conservative and Unionist Party, is a centre-right political party in the United Kingdom. Presently led by Theresa May, it has been the governing party since 2010. It presently has 314 Members of Parliament in the House of Commons, 249 members of the House of Lords, and 18 members of the European Parliament. It also has 31 Members of the Scottish Parliament, 12 members of the Welsh Assembly, eight members of the London Assembly and 9,008 local councillors. One of the major parties of UK politics, it has formed the government on 45 occasions, more than any other party.
The Labour Party is a centre-left political party in the United Kingdom which has been described as an alliance of social democrats, democratic socialists and trade unionists. The party's platform emphasises greater state intervention, social justice and strengthening workers' rights.
The Liberal Democrats are a liberal political party in the United Kingdom. They presently have 11 Members of Parliament in the House of Commons, 96 members of the House of Lords, and one member of the European Parliament. They also have five Members of the Scottish Parliament and a member each in the Welsh Assembly and London Assembly. The party reached the height of its influence in the early 2010s, forming a junior partner in a coalition government from 2010 to 2015. It is presently led by Vince Cable.
Party | Seats | Gains | Losses | Net gain/loss | Seats % | Votes % | Votes | +/− | |
---|---|---|---|---|---|---|---|---|---|
Conservative | 29 | 2 | 2 | 0 | 74.4 | 45.3 | 15,071 | ||
Labour | 5 | 1 | 1 | 0 | 12.8 | 26.9 | 8,926 | ||
UKIP | 0 | 0 | 0 | 0 | 0 | 8.5 | 2,839 | ||
Liberal Democrat | 3 | 1 | 2 | -1 | 7.7 | 7.2 | 2,402 | ||
Independent | 2 | 1 | 0 | 1 | 5.1 | 6.2 | 2,062 | ||
Green | 0 | 0 | 0 | 0 | 0 | 5.8 | 1,938 |
Party | Candidate | Votes | % | ± | |
---|---|---|---|---|---|
Conservative | Sue Bull | 1,210 | 64.0 | 1.9 | |
Conservative | Tony Millward | 1,035 | |||
Labour | Che Page | 681 | 36.0 | -1.9 | |
Majority | |||||
Turnout | |||||
Conservative hold | Swing | ||||
Conservative hold | Swing |
Party | Candidate | Votes | % | ± | |
---|---|---|---|---|---|
Conservative | Phil Chell | 1,308 | 53.8 | -11.8 | |
Conservative | Tom Donnelly | 1,187 | |||
Labour | Simon Meredith | 596 | 24.5 | -11.4 | |
Green | Andy White | 527 | 21.7 | 21.7 | |
Majority | |||||
Turnout | |||||
Conservative hold | Swing | ||||
Conservative hold | Swing |
Party | Candidate | Votes | % | ± | |
---|---|---|---|---|---|
Conservative | Alyson Hill | 1,463 | 44.3 | ||
Conservative | Helen Froggatt | 1,372 | |||
Conservative | Philippa Tilbrook | 1,298 | |||
Green | Ian Wood | 743 | 22.5 | ||
Labour | Jacob Butler | 583 | 17.7 | ||
Labour | Paul Vaughan | 525 | |||
UKIP | Sarah Lamb | 511 | 15.5 | ||
UKIP | Andy Howard | 430 | |||
UKIP | Tilly Ward | 333 | |||
Majority | |||||
Turnout | |||||
Conservative hold | Swing | ||||
Conservative hold | Swing |
Party | Candidate | Votes | % | ± | |
---|---|---|---|---|---|
Conservative | Chris Furness | 756 | 67.0 | ||
Labour | Nicholas Whitehead | 373 | 33.0 | ||
Majority | |||||
Turnout | |||||
Conservative hold | Swing |
Party | Candidate | Votes | % | ± | |
---|---|---|---|---|---|
Conservative | Angus Jenkins | Unopposed | n/a | n/a | |
Majority | |||||
Turnout | |||||
Conservative hold | Swing |
Party | Candidate | Votes | % | ± | |
---|---|---|---|---|---|
Conservative | John Tibenham | 753 | 64.1 | ||
Labour | Barry Nottage | 421 | 35.9 | ||
Majority | |||||
Turnout | |||||
Conservative hold | Swing |
Party | Candidate | Votes | % | ± | |
---|---|---|---|---|---|
Conservative | Lewis Rose | Unopposed | n/a | n/a | |
Majority | |||||
Turnout | |||||
Conservative hold | Swing |
Party | Candidate | Votes | % | ± | |
---|---|---|---|---|---|
Conservative | Susan Hobson | Unopposed | n/a | n/a | |
Majority | |||||
Turnout | |||||
Conservative hold | Swing |
Party | Candidate | Votes | % | ± | |
---|---|---|---|---|---|
Conservative | Andrew Shirley | 727 | 60.4 | ||
Independent | Ian Bates | 298 | 24.8 | ||
UKIP | Richard Stone | 179 | 14.9 | ||
Majority | |||||
Turnout | |||||
Conservative hold | Swing |
Party | Candidate | Votes | % | ± | |
---|---|---|---|---|---|
Conservative | Jason Atkin | 1264 | 36.6 | ||
Conservative | Andrew Statham | 1099 | |||
Conservative | Mark Salt | 1089 | |||
Independent | John Evans | 830 | 24.0 | ||
Labour | Julie Morrison | 766 | 22.2 | ||
Labour | Pam Butler | 731 | |||
Independent | Maresa Mellor | 637 | |||
Independent | David Smith | 610 | |||
UKIP | Michael Hancocks | 595 | 17.2 | ||
UKIP | Marco Taaffe | 359 | |||
UKIP | Martin Sneap | 349 | |||
Majority | |||||
Turnout | |||||
Conservative gain from Liberal Democrat | Swing | ||||
Conservative hold | Swing | ||||
Conservative gain from Liberal Democrat | Swing | ||||
Party | Candidate | Votes | % | ± | |
---|---|---|---|---|---|
Conservative | Richard FitzHerbert | Unopposed | n/a | n/a | |
Majority | |||||
Turnout | |||||
Conservative hold | Swing |
Party | Candidate | Votes | % | ± | |
---|---|---|---|---|---|
Conservative | Albert Catt | 873 | 75.0 | ||
UKIP | Joe Hogan | 291 | 25.0 | ||
Majority | |||||
Turnout | |||||
Conservative hold | Swing |
Party | Candidate | Votes | % | ± | |
---|---|---|---|---|---|
Conservative | David Chapman | Unopposed | n/a | n/a | |
Majority | |||||
Turnout | |||||
Conservative hold | Swing |
Party | Candidate | Votes | % | ± | |
---|---|---|---|---|---|
Conservative | Jean Monks | 1,232 | 55.3 | ||
Conservative | Vicky Massey | 1,228 | |||
Labour | Elizabeth Coe | 998 | 44.7 | ||
Labour | Peter O'Brien | 971 | |||
Majority | |||||
Turnout | |||||
Conservative hold | Swing | ||||
Conservative hold | Swing |
Party | Candidate | Votes | % | ± | |
---|---|---|---|---|---|
Conservative | Richard Bright | Unopposed | n/a | n/a | |
Majority | |||||
Turnout | |||||
Conservative hold | Swing |
Party | Candidate | Votes | % | ± | |
---|---|---|---|---|---|
Independent | Graham Elliott | 582 | 62.3 | ||
Independent | David Frederickson | 352 | 37.7 | ||
Majority | |||||
Turnout | |||||
Independent gain from Independent | Swing | ||||
Party | Candidate | Votes | % | ± | |
---|---|---|---|---|---|
Conservative | Neil Horton | Unopposed | n/a | n/a | |
Majority | |||||
Turnout | |||||
Conservative hold | Swing |
Party | Candidate | Votes | % | ± | |
---|---|---|---|---|---|
Conservative | Garry Purdy | 946 | 56.1 | ||
Labour | Joyce Pawley | 741 | 43.9 | ||
Conservative | Richard Walsh | 686 | |||
Labour | Ian Page | 653 | |||
Majority | |||||
Turnout | |||||
Conservative hold | Swing | ||||
Labour hold | Swing |
Party | Candidate | Votes | % | ± | |
---|---|---|---|---|---|
Liberal Democrat | Susan Burfoot | 1,341 | 42.2 | ||
Liberal Democrat | Martin Burfoot | 1,164 | |||
Conservative | Ann Elliott | 1,065 | 33.6 | ||
Conservative | Geoff Stevens | 1,044 | |||
Conservative | Sam Gregory | 948 | |||
Liberal Democrat | David Jones | 849 | |||
Labour | Jane Littlechilds | 768 | 24.2 | ||
Labour | John Cowings | 763 | |||
Majority | |||||
Turnout | |||||
Liberal Democrat hold | Swing | ||||
Liberal Democrat gain from Conservative | Swing | ||||
Conservative hold | Swing |
Party | Candidate | Votes | % | ± | |
---|---|---|---|---|---|
Liberal Democrat | Steve Flitter | 1,061 | 31.3 | ||
Labour | Deborah Botham | 959 | 28.3 | ||
Conservative | Jacquie Stevens | 924 | 27.3 | ||
Conservative | Dan Hopkinson | 840 | |||
Liberal Democrat | Derek Woodward | 738 | |||
Labour | Isobel Fisher | 711 | |||
Conservative | Jeff Sterland | 711 | |||
Labour | James Ilott | 689 | |||
Liberal Democrat | Barry Hopkinson | 683 | |||
UKIP | Fred Richardson | 444 | 13.1 | ||
UKIP | Adrian Ward | 365 | |||
UKIP | Rachel Roberts | 311 | |||
Majority | |||||
Turnout | |||||
Liberal Democrat hold | Swing | ||||
Labour gain from Conservative | Swing | ||||
Conservative hold | Swing |
Party | Candidate | Votes | % | ± | |
---|---|---|---|---|---|
Conservative | Tony Morley | 799 | 76.8 | ||
UKIP | Michael Cruddas | 241 | 23.2 | ||
Majority | |||||
Turnout | |||||
Conservative hold | Swing |
Party | Candidate | Votes | % | ± | |
---|---|---|---|---|---|
Conservative | Jo Wild | Unopposed | n/a | n/a | |
Majority | |||||
Turnout | |||||
Conservative hold | Swing |
Party | Candidate | Votes | % | ± | |
---|---|---|---|---|---|
Conservative | Jennifer Bower | 655 | 62.1 | ||
Labour | Angus McLardy | 400 | 37.9 | ||
Majority | |||||
Turnout | |||||
Conservative hold | Swing |
Party | Candidate | Votes | % | ± | |
---|---|---|---|---|---|
Independent | Colin Swindell | Unopposed | n/a | n/a | |
Majority | |||||
Turnout | |||||
Independent gain from Labour | Swing | ||||
Party | Candidate | Votes | % | ± | |
---|---|---|---|---|---|
Labour | Irene Ratcliffe | 1,642 | 41.2 | ||
Labour | Mike Ratcliffe | 1,353 | |||
Labour | Pete Slack | 1,237 | |||
Conservative | Gladwyn Gratton | 1,096 | 27.5 | ||
Green | Josh Stockwell | 668 | 16.8 | ||
Green | Ivan Dixon | 599 | |||
UKIP | Michael Hawley | 578 | 14.5 | ||
Green | John Youatt | 280 | |||
Majority | |||||
Turnout | |||||
Labour hold | Swing | ||||
Labour hold | Swing |
Derbyshire Dales is a local government district in Derbyshire, England. The population of the district as taken at the 2011 Census was 71,116. Much of the district is situated in the Peak District, although most of its population lies along the River Derwent.
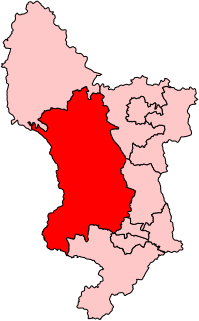
West Derbyshire was a county constituency represented in the House of Commons of the Parliament of the United Kingdom. From 1885 until it was replaced by the Derbyshire Dales constituency in the 2010 General Election, it elected one Member of Parliament (MP) by the first past the post voting system. It was a safe Conservative seat for most of its existence.
One third of Amber Valley Borough Council in Derbyshire, England is elected each year, followed by one year without election. Since the last boundary changes in 2000, 45 councillors have been elected from 23 wards.
Derbyshire Dales District Council in Derbyshire, England is elected every four years. Since the last boundary changes in 2003, 39 councillors have been elected from 25 wards.
Derbyshire County Council is the upper-tier local authority for the non-metropolitan county of Derbyshire, England. It has 64 councillors representing 61 divisions, with three divisions having two members each. They are Glossop and Charlesworth, Alfreton and Somercotes, and Eckington and Killamarsh. The authority is controlled by the Conservative Party, who won control in the May 2017 local council election.
Staffordshire Moorlands District Council is elected every four years.
South Derbyshire Council is elected every four years.
Derby City Council is the local government unitary authority for Derby, a city in the East Midlands region of England. It is composed of 51 councillors, three for each of the 17 electoral wards of Derby. Currently there is no overall control of the council, with the Labour Party being the biggest party. The acting council chief executive is Christine Durrant. Carole Mills will take over as Chief Executive from August 2018.
Erewash Borough Council in Derbyshire, England is elected every four years. Since the last boundary changes in 2003, 51 councillors are elected from 22 wards.
The 1999 Derbyshire Dales District Council election took place on 6 May 1999 to elect members of Derbyshire Dales District Council in Derbyshire, England. The whole council was up for election and the Conservative party gained overall control of the council from no overall control.
The 2003 Derbyshire Dales District Council election took place on 1 May 2003 to elect members of Derbyshire Dales District Council in Derbyshire, England. The whole council was up for election with boundary changes since the last election in 1999. The Conservative party stayed in overall control of the council.
The 2007 Derbyshire Dales District Council election took place on 3 May 2007 to elect members of Derbyshire Dales District Council in Derbyshire, England. The whole council was up for election and the Conservative party stayed in overall control of the council.
The 2011 Derbyshire Dales District Council election took place on 5 May 2011 to elect members of Derbyshire Dales District Council in Derbyshire, England. The whole council was up for election and the Conservative party stayed in overall control of the council.
The 2003 Bolsover District Council election took place on 1 May 2003 to elect members of Bolsover District Council in Derbyshire, England. The whole council was up for election after boundary changes and the Labour party stayed in overall control of the council.
The 2007 Bolsover District Council election took place on 3 May 2007 to elect members of Bolsover District Council in Derbyshire, England. The whole council was up for election and the Labour party stayed in overall control of the council.
The 2011 Bolsover District Council election took place on 5 May 2011 to elect members of Bolsover District Council in Derbyshire, England. The whole council was up for election and the Labour party stayed in overall control of the council.
The 2015 South Derbyshire District Council election took place on 7 May 2015 to elect members of South Derbyshire District Council in England. This was the same day as other local elections.
The 2015 Bolsover District Council election took place on 22 May 2015 to elect members of Bolsover District Council in Derbyshire, England. The whole council was up for election and the Labour party stayed in overall control of the council.
Elections to Erewash District Council were held on 10 May 1973 as part of nationwide local elections. The new district was formed by the merger of the Borough of Ilkeston, the Long Eaton urban district and the parishes of Breadsall, Breaston, Dale Abbey, Draycott and Church Wilne, Hopwell, Little Eaton, Morley, Ockbrook, Risley, Sandiacre, Stanley, Stanton by Dale and West Hallam from the South East Derbyshire Rural District. The new council became a shadow authority before taking over from the existing local authorities on 1 April 1974. The election saw the Labour Party gain control of the Council. Erewash District Council was granted Borough Status in 1975 and from thereon became known as Erewash Borough Council.
This Elections in England related article is a stub. You can help Wikipedia by expanding it. |