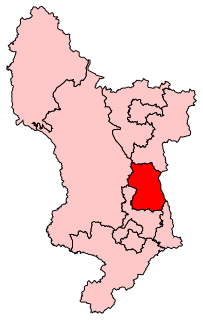
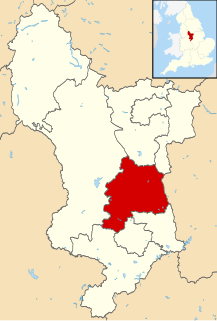
Elections to Amber Valley Borough Council were held on 3 May 2007. One third of the council was up for election and the Conservative party held overall control of the council. Overall turnout was 37.7%.
Amber Valley is a local government district and borough in Derbyshire, England. It takes its name from the River Amber and covers a semi-rural area with a number of small towns whose economy was formerly based on coal mining and engineering. The parliamentary constituency of Amber Valley covers a similar area. The Local Authority population at the 2011 Census was 122,309.
The Conservative Party, officially the Conservative and Unionist Party, is a centre-right political party in the United Kingdom. Presently led by Theresa May, it has been the governing party since 2010. It presently has 314 Members of Parliament in the House of Commons, 249 members of the House of Lords, and 18 members of the European Parliament. It also has 31 Members of the Scottish Parliament, 12 members of the Welsh Assembly, eight members of the London Assembly and 9,008 local councillors. One of the major parties of UK politics, it has formed the government on 45 occasions, more than any other party.
After the election, the composition of the council was
Party | Seats | Gains | Losses | Net gain/loss | Seats % | Votes % | Votes | +/− | |
---|---|---|---|---|---|---|---|---|---|
Conservative | 13 | 1 | 0 | +1 | 86.7 | 48.5 | 10,503 | +5.3% | |
Labour | 2 | 0 | 0 | -1 | 13.3 | 29.4 | 6,378 | -10.0% | |
Liberal Democrat | 0 | 0 | 0 | 0 | 0 | 13.1 | 2,848 | +13.1% | |
BNP | 0 | 0 | 0 | 0 | 0 | 4.8 | 1,048 | +0.1% | |
Independent | 0 | 0 | 0 | 0 | 0 | 2.9 | 634 | +2.9% | |
Green | 0 | 0 | 0 | 0 | 0 | 1.2 | 260 | +0.1% | |
1 Conservative candidate was unopposed.
Party | Candidate | Votes | % | ± | |
---|---|---|---|---|---|
Labour | Gail Dolman | 1,003 | 48.5 | -7.3 | |
Conservative | Paul West | 527 | 25.5 | -4.6 | |
BNP | Michael White | 344 | 16.6 | +16.6 | |
Liberal Democrat | Keith Falconbridge | 196 | 9.5 | +9.5 | |
Majority | 476 | 23.0 | -2.7 | ||
Turnout | 2,070 | 33.6 | +3.6 | ||
Labour hold | Swing | ||||
Party | Candidate | Votes | % | ± | |
---|---|---|---|---|---|
Conservative | Deborah Biss | 710 | 78.2 | +7.8 | |
Labour | Sue Reaney | 198 | 21.8 | +5.9 | |
Majority | 512 | 56.4 | +1.9 | ||
Turnout | 908 | 45.3 | |||
Conservative hold | Swing | ||||
Party | Candidate | Votes | % | ± | |
---|---|---|---|---|---|
Conservative | Peter Makin | 781 | 52.6 | -7.1 | |
Labour | Peter Shepard | 479 | 32.3 | -8.0 | |
Liberal Democrat | Janet Thompson | 225 | 15.2 | +15.2 | |
Majority | 302 | 20.3 | +0.9 | ||
Turnout | 1,485 | 36.1 | -9.9 | ||
Conservative hold | Swing | ||||
Party | Candidate | Votes | % | ± | |
---|---|---|---|---|---|
Conservative | Les Dorey | 688 | 52.6 | +1.7 | |
Labour | Randall Sanders | 381 | 29.1 | +0.3 | |
Liberal Democrat | Timothy Clark | 240 | 18.3 | +18.3 | |
Majority | 307 | 23.5 | +1.4 | ||
Turnout | 1,309 | 29.7 | -1.3 | ||
Conservative hold | Swing | ||||
Party | Candidate | Votes | % | ± | |
---|---|---|---|---|---|
Conservative | Barry Lewis | 641 | 40.8 | -7.1 | |
Liberal Democrat | Hassan Dervish | 569 | 36.2 | +36.2 | |
Labour | Joyce Sanders | 362 | 23.0 | -2.3 | |
Majority | 72 | 4.6 | -18.0 | ||
Turnout | 1,572 | 39.6 | -13.4 | ||
Conservative hold | Swing | ||||
Party | Candidate | Votes | % | ± | |
---|---|---|---|---|---|
Conservative | Peter Arnold | 658 | 49.5 | +6.2 | |
Labour | Ron Buzzard | 412 | 31.0 | -1.5 | |
Green | Dave Wells | 260 | 19.5 | +6.2 | |
Majority | 246 | 18.5 | +7.7 | ||
Turnout | 1,330 | 34.1 | +2.1 | ||
Conservative hold | Swing | ||||
Party | Candidate | Votes | % | ± | |
---|---|---|---|---|---|
Conservative | Gill Taylor | 508 | 61.1 | -1.7 | |
Liberal Democrat | Kate Smith | 202 | 24.3 | +24.3 | |
Labour | Janis Gregory | 121 | 14.6 | -4.1 | |
Majority | 306 | 36.8 | -7.3 | ||
Turnout | 831 | 42.9 | |||
Conservative hold | Swing | ||||
Party | Candidate | Votes | % | ± | |
---|---|---|---|---|---|
Conservative | Stuart Bradford | 1,005 | 63.7 | -1.2 | |
Labour | Di Hancock | 331 | 21.0 | +7.6 | |
Liberal Democrat | Colin Thompson | 242 | 15.3 | +15.3 | |
Majority | 674 | 42.7 | -6.5 | ||
Turnout | 1,578 | 42.8 | -0.2 | ||
Conservative hold | Swing | ||||
Party | Candidate | Votes | % | ± | |
---|---|---|---|---|---|
Conservative | Angela Ward | 878 | 56.3 | +7.6 | |
Labour | Christine Worth | 477 | 30.6 | +0.5 | |
Liberal Democrat | Margaret Tomkins | 205 | 13.1 | +13.1 | |
Majority | 401 | 25.7 | +7.1 | ||
Turnout | 1,560 | 39.6 | -9.4 | ||
Conservative gain from Labour | Swing | ||||
Party | Candidate | Votes | % | ± | |
---|---|---|---|---|---|
Conservative | Mel Hall | 1,098 | 47.3 | -16.0 | |
Labour | Terry Foster | 571 | 24.6 | -12.1 | |
BNP | Alan Warner | 372 | 16.0 | +16.0 | |
Liberal Democrat | John Banks | 281 | 12.1 | +12.1 | |
Majority | 527 | 22.7 | -3.9 | ||
Turnout | 2,322 | 38.0 | +2.0 | ||
Conservative hold | Swing | ||||
Party | Candidate | Votes | % | ± | |
---|---|---|---|---|---|
Conservative | David Wilson | 965 | 42.9 | -5.4 | |
Labour | Charles Cutting | 925 | 41.1 | +4.3 | |
Liberal Democrat | Michael Bedford | 359 | 16.0 | +16.0 | |
Majority | 40 | 1.8 | -9.7 | ||
Turnout | 2,249 | 34.3 | +2.3 | ||
Conservative hold | Swing | ||||
Party | Candidate | Votes | % | ± | |
---|---|---|---|---|---|
Labour | Geoff Carlile | 714 | 42.3 | -6.9 | |
Conservative | Robert Phillips-Forsyth | 597 | 35.3 | -15.5 | |
BNP | Paul Snell | 197 | 11.7 | +11.7 | |
Liberal Democrat | Phil Boothroyd | 181 | 10.7 | +10.7 | |
Majority | 117 | 7.0 | |||
Turnout | 1,689 | 36.7 | -7.3 | ||
Labour hold | Swing | ||||
Party | Candidate | Votes | % | ± | |
---|---|---|---|---|---|
Conservative | Simon Hitchcock | unopposed | |||
Conservative hold | Swing | ||||
Party | Candidate | Votes | % | ± | |
---|---|---|---|---|---|
Conservative | Stephen Hayes | 719 | 38.7 | -23.0 | |
Independent | George Soudah | 634 | 34.2 | +34.2 | |
Labour | Isobel Harry | 284 | 15.3 | -9.1 | |
BNP | Clifford Roper | 135 | 7.3 | +7.3 | |
Liberal Democrat | Gordon Monaghan | 84 | 4.5 | +4.5 | |
Majority | 85 | 4.5 | -32.8 | ||
Turnout | 1,856 | 43.3 | +6.3 | ||
Conservative hold | Swing | ||||
Party | Candidate | Votes | % | ± | |
---|---|---|---|---|---|
Conservative | Valerie Thorpe | 728 | 79.8 | +2.5 | |
Labour | David Williams | 120 | 13.2 | -9.5 | |
Liberal Democrat | Elsie Situnayake | 64 | 7.0 | +7.0 | |
Majority | 608 | 66.6 | +12.0 | ||
Turnout | 912 | 49.5 | |||
Conservative hold | Swing | ||||
Amber Valley is a constituency, represented in the House of Commons of the UK Parliament since 2010 by Nigel Mills of the Conservative Party.
The 1998 Amber Valley Borough Council election took place on 7 May 1998 to elect members of Amber Valley Borough Council in Derbyshire, England. One third of the council was up for election and the Labour party kept overall control of the council.
The 1999 Amber Valley Borough Council election took place on 6 May 1999 to elect members of Amber Valley Borough Council in Derbyshire, England. One third of the council was up for election and the Labour party stayed in overall control of the council.
The 2000 Amber Valley Borough Council election took place on 4 May 2000 to elect members of Amber Valley Borough Council in Derbyshire, England. The whole council was up for election with boundary changes since the last election in 1999 increasing the number of seats by 2. The Conservative party gained control of the council from the Labour party.
Elections to Amber Valley Borough Council were held on 2 May 2002. One third of the council was up for election and the Conservative party held overall control of the council.
Elections to Amber Valley Borough Council were held on 1 May 2003. One third of the council was up for election and the Conservative party held overall control of the council.
Elections to Amber Valley Borough Council were held on 10 June 2004. One third of the council was up for election and the Conservative party held overall control of the council. Overall turnout was 44%.
Elections to Amber Valley Borough Council were held on 4 May 2006. One third of the council was up for election and the Conservative party held overall control of the council. Overall turnout was 34%.
Elections to Mole Valley Council were held on 3 May 2007. One third of the council was up for election and the Conservative party kept overall control of the council. Overall turnout was 46.5%.
Elections to Mole Valley Council were held on 1 May 2008. One third of the council was up for election and the Conservative party stayed in overall control of the council. Overall turnout was 46.5% a drop from the 47.2% seen in the 2007 election.
Elections to Amber Valley Borough Council in Derbyshire, England were held on 1 May 2008. One third of the council was up for election and the Conservative party held overall control of the council.
Local elections were held in the United Kingdom in 1980. These were the first annual local elections for the new Conservative Prime Minister Margaret Thatcher. Though the Conservatives in government lost seats, the projected share of the vote was close: Labour Party 42%, Conservative Party 40%, Liberal Party 13%. Labour were still being led by the former prime minister James Callaghan, who resigned later in the year to be succeeded by Michael Foot.
The 2010 Amber Valley Borough Council election took place on 6 May 2010 to elect members of Amber Valley Borough Council in Derbyshire, England. One third of the council was up for election and the Conservative party stayed in overall control of the council.
The 2011 Amber Valley Borough Council election took place on 5 May 2011 to elect members of Amber Valley Borough Council in Derbyshire, England. One third of the council was up for election and the Conservative party stayed in overall control of the council.
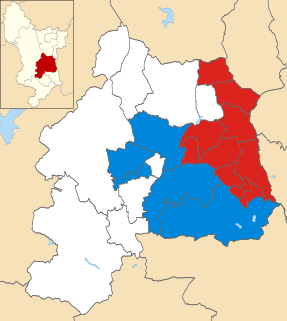
Elections to Amber Valley Borough Council in Derbyshire, England took place on Thursday 3 May 2012. One third of the council was up for election and the Conservative party held overall control of the council. Overall turnout in this election was 33.28 per cent.
The 2014 Amber Valley Borough Council election took place on 22 May 2014 to elect members of Amber Valley Borough Council in England. This was on the same day as other local elections.
The 2015 Amber Valley Borough Council election took place on 7 May 2015 to elect members of Amber Valley Borough Council in England. This was on the same day as other local elections. The Conservatives gained two seats and thereby retook control of the council.
Elections to Amber Valley Borough Council in Derbyshire, England took place on Thursday 5 May 2016. One third of the council seats were up for election and after the election the Conservative party continued to hold overall control of the council.
The 2018 Derby City Council election took place on 3 May 2018 to elect members of Derby City Council in England. This was on the same day as other local elections. The Labour group on the council suffered losses of both the Council Leader Ranjit Banwait and the mayor John Whitby, as well as then cabinet member Sara Bolton, who lost by over 1,000 votes to Conservative Rob Cooper. Labour lost its overall majority on the council, and a Conservative minority administration was formed with Liberal Democrat and UKIP backing.