![]() | This article has multiple issues. Please help improve it or discuss these issues on the talk page . (Learn how and when to remove these template messages)
(Learn how and when to remove this template message) Contents |
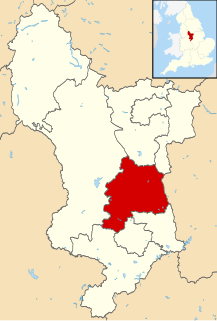
Elections to Amber Valley Borough Council in Derbyshire, England took place on Thursday 3 May 2012. One third of the council was up for election and the Conservative party held overall control of the council. Overall turnout in this election was 33.28 per cent.
Amber Valley is a local government district and borough in Derbyshire, England. It takes its name from the River Amber and covers a semi-rural area with a number of small towns whose economy was formerly based on coal mining and engineering. The parliamentary constituency of Amber Valley covers a similar area. The Local Authority population at the 2011 Census was 122,309.
Derbyshire is a county in the East Midlands of England. A substantial portion of the Peak District National Park lies within Derbyshire, containing the southern extremity of the Pennine range of hills which extend into the north of the county. The county contains part of the National Forest, and borders on Greater Manchester to the northwest, West Yorkshire to the north, South Yorkshire to the northeast, Nottinghamshire to the east, Leicestershire to the southeast, Staffordshire to the west and southwest and Cheshire also to the west. Kinder Scout, at 636 metres (2,087 ft), is the highest point in the county, whilst Trent Meadows, where the River Trent leaves Derbyshire, is its lowest point at 27 metres (89 ft). The River Derwent is the county's longest river at 66 miles (106 km), and runs roughly north to south through the county. In 2003 the Ordnance Survey placed Church Flatts Farm at Coton in the Elms as the furthest point from the sea in Great Britain.
The Conservative Party, officially the Conservative and Unionist Party, is a centre-right political party in the United Kingdom. Presently led by Theresa May, it has been the governing party since 2010. It presently has 314 Members of Parliament in the House of Commons, 249 members of the House of Lords, and 18 members of the European Parliament. It also has 31 Members of the Scottish Parliament, 12 members of the Welsh Assembly, eight members of the London Assembly and 9,008 local councillors. One of the major parties of UK politics, it has formed the government on 45 occasions, more than any other party.
After the election, the composition of the council was:
Party | Seats | Gains | Losses | Net gain/loss | Seats % | Votes % | Votes | +/− | |
---|---|---|---|---|---|---|---|---|---|
Labour | 10 | 6 | 0 | +6 | 62.5 | 50.02 | |||
Conservative | 6 | 0 | 4 | -4 | 37.5 | 36.36 | |||
Liberal Democrat | 0 | 0 | 0 | 0 | 0 | 4.80 | |||
BNP | 0 | 0 | 2 | -2 | 0 | 4.41 | |||
UKIP | 0 | 0 | 0 | 0 | 0 | 1.61 | |||
Green | 0 | 0 | 0 | 0 | 0 | 1.37 | |||
Independent | 0 | 0 | 0 | 0 | 0 | 0.88 | |||
National Front | 0 | 0 | 0 | 0 | 0 | 0.41 | |||
Party | Candidate | Votes | % | ± | |
---|---|---|---|---|---|
Labour | Marlene Bennett | 1202 | 69.2 | 20.8 | |
Conservative | Kat Moss | 447 | 25.73 | -14.41 | |
Liberal Democrat | Peter Jelf | 75 | 4.32 | -10.39 | |
Rejected ballots | |||||
Majority | 755 | 43.47 | |||
Turnout | 1737 of 6307 | 27.54% | |||
Labour hold | Swing | ||||
Party | Candidate | Votes | % | ± | |
---|---|---|---|---|---|
Conservative | John Nelson | 627 | 42.19 | -18.73 | |
Labour | Ben Bellamy | 450 | 30.28 | 10.57 | |
Green | Dave Wells | 328 | 22.07 | 2.16 | |
Liberal Democrat | Jane Benson | 71 | 4.78 | 0.05 | |
Rejected ballots | |||||
Majority | 177 | 11.91 | |||
Turnout | 1486 of 4357 | 34.11% | |||
Conservative hold | Swing | ||||
Party | Candidate | Votes | % | ± | |
---|---|---|---|---|---|
Conservative | Alan Cox | 647 | 44.1 | -6.96 | |
Labour | Erik Johnsen | 584 | 39.81 | 21.71 | |
Liberal Democrat | Jeremy Benson | 226 | 15.41 | -2.26 | |
Rejected ballots | |||||
Majority | 63 | 4.29 | |||
Turnout | 1467 of 4068 | 36.06% | |||
Conservative hold | Swing | ||||
Party | Candidate | Votes | % | ± | |
---|---|---|---|---|---|
Labour | Christopher Emmas-Williams | 825 | 57.94 | 17.73 | |
Conservative | Robert Phillips-Forsyth | 339 | 23.81 | -17.66 | |
UKIP | Ann Fox | 198 | 13.9 | 13.9 | |
BNP | Emma Roper | 59 | 4.14 | -16.57 | |
Rejected ballots | |||||
Majority | 486 | 34.13 | |||
Turnout | 1424 of 3945 | 36.1% | |||
Labour hold | Swing | ||||
Party | Candidate | Votes | % | ± | |
---|---|---|---|---|---|
Conservative | Angela Ward | 668 | 42.44 | -28.35 | |
Labour | David Farrelly | 634 | 40.28 | 8.35 | |
Independent | Jack Evans | 210 | 13.34 | 13.34 | |
Liberal Democrat | Rodney Tomkins | 57 | 3.62 | 3.62 | |
Rejected ballots | |||||
Majority | 34 | 2.16 | |||
Turnout | 1574 of 4100 | 38.39% | |||
Conservative hold | Swing | ||||
Party | Candidate | Votes | % | ± | |
---|---|---|---|---|---|
Labour | Alan Longdon | 783 | 56.82 | 21.45 | |
Conservative | Ella McManus | 350 | 25.4 | -3.92 | |
BNP | Ken Cooper | 245 | 17.78 | -17.51 | |
Rejected ballots | |||||
Majority | 433 | 31.42 | |||
Turnout | 1385 of 4137 | 33.48% | |||
Labour hold | Swing | ||||
Party | Candidate | Votes | % | ± | |
---|---|---|---|---|---|
Labour | Phil Hill | 744 | 52.37 | 21.18 | |
Conservative | Gary Wells | 391 | 26.15 | -6.72 | |
BNP | Cliff Roper | 384 | 19 | -17.46 | |
Liberal Democrat | Keith Falconbridge | 69 | 4.62 | 0.05 | |
Rejected ballots | |||||
Majority | 351 | 26.22 | |||
Turnout | 1495 of 4606 | 32.46% | |||
Labour gain from BNP | Swing | ||||
Party | Candidate | Votes | % | ± | |
---|---|---|---|---|---|
Labour | Bob Janes | 838 | 56.2 | 25.5 | |
Conservative | Richard Iliffe | 381 | 25.55 | 3.56 | |
BNP | Adrian Hickman | 272 | 18.24 | -21.16 | |
Rejected ballots | |||||
Majority | 457 | 30.65 | |||
Turnout | 1500 of 4774 | 31.42% | |||
Labour gain from BNP | Swing | ||||
Party | Candidate | Votes | % | ± | |
---|---|---|---|---|---|
Labour | Roy Walker | 705 | 47 | 5.59 | |
Conservative | Jack Brown | 688 | 45.87 | -22.59 | |
Liberal Democrat | Ollie Smith | 97 | 6.47 | 6.47 | |
Rejected ballots | |||||
Majority | 17 | 1.13 | |||
Turnout | 1500 of 4675 | 32.09% | |||
Labour gain from Conservative | Swing | ||||
Party | Candidate | Votes | % | ± | |
---|---|---|---|---|---|
Conservative | Charles Bull | 1071 | |||
Conservative | Kevin Buttery | 1066 | |||
Labour | John Banks | 871 | |||
Labour | Matthew Cruckshank | 811 | |||
Liberal Democrat | Margaret Tomkins | 215 | |||
Rejected ballots | |||||
Majority | 195 | ||||
Turnout | 2192 of 6226 | 35.21% | |||
Conservative hold | Swing | ||||
Party | Candidate | Votes | % | ± | |
---|---|---|---|---|---|
Labour | Brian Gration | 688 | 60.51 | 18.23 | |
Conservative | Terry Thorpe | 354 | 31.13 | -13.34 | |
National Front | Timothy Knowles | 99 | 8.7 | -12.8 | |
Rejected ballots | |||||
Majority | 334 | 29.38 | |||
Turnout | 1137 of 4104 | 27.70 | |||
Labour gain from Conservative | Swing | ||||
Party | Candidate | Votes | % | ± | |
---|---|---|---|---|---|
Labour | Tony Holmes | 1409 | 57.79 | 27.1 | |
Conservative | David Bowley | 905 | 37.12 | -22.81 | |
Liberal Democrat | Paul Gibbons | 106 | 4.35 | -5.5 | |
Rejected ballots | |||||
Majority | 504 | 20.67 | |||
Turnout | 2438 of 7060 | 34.73 | |||
Labour gain from Conservative | Swing | ||||
Party | Candidate | Votes | % | ± | |
---|---|---|---|---|---|
Labour | Mick Wilson | 891 | 51 | 22.28 | |
Conservative | Ron Ashton | 638 | 36.52 | -22.81 | |
BNP | Alan Edwards | 130 | 7.44 | -21.02 | |
Liberal Democrat | Michael Bedford | 76 | 4.35 | 4.35 | |
Rejected ballots | |||||
Majority | 253 | 14.48 | |||
Turnout | 1747 of 4670 | 37.41 | |||
Labour gain from Conservative | Swing | ||||
Party | Candidate | Votes | % | ± | |
---|---|---|---|---|---|
Conservative | Alex Stevenson | 971 | 57.87 | 7.13 | |
Labour | Stephen Holden | 587 | 34.98 | 0.11 | |
Liberal Democrat | Kate Smith | 104 | 6.2 | 6.2 | |
Rejected ballots | |||||
Majority | 404 | 22.88 | |||
Turnout | 1678 of 4621 | 36.71% | |||
Conservative hold | Swing | ||||
Party | Candidate | Votes | % | ± | |
---|---|---|---|---|---|
Labour | John McCabe | 857 | 64.19 | 17.36 | |
Conservative | Ian Smith | 226 | 16.93 | -11.59 | |
UKIP | Paul Bailey | 188 | 14.08 | 14.08 | |
Liberal Democrat | Joel Hunt | 57 | 4.2 | -12 | |
Rejected ballots | |||||
Majority | 631 | 47.26 | |||
Turnout | 1335 of 4754 | 28.08% | |||
Labour hold | Swing | ||||
The 2003 Tandridge District Council election took place on 1 May 2003 to elect members of Tandridge District Council in Surrey, England. One third of the council was up for election and the Conservative party stayed in overall control of the council.
The 2007 Tandridge District Council election took place on 3 May 2007 to elect members of Tandridge District Council in Surrey, England. One third of the council was up for election and the Conservative party stayed in overall control of the council.
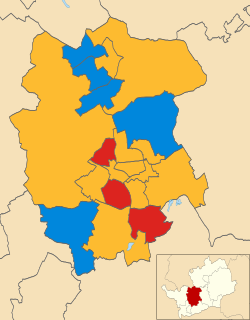
The 2003 St Albans City and District Council election took place on 1 May 2003 to elect members of St Albans District Council in Hertfordshire, England. One third of the council was up for election and the council stayed under no overall control.
The 2008 Wokingham Borough Council election took place on 1 May 2008 to elect members of Wokingham Unitary Council in Berkshire, England. One third of the council was up for election and the Conservative party stayed in overall control of the council.
The 2010 Wakefield Metropolitan District Council election took place on 6 May 2010 to elect members of Wakefield Metropolitan District Council in West Yorkshire, England. One third of the council was up for election and the Labour party stayed in overall control of the council with an increased majority.
The 2012 Adur District Council elections took place on 3 May 2012 to elect members of Adur District Council in West Sussex, England. Half of the council was up for election, and the Conservative Party remained in overall control of the council.
The 2011 Eastbourne Borough Council election took place on 5 May 2011 to elect members of Eastbourne Borough Council in East Sussex, England. The whole council was up for election and the Liberal Democrats stayed in overall control of the council.
Elections to Aberdeenshire Council were held on 3 May 2012, on the same day as the other Scottish local government elections. The election used the 19 wards created as a result of the Local Governance (Scotland) Act 2004, with each ward electing three or four Councillors using the single transferable vote system a form of proportional representation, with 68 Councillors being elected.
Elections to Three Rivers District Council were held on 3 May 2012 to elect one-third of the council of Three Rivers district in England.
The Kent County Council election, 2013 was an election to all 84 seats on Kent County Council held on Thursday 2 May as part of the United Kingdom local elections, 2013. 84 councillors were elected from 72 electoral divisions, which returned either one or two county councillors each by first-past-the-post voting for a four-year term of office. The electoral divisions were the same as those used at the previous election in 2009. No elections were held in Medway, which is a unitary authority outside the area covered by the County Council. The election saw the Conservative Party narrowly retain overall control of the council.
Elections for the London Borough of Merton were held on 22 May 2014 to elect members of Merton London Borough Council in England. This was on the same day as other local elections in England and an election to the European Parliament.
The 2012 Pendle Borough Council election took place on 3 May 2012 to elect members of Pendle Borough Council in Lancashire, England. One third of the council was up for election and the council stayed under no overall control.
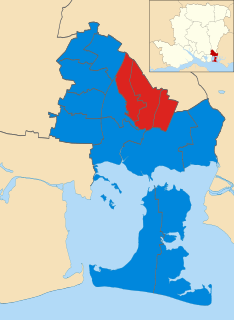
The 2012 Havant Borough Council election took place on 3 May 2012 to elect members of Havant Borough Council in Hampshire, England. One third of the council was up for election and the Conservative party stayed in overall control of the council.
The 2012 Harlow District Council election took place on 3 May 2012 to elect members of Harlow District Council in Essex, England. One third of the council was up for election and the Labour party gained overall control of the council from the Conservative party.
The 2012 Tandridge District Council election took place on 3 May 2012 to elect members of Tandridge District Council in Surrey, England. One third of the council was up for election and the Conservative party stayed in overall control of the council.
Elections for the London Borough of Merton were held on 3 May 1990 to elect members of Merton London Borough Council in London, England. This was on the same day as other local elections in England and Scotland.
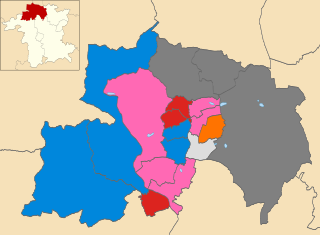
The 2012 Wyre Forest District Council election took place on 3 May 2012 to elect members of Wyre Forest District Council in Worcestershire, England. One third of the council was up for election and the Conservative party lost overall control of the council to no overall control.
Elections to elect all members (councillors) of Thanet District Council were held on 5 May 2011, as part of the United Kingdom local elections, 2011 taking place simultaneously with the Alternative Vote Referendum. No political party won an overall majority of seats, meaning that the council went into 'No Overall Control' status for the first time since 1991. The Conservative Party ran a minority administration until December that year, when a Conservative councillor defected to the Independents group, enabling The Labour Party to run a minority administration until 2015. The District has as its main towns the beach resort towns of Ramsgate, Margate and Broadstairs.
The 2015 Rother District Council election took place on 7 May 2015 to elect members of Rother District Council in East Sussex, England. The whole council was up for election and the Conservative party stayed in overall control of the council.
The 2018 Kensington and Chelsea London Borough Council election took place on 3 May 2018 to elect members of Kensington and Chelsea London Borough Council in England. The election was held on the same day as other local elections in England. While Kensington and Chelsea is usually regarded as a Conservative stronghold, there was media speculation that Labour could win control of the council in the wake of the Grenfell Tower fire. However the Conservatives maintained control, losing just one Councillor, in St. Helen's Ward, winning 36 seats to Labour's 13.