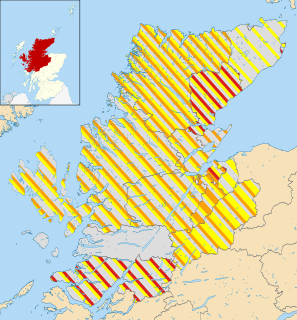
The 2012 Highland Council election took place on 3 May 2012 to elect members of Highland Council. The election used the twenty-two wards created as a result of the Local Governance (Scotland) Act 2004, with each ward electing three or four Councillors using the single transferable vote system and 80 Councillors being elected.

Elections to Comhairle nan Eilean Siar were held on 3 May 2012, the same day as the other Scottish local government elections. The election was the second one using the 9 wards created as a result of the Local Governance (Scotland) Act 2004. Each ward elected three or four Councillors using the single transferable vote system: a form of proportional representation. A total of 31 Councillors were elected.

Elections to Aberdeenshire Council were held on 3 May 2012, on the same day as the other Scottish local government elections. The election used the 19 wards created as a result of the Local Governance (Scotland) Act 2004, with each ward electing three or four Councillors using the single transferable vote system a form of proportional representation, with 68 Councillors being elected.
The 2012 Aberdeen City Council election took place on 3 May 2012 to elect members of Aberdeen City Council. The election used the 13 wards created as a result of the Local Governance (Scotland) Act 2004, with each ward electing three or four Councillors using the single transferable vote system a form of proportional representation, with 43 Councillors elected.

Elections to the City of Edinburgh Council were held on 3 May 2012, the same day as the Scottish local elections, 2012. The election was the second using 17 new wards created as a results of the Local Governance (Scotland) Act 2004, each ward elected three or four Councillors using the single transferable vote system a form of proportional representation system of election.

Elections to East Ayrshire Council are to be held on 3 May 2012, the same day as the other Scottish local government elections. The election is the second using 9 new wards created as a results of the Local Governance (Scotland) Act 2004, each ward elected three or four councillors using the single transferable vote system a form of proportional representation. The new wards replaced 32 single-member wards which used the plurality system of election.
Elections to Clackmannanshire Council were held on 3 May 2012, the same day as the 31 other local authorities in Scotland. The election used the five wards created under the Local Governance (Scotland) Act 2004, with 18 Councillors being elected. Each ward elected either 3 or 4 members, using the STV electoral system.
Elections to Inverclyde Council were held on 3 May 2012, the same day as the other 31 local authorities in Scotland. The election used the six wards created as a results of the Local Governance (Scotland) Act 2004, with each ward electing three or four Councillors using the single transferable vote system a form of proportional representation, with 20 Councillors being elected in total.
Elections to Falkirk Council were held on 3 May 2012, the same day as the 31 other local authorities in Scotland. The election used the nine wards created under the Local Governance (Scotland) Act 2004, with 32 councillors being elected. Each ward elected either 3 or 4 members, using the STV electoral system.

The 2012 Midlothian Council election took place on 3 May 2012 to elect members of Midlothian Council. The election used the six wards created as a result of the Local Governance (Scotland) Act 2004, with each ward electing three or four Councillors using the single transferable vote system a form of proportional representation, with 18 Councillors being elected.

Elections to East Lothian Council were held on 3 May 2012, on the same day as the other Scottish local government elections. The election used the 7 wards created as a result of the Local Governance (Scotland) Act 2004, with each ward electing three or four councillors using the single transferable vote system a form of proportional representation, with 23 councillors elected.

The 2012 South Ayrshire Council election took place on 3 May 2012 to elect members of South Ayrshire Council. The election used the eight wards created as a result of the Local Governance (Scotland) Act 2004, with each ward electing three or four Councillors using the single transferable vote system a form of proportional representation, with 30 Councillors being elected.

Elections to South Lanarkshire Council were held on 3 May 2012 on the same day as the 31 other local authorities in Scotland. The election used the twenty wards created under the Local Governance (Scotland) Act 2004, with 67 Councillors being elected. Each ward elected either 3 or 4 members, using the STV electoral system.
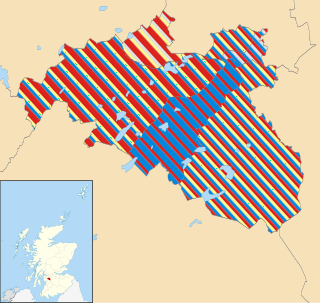
Elections to North Lanarkshire Council were held on 3 May 2012 on the same day as the 31 other local authorities in Scotland. The election used the twenty wards created under the Local Governance (Scotland) Act 2004, with 70 Councillors being elected. Each ward elected either 3 or 4 members, using the STV electoral system.
The 2012 East Renfrewshire Council election took place on 3 May 2012 to elect members of East Renfrewshire Council. The election used the six wards created as a result of the Local Governance (Scotland) Act 2004, with each ward electing three or four Councillors using the single transferable vote system a form of proportional representation, with 20 Councillors being elected.
Elections to East Dunbartonshire Council were held on 3 May 2012, the same day as the 31 other local authorities in Scotland. The election used the eight wards created under the Local Governance (Scotland) Act 2004, with 24 Councillors being elected. Each ward elected either 3 or 4 members, using the STV electoral system.
Elections to East Lothian Council will be held on 4 May 2017 on the same day as the other Scottish local government elections. The election will consist of 6 wards electing three or four Councillors using the single transferable vote system a form of proportional representation, with 22 Councillors elected.

The Clackmannanshire Council election of 2017 was held on 4 May 2017, on the same day as the 31 other local authorities in Scotland. It was the third successive election to run under the STV electoral system and used the five wards created under the Local Governance (Scotland) Act 2004, with 18 councillors being elected.
The 2017 West Lothian Council election took place on 4 May 2017 to elect members of West Lothian Council. The election used the 9 wards created as a result of the Local Governance (Scotland) Act 2004, with each ward electing three or four Councillors using the single transferable vote system a form of proportional representation, with 33 Councillors being elected.
Elections to Falkirk Council will be held on 4 May 2017, the same day as the 31 other local authorities in Scotland. The election will use the nine wards created under the Local Governance (Scotland) Act 2004, with 30 councillors being elected, a reduction of 2 members from 2012. Each ward will elect either 3 or 4 members, using the STV electoral system.


