City of Edinburgh Council election, 2012

Last updated

City of Edinburgh Council election, 2012

Flag of Edinburgh.svg


  2007 3 May 2012 (2012-05-03) 2017  

All 58 seats to City of Edinburgh Council
30 seats needed for a majority

  First party Second party Third party
 
Leader Andrew Burns Steve Cardownie Jeremy Balfour
Party Labour SNP Conservative
Leader's seat Fountainbridge
/Craiglockhart
Forth Corstorphine
/Murrayfield
Last election 15 seats, 22.93%12 seats, 20.32% 11 seats, 22.08%
Seats before 15 13 11
Seats won 20 18 11
Seat changeIncrease2.svg5Increase2.svg6Steady2.svg
Popular vote 39,286 37,537 27,588
Percentage 28.13% 26.87% 19.75%
SwingIncrease2.svg5.45%Increase2.svg6.55%Decrease2.svg2.33%

  Fourth party Fifth party
 
Leader Maggie Chapman
 and Steve Burgess
Paul Edie
Party Scottish Green Liberal Democrats
Leader's seat Leith Walk,
Southside
/Newington
Corstorphine
/Murrayfield
Last election 3 seats, 8.23%17 seats, 21.99%
Seats before 3 17
Seats won 6 3
Seat changeIncrease2.svg3Decrease2.svg14
Popular vote 15,978 13,040
Percentage 11.44% 9.34%
SwingIncrease2.svg3.21%Decrease2.svg12.65%

City of Edinburgh Council election 2012 - Alternate.svg

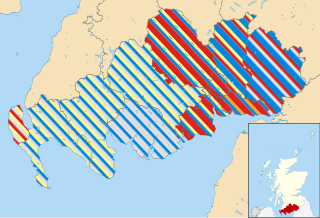
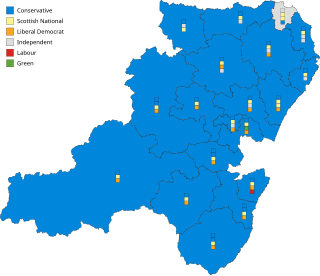
Map of council wards

Leader of the Council before election

Jenny Dawe defeated
Liberal Democrats

Leader of the Council after election

Andrew Burns
Labour

Elections to the City of Edinburgh Council were held on 3 May 2012, the same day as the Scottish local elections, 2012. The election was the second using 17 new wards created as a results of the Local Governance (Scotland) Act 2004, each ward elected three or four Councillors using the single transferable vote system a form of proportional representation system of election.

Local Governance (Scotland) Act 2004 act of the Scottish Parliament making local elections be run under the single transferable vote

The Local Governance (Scotland) Act 2004 is an Act of the Scottish Parliament which provided, amongst other things, for the election of councillors to the local authorities in Scotland by the single transferable vote system.

The single transferable vote (STV) is a voting system designed to achieve proportional representation through ranked voting in multi-seat organizations or constituencies. Under STV, an elector (voter) has a single vote that is initially allocated to their most preferred candidate. Votes are totalled and a quota derived. If their candidate achieves quota, he/she is elected and in some STV systems any surplus vote is transferred to other candidates in proportion to the voters' stated preferences. If more candidates than seats remain, the bottom candidate is eliminated with his/her votes being transferred to other candidates as determined by the voters' stated preferences. These elections and eliminations, and vote transfers if applicable, continue until there are only as many candidates as there are unfilled seats. The specific method of transferring votes varies in different systems.

Contents

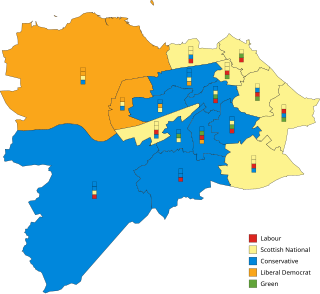
The main feature of the Elections was the near obliteration of the Scottish Liberal Democrats as they collapsed from 17 to just 3 seats on the City Council which sees the party occupying the position as the smallest party. Their leader, and the leader of the Council, Jenny Dawe, lost her seat in Meadows/Morningside, epitomising the poor performance. The Scottish Labour Party replaced the Lib Dems as the largest party as they made 5 gains, winning 20 seats in total. The Scottish National Party became the second largest party gaining 6 seats and 18 seats in total. The Scottish Conservative and Unionist Party retained 11 seats on the Council while the Scottish Green Party doubled their seat numbers to 6.

The Scottish Liberal Democrats is a liberal and social-liberal political party in Scotland.

The Scottish Labour Party is the devolved Scottish section of the UK Labour Party.

The Scottish National Party is a Scottish nationalist and social-democratic political party in Scotland. The SNP supports and campaigns for Scottish independence. It is the second-largest political party by membership in the United Kingdom, behind the Labour Party and ahead of the Conservative Party, it is the third-largest by overall representation in the House of Commons, behind the Conservative Party and the Labour Party, and it is the largest political party in Scotland, where it has the most seats in the Scottish Parliament and 35 out of the 59 Scottish seats in the House of Commons of the Parliament of the United Kingdom. The current Scottish National Party leader, Nicola Sturgeon, has served as First Minister of Scotland since November 2014.

After the election a Coalition was formed between the Labour Party and the SNP. This replaced the previous Lib Dem – SNP Coalition which had existed from 2007-2012.

Election result

City of Edinburgh Local Election Result 2012
Electorate: 331,954
Turnout: 141,552 (42.6%)
Total Valid: 139,684 [1]
PartySeatsGainsLossesNet gain/lossSeats %Votes %Votes+/−
  Labour 20 6 1Increase2.svg5 34.48 28.13 39,286Increase2.svg5.45
  SNP 18 6 0Increase2.svg6 31.03 26.87 37,537Increase2.svg6.55
  Conservative 11 1 1Steady2.svg 18.97 19.75 27,588Decrease2.svg2.33
  Scottish Green 6 3 0Increase2.svg3 10.34 11.44 15,978Increase2.svg3.21
  Liberal Democrats 3 0 14Decrease2.svg14 5.17 9.34 13,040Decrease2.svg12.65
  Independent 0 0 0Steady2.svg 0.00 1.84 2,565New
  UKIP 0 0 0Steady2.svg 0.00 0.34 480New
  TUSC 0 0 0Steady2.svg 0.00 0.33 463New
  Liberal 0 0 0Steady2.svg 0.00 0.26 368New
  Scottish Socialist 0 0 0Steady2.svg 0.00 0.16 228New
  Pirate 0 0 0Steady2.svg 0.00 0.14 195New

Note: "Votes" are the first preference votes. The net gain/loss and percentage changes relate to the result of the previous Scottish local elections on 3 May 2007. This may differ from other published sources showing gain/loss relative to seats held at dissolution of Scotland's councils.

Ward summary

Map of Council Wards showing parties elected in each ward City of Edinburgh Council election 2012.svg
Map of Council Wards showing parties elected in each ward
e    d  Results of the City of Edinburgh Council election, 2012
by ward
Ward %
Cllrs
%
Cllrs
%
Cllrs
%
Cllrs
%
Cllrs
%
Cllrs
Total
Cllrs
Lab SNP Conservative Green Lib Dem Others
Almond14.92032.55126.2416.17015.8914.2203
Pentland Hills28.85129.16127.7014.0504.6605.5903
Drum Brae/Gyle26.46127.00116.0403.62018.7718.1203
Forth34.01229.06122.6417.0805.0602.1404
Inverleith24.99120.22129.50114.92110.380 - -4
Corstorphine/Murrayfield20.45024.74124.9616.11022.7711.9603
Sighthill/Gorgie42.1237.429.208.203.20 - -4
Colinton/Fairmilehead 17.87020.59152.0024.9103.6201.0103
Fountainbridge/Craiglockhart 23.24123.54121.15024.0717.3400.6603
Meadows/Morningside19.64115.78129.90119.75112.3002.6304
City Centre21.33124.97127.69117.0607.9401.0103
Leith Walk 33.24228.4818.11020.2815.0904.8104
Leith32.1132.416.5018.919.001.103
Craigentinny/Duddingston36.2236.9110.207.008.001.803
Southside/Newington19.78118.34116.72119.97113.97011.2204
Liberton/Gilmerton40.9231.6112.315.207.602.504
Portobello/Craigmillar47.4232.017.208.501.902.903
Total28.132026.871819.751111.5569.343058

Ward results

Almond

2007: 1xCon; 1xLib Dem; 1xSNP
2012: 1xSNP; 1xCon; 1xLib Dem
2007-2012 Change: No Change

2012 Council election: Almond - 3 seats
Party Candidate % 1st Pref Count 1 Count 2Count 3Count 4Count 5Count 6Count 7
SNP Norman Work (incumbent) 32.55%2,722      
Conservative Lindsay Paterson 26.24%2,194      
Liberal Democrats Alastair Shields†††††† 15.89% 1,3291,460 1,5001,5151,5791,8042,426
Labour Billy Fitzpatrick 14.92% 1,2481,350 1,3561,3731,4211,623 
Scottish Green Moira Dunworth 6.17% 516651 657683768  
Independent John Longstaff 2.49% 208268 276338   
UKIP Otto Inglis 1.73% 145168 181    
Electorate: 18,996  Valid: 8,362  Spoilt: 51  Quota: 2,091  Turnout: 8,413 (44.3%)

    Pentland Hills

    2007: 1xCon; 1xSNP; 1xLab
    2012: 1xSNP; 1xLab; 1xCon
    2007-2012 Change: No Change

    Pentland Hills - 3 seats
    Party Candidate % 1st Pref Count 1 Count 2Count 3Count 4Count 5Count 6Count 7
    SNP Bill Henderson 29.16%2,317      
    Labour Ricky Henderson (incumbent) 28.85%2,293      
    Conservative Dominic Heslop 15.09% 1,1991,224 1,2491,3351,3971,5022,446
    Conservative Shelia Low 12.61% 1,0021,017 1,0401,0991,1541,240 
    Scottish Green Phyl Meyer 4.05% 322400 468607840  
    Independent Mike 'Professor Pongoo' Ferrigan 5.59% 444491 531590   
    Liberal Democrats Stuart Bridges 4.66% 370414 462    
    Electorate: 18,002  Valid: 7,947  Spoilt: 51  Quota: 1,987  Turnout: 7,998 (44.4%)

      Drum Brae/Gyle

      2007: 2xLib Dem; 1xSNP
      2012: 1xLab; 1xSNP; 1xLib Dem
      2007-2012 Change: Lab gain one seat from Lib Dem

      Drum Brae/Gyle Ward - 3 seats
      Party Candidate % 1st Pref Count 1 Count 2Count 3Count 4Count 5Count 6Count 7Count 8
      Labour Karen Keil 26.46%1,981       
      Liberal Democrats Robert Aldridge (incumbent) 18.77% 1,4051,425 1,4311,4901,6361,6951,7352,312
      SNP Ron Cairns * 18.34% 1,3731,383 1,3861,4061,4662,052  
      Conservative Mark Brown 16.04% 1,2011,207 1,2121,2331,3491,3701,383 
      SNP Alison Lindsay 8.66% 648657 661699750   
      Independent Steven Binney 6.92% 518532 588663    
      Scottish Green Linda Hendry 3.62% 271285 296     
      Independent John Scott 1.20% 9095       
      Electorate: 17,123  Valid: 7,487  Spoilt: 78  Quota: 1,872  Turnout: 7,565 (44.2%)
        • =Outgoing Councillor from a different Ward.

        Forth

        Forth - 4 seats
        Party Candidate % 1st Pref Count 1 Count 2Count 3Count 4Count 5Count 6Count 7Count 8
        Labour Cammy Day (incumbent) 27.54%2,230       
        Conservative Allan Jackson (incumbent) 22.64%1,833       
        SNP Steve Cardownie (incumbent) 17.01% 1,3771,407 1,4221,4321,4431,4821,5542,377
        SNP George Gordon 12.05% 9761,008 1,0171,0191,0341,0701,187 
        Scottish Green Kate Joester 7.08% 573598 626637683850  
        Labour Vicki Redpath 6.47% 524962 9769871,0091,0991,3471,446
        Liberal Democrats Tim Wight 5.06% 410423 473495500   
        TUSC Ruth Ann Henderson 1.44% 117127 130132    
        Liberal Seumas Stiubhard MacMhicean 0.70% 5764 73     
        Electorate: 21,796  Valid: 8,097  Spoilt: 136 (1.65%)  Quota: 1,620  Turnout: 8,233 (37.8%)

          Inverleith

          Inverleith - 4 seats
          Party Candidate % 1st Pref Count 1 Count 2Count 3Count 4
          Labour Lesley Hinds (incumbent) 24.99%2,751   
          Conservative Iain Whyte (incumbent) 17.77% 1,9561,989 2,0192,279
          Scottish Green Nigel Bagshaw 14.92% 1,6421,815 1,8652,325
          SNP Gavin Barrie 13.03% 1,4341,489 2,1482,264
          Conservative Scott Douglas 11.73% 1,2911,312 1,3261,487
          Liberal Democrats Tim McKay (incumbent) 10.38% 1,1431,226 1,252 
          SNP John Young 7.19% 792820   
          Electorate: 23,235  Valid: 11,009  Spoilt: 118 (1.06%)  Quota: 2,202  Turnout: 11,127 (47.9%)

            Corstorphine/Murrayfield

            Corstorphine/Murrayfield - 3 seats
            Party Candidate % 1st Pref Count 1 Count 2Count 3Count 4Count 5Count 6
            Conservative Jeremy Balfour (incumbent) 24.96% 2,0502,100    
            SNP Frank Ross 24.74% 2,0322,053 2,056   
            Liberal Democrats Paul Edie (incumbent) 21.77% 1,7881,798 1,8171,8181,9932,798
            Labour Tom McInally 20.45% 1,6791,698 1,7021,7021,884 
            Scottish Green Dominic Hinde 6.11% 502526 530530  
            UKIP James Nisbet 1.96% 161     
            Electorate: 17,445  Valid: 8,212  Spoilt: 56 (0.68%)  Quota: 2,054  Turnout: 8,268 (47.4%)

              Sighthill/Gorgie

              2007: 2xLab; 1xSNP; 1xLib Dem
              2012: 2xLab; 2xSNP;
              2007-2012 Change: SNP gain one seat from Lib Dem

              Sighthill/Gorgie - 4 seats
              Party Candidate % 1st Pref Count 1 Count 2Count 3Count 4Count 5Count 6
              Labour Eric Milligan (incumbent) 28.32,266     
              SNP Catherine Fullerton 20.31,624     
              SNP Denis Dixon 17.1 1,3681,389 1,3961,4141,4621,688
              Labour Donald Wilson (incumbent) 13.8 1,1071,677    
              Conservative Susan Dewhurst 9.2 736745 749750808917
              Scottish Green Lindsay Ashford 8.2 658674 690691776 
              Liberal Democrats Neil MacLean 3.2 253260 267267  
              Electorate: 23,877  Valid: 8,012  Spoilt: 240 (2.91%)  Quota: 1,603  Turnout: 8,252 (34.6%)

                Colinton/Fairmilehead

                Colinton/Fairmilehead - 3 seats
                Party Candidate % 1st Pref Count 1 Count 2Count 3Count 4Count 5Count 6Count 7
                Conservative Jason Rust (incumbent) 28.71%2,692      
                Conservative Elaine Aitken (incumbent) 23.29% 2,1842,427     
                SNP Richard Lewis 20.59% 1,9311,953 1,9621,9752,0212,1872,816
                Labour Eric Barry (incumbent) 17.87% 1,6761,699 1,7081,7241,8312,070 
                Scottish Green Andy Saunders 4.91% 460474 484501647  
                Liberal Democrats Alan Beal 3.62% 339350 365368   
                UKIP Malcolm MacKay 1.01% 95100 105    
                Electorate: 18,521  Valid: 9,377  Spoilt: 74 (0.78%)  Quota: 2,345  Turnout: 9,451 (51%)

                  Fountainbridge/Craiglockhart

                  2007 Council election: Fountainbridge/Craiglockhart - 3 seats
                  Party Candidate % 1st Pref Count 1 Count 2Count 3Count 4Count 5
                  Scottish Green Gavin Corbett 24.07% 1,7891,801 2,004  
                  SNP David Key 23.54% 1,7501,755 1,8111,8481,861
                  Labour Andrew Burns (incumbent) 23.24% 1,7281,734 1,8511,905 
                  Conservative Will Searle 21.15% 1,5721,578 1,7141,7311,738
                  Liberal Democrats Jim Lowrie (incumbent) 7.34% 546561    
                  Liberal Tim Strode 0.66% 49    
                  Electorate: 17,069  Valid: 7,434  Spoilt: 70 (0.93%)  Quota: 1,859  Turnout: 7,504 (44%)

                    Meadows/Morningside

                    Meadows/Morningside - 4 seats
                    Party Candidate % 1st Pref Count 1 Count 2Count 3Count 4Count 5Count 6Count 7
                    Conservative Mark McInnes (incumbent) 29.903,125      
                    Scottish Green Melanie Main 19.75 2,0642,209     
                    Labour Paul Godzik (incumbent) 19.64 2,0532,171 2171     
                    SNP Sandy Howat 15.79 1,6501,723 1,7541,7671,7841,8572,390
                    Liberal Democrats Jenny Dawe * 12.30 1,2851,574 1,6151,6391,6611,730 
                    Pirate Phil Hunt 1.87 195211 224230264  
                    UKIP William Macadam 0.76 79170 173175    
                    Electorate: 22,328  Valid: 10,451  Spoilt: 39  Quota: 2,091  Turnout: 10,490 (47%)
                      • = Outgoing Councillor from a different Ward.

                      City Centre

                      City Centre - 3 seats
                      Party Candidate % 1st Pref Count 1 Count 2Count 3Count 4Count 5Count 6
                      Conservative Joanna Mowat (incumbent) 27.69%1,402     
                      SNP Alasdair Rankin (incumbent) 24.97% 1,2641,272    
                      Labour Karen Doran 21.33% 1,0801,093 1,0941,1011,2351,777
                      Scottish Green Julita Mazurek 17.06% 864887 8909071,111 
                      Liberal Democrats Iain Coleman 7.94% 402439 440463  
                      Liberal Karen Hetherington 1.01% 5158 59   
                      Electorate: 13,943  Valid: 5,063  Spoilt: 38 (0.74%)  Quota: 1,266  Turnout: 5,101 (36.6%)

                        Leith Walk

                        Leith Walk - 4 seats
                        Party Candidate % 1st Pref Count 1 Count 2Count 3Count 4Count 5Count 6Count 7Count 8Count 9Count 10Count 11
                        SNP Deidre Brock (incumbent)††† 22.11735          
                        Labour Angela Blacklock (incumbent) 21.31674          
                        Scottish Green Maggie Chapman †††† (incumbent) 20.31593          
                        Labour Nick Gardner 11.9 937947 102910351050106510891115122513501519
                        Conservative Miles Briggs 8.1 637640 644645651653656675784816 
                        SNP Seumas Ross Skinner 6.4 502630 632635639649674708741  
                        Liberal Democrats Jamie Paterson 5.1 400403 406410424429434445   
                        TUSC John McArdle 1.4 109110 111113119128     
                        Independent Alex Wilson 1.4 109110 110111112153181    
                        Independent Jimmy McIntosh 1.2 9192 939397      
                        Liberal John Hein 0.9 6971 7272       
                        Electorate: 22,147  Valid: 7,856  Spoilt: 156  Quota: 1572  Turnout: 35.47%

                          Leith

                          2007 Council election: Leith - 3 seats
                          Party Candidate % 1st Pref Count 1 Count 2Count 3Count 4Count 5Count 6Count 7
                          Labour Gordon Munro (incumbent) 32.1%2010      
                          Scottish Green Chas Booth 18.9% 11811306 133114271780  
                          SNP Adam McVey 17.6% 11041140 11451163122812802240
                          SNP Rob Munn (incumbent) 14.8% 926984 993101311351169 
                          Liberal Democrats Marjorie Thomas (incumbent) 9.0% 565618 641825   
                          Conservative Nicola Ross 6.5% 405428 433    
                          Liberal Irvine McMinn 1.1% 7185      
                          Electorate: 16,972  Valid: 6262  Spoilt: 122  Quota: 1566  Turnout: 32.6%

                            Craigentinny/Duddingston

                            Craigentinny/Duddingston - 3 seats
                            Party Candidate % 1st Pref Count 1 Count 2Count 3Count 4Count 5Count 6Count 7Count 8
                            SNP Stefan Tymkewycz (incumbent) 25.8%2180       
                            Labour Joan Griffiths 25.7%2174       
                            SNP Colin Williamson 11.1% 937989 9911008113812601354 
                            Labour Alex Lunn†† 10.5% 886887 9359541080126114301740
                            Conservative Jason Lingiah 10.2% 866867 8688779111080  
                            Liberal Democrats Gary Peacock (incumbent) 8.0% 673675 677688836   
                            Scottish Green John Palmer 7.0% 590592 594661    
                            TUSC Kevin Furguson 1.8% 150150 151     
                            Electorate: 18,871  Valid: 8,456  Spoilt: 212  Quota: 2115  Turnout: 45.9%

                              Southside/Newington

                              Southside/Newington - 4 seats
                              Party Candidate % 1st Pref Count 1 Count 2Count 3Count 4Count 5Count 6Count 7Count 8
                              Scottish Green Steve Burgess (incumbent) 19.97% 1,8691,883      
                              Labour Ian Perry (incumbent) 19.78% 1,8511,856 1,8581,886    
                              SNP Jim Orr††† 18.34% 1,7171,723 1,7251,7421,7441,886  
                              Conservative Cameron Rose (incumbent) 16.72% 1,5651,568 1,5681,5701,5711,8551,8572,501
                              Liberal Democrats Gordon MacKenzie (incumbent) 13.97% 1,3081,341 1,3431,3481,3511,5481,551 
                              Independent Gordon Murdie 9.53% 892895 896921923   
                              TUSC William Black 0.93% 8790 91     
                              Liberal Margaret Lea 0.76% 71       
                              Electorate: 20,821  Valid: 9,360  Spoilt: 67 (0.71%)  Quota: 1,873  Turnout: 9,427 (45.3%)

                                Liberton/Gilmerton

                                Liberton/Gilmerton - 4 seats
                                Party Candidate % 1st Pref Count 1 Count 2Count 3Count 4Count 5Count 6Count 7Count 8
                                Labour Norma Austin-Hart (incumbent) 21.41,941       
                                SNP Tom Buchanan (incumbent)† 19.6 1,7801,789 1,7941,826    
                                Labour Bill Cook (incumbent) 19.5 1,7681,868      
                                Conservative Nick Cook 12.3 1,1111,112 1,1151,1241,1251,1711,4551,696
                                SNP Derek Howie 12.0 1,0841,086 1,0901,1271,1381,2681,441 
                                Liberal Democrats John Knox 7.6 687689 694711711848  
                                Scottish Green Joan Carter 5.2 469473 480549550   
                                Scottish Socialist Colin Fox 2.5 228229 233     
                                Electorate: 23,187  Valid: 9,068  Spoilt: 191 (2.06%)  Quota: 1,814  Turnout: 9,259 (39.9%)

                                  Portobello/Craigmillar

                                  Portobello/Craigmillar - 3 seats
                                  Party Candidate % 1st Pref Count 1 Count 2Count 3Count 4Count 5Count 6Count 7Count 8
                                  Labour Maureen Child (incumbent) 36.62,645       
                                  SNP Michael A. Bridgeman (incumbent) 20.4 1,4771,559 1,5651,6071,6492,381  
                                  SNP David Manson 11.6 837879 891921953   
                                  Labour David Walker 10.8 7841,212 1,2371,2701,3191,3561,4311,744
                                  Scottish Green Peter McColl 8.5 615723 7688259741,0591,203 
                                  Conservative Henry Christian 7.2 523549 574601    
                                  Independent Norrie Davies 2.9 213253 261     
                                  Liberal Democrats Martin Veart 1.9 137155       
                                  Electorate: 17,603  Valid: 7,231  Spoilt: 169 (2.28%)  Quota: 1,808  Turnout: 7,400 (42%)

                                    Post Election Changes

                                    By Elections since 2012

                                    Liberton/Gilmerton By-election (20 June 2013)- 1 Seat
                                    Party Candidate % 1st Pref Count 1 Count 2Count 3Count 4Count 5Count 6Count 7
                                    Labour Keith John Robson 39.47 2,8922,896 2,9062,9413,0703,2553,448
                                    SNP Derek Howie 30.69 2,2492,251 2,2562,2872,4032,5232,633
                                    Conservative Stephanie Murray 11.23 823824 8369039341,098 
                                    Liberal Democrats John Christopher Knox 8.26 605611 616625708  
                                    Scottish Green Alys Mumford 5.62 412430 440471   
                                    UKIP Jonathan Stanley 3.21 235239 251    
                                    Independent John Scott 0.87 6470      
                                    Pirate Phil Hunt 0.64 47      
                                    Electorate: 24,177  Valid: 7,246  Spoilt: 81  Quota: 3,664  Turnout: 7,327 (30.6%)
                                      Leith Walk By-election (10 September 2015)- 2 Seats
                                      Party Candidate % 1st Pref Count 1 Count 2Count 3Count 4Count 5Count 6Count 7Count 8Count 9Count 10
                                      SNP John Ritchie 36.2%2,290         
                                      Labour Marion Donaldson 25.7% 1,6231,650.1 1,653.11,659.61,661.71,680.41,697.61,798.21,990.22,717.3
                                      Scottish Green Susan Rae 21.8% 1,3811,464.6 1,469.81,483.41,495.31,502.71,576.11,653.31,729.9 
                                      Conservative Gordon Murdie 7.9% 501503.8 505.8506.9507540.2541.2574.6  
                                      Liberal Democrats Mo Hussain 4% 255261.6 263265.3265.3267.4271.6   
                                      UKIP Alan Melville 1.6% 102105.6 105.6106.8106.8     
                                      Scottish Socialist Natalie Reid 1.5% 97107.7 107.7108.2122125.2    
                                      Left Unity Bruce Whitehead 0.5% 3233.6 33.733.9      
                                      Independent John Scott 0.4% 2629 30       
                                      Libertarian Tom Laird 0.3% 1717.9         
                                      Electorate: 25,521  Valid: 6,324  Spoilt: 83  Quota: 2,109  Turnout: 6,407 (25.1%)

                                        Related Research Articles

                                        References