This article does not cite any sources . (April 2018) (Learn how and when to remove this template message) |
Elections to Amber Valley Borough Council in Derbyshire, England took place on Thursday 3 May 2018. One third of the council seats were up for election. [1]
Derbyshire is a county in the East Midlands of England. A substantial portion of the Peak District National Park lies within Derbyshire, containing the southern extremity of the Pennine range of hills which extend into the north of the county. The county contains part of the National Forest, and borders on Greater Manchester to the northwest, West Yorkshire to the north, South Yorkshire to the northeast, Nottinghamshire to the east, Leicestershire to the southeast, Staffordshire to the west and southwest and Cheshire also to the west. Kinder Scout, at 636 metres (2,087 ft), is the highest point in the county, whilst Trent Meadows, where the River Trent leaves Derbyshire, is its lowest point at 27 metres (89 ft). The River Derwent is the county's longest river at 66 miles (106 km), and runs roughly north to south through the county. In 2003 the Ordnance Survey placed Church Flatts Farm at Coton in the Elms as the furthest point from the sea in Great Britain.
England is a country that is part of the United Kingdom. It shares land borders with Wales to the west and Scotland to the north-northwest. The Irish Sea lies west of England and the Celtic Sea lies to the southwest. England is separated from continental Europe by the North Sea to the east and the English Channel to the south. The country covers five-eighths of the island of Great Britain, which lies in the North Atlantic, and includes over 100 smaller islands, such as the Isles of Scilly and the Isle of Wight.
The Conservatives gained seats to strengthen their position controlling the council. After the election, the composition of the council was:-
Party | Seats | Gains | Losses | Net gain/loss | Seats % | Votes % | Votes | +/− | |
---|---|---|---|---|---|---|---|---|---|
Conservative | 7 | +3 | -1 | +2 | 46.7% | 47.2% | 11723 | ||
Labour | 8 | +1 | -3 | -2 | 53.3% | 41.9% | 10417 | ||
Green | 0 | 0 | 0 | 0 | 0% | 5.8% | 1440 | ||
Liberal Democrat | 0 | 0 | 0 | 0 | 0% | 4.8% | 1182 | ||
Independent | 0 | 0 | 0 | 0 | 0% | 0.3% | 71 | ||
National Front | 0 | 0 | 0 | 0 | 0% | 0.1% | 30 | ||
Percentage change in party votes are from the last time the ward was contested. This is either 2015 or 2016.
Party | Candidate | Votes | % | ± | |
---|---|---|---|---|---|
Labour | John Walker | 993 | 59.7% | +6.1 | |
Conservative | Colin Boyce | 555 | 33.2% | +13.7 | |
Green | Leo Swarvett | 75 | 4.5% | +1.6 | |
Liberal Democrat | Kate Smith | 49 | 2.9% | -2.0 | |
Majority | 438 | ||||
Turnout | 1672 | ||||
Labour hold | Swing | ||||
Party | Candidate | Votes | % | ± | |
---|---|---|---|---|---|
Labour | Fay Atkinson | 812 | 44.9% | +14.4 | |
Conservative | Martin Tomlinson | 753 | 41.6% | -5.5 | |
Liberal Democrat | Adam Raphael | 164 | 9.1% | +9.1 | |
Green | Julie Wozniczka | 79 | 4.4% | -2.8 | |
Majority | 59 | ||||
Turnout | 1808 | ||||
Labour gain from Conservative | Swing | ||||
Party | Candidate | Votes | % | ± | |
---|---|---|---|---|---|
Labour | Carol Angharad | 811 | 47.7% | +17.5 | |
Conservative | Timothy Sutton | 629 | 37.0% | -3.8 | |
Green | Sue MacFarlane | 130 | 7.6% | -6.5 | |
Independent | Steven White | 71 | 4.2% | +4.2 | |
Liberal Democrat | Richard Salmon | 60 | 3.5% | +3.5 | |
Majority | 182 | ||||
Turnout | 1701 | ||||
Labour hold | Swing | ||||
Party | Candidate | Votes | % | ± | |
---|---|---|---|---|---|
Labour | Isobel Harry | 689 | 51.2% | -2.2 | |
Conservative | Matthew Murray | 615 | 45.7% | +20.1 | |
Liberal Democrat | Jeremy Miles | 43 | 3.2% | +1.6 | |
Majority | 74 | ||||
Turnout | 1347 | ||||
Labour hold | Swing | ||||
Party | Candidate | Votes | % | ± | |
---|---|---|---|---|---|
Conservative | Chris Short | 898 | 48.0% | -15.6 | |
Green | Dave Wells | 637 | 34.1% | +25.0 | |
Labour | Patrick Mountain | 225 | 12.0% | -7.4 | |
Liberal Democrat | Andrea Nove | 110 | 5.9% | -1.9 | |
Majority | 262 | ||||
Turnout | 1870 | ||||
Conservative hold | Swing | ||||
Party | Candidate | Votes | % | ± | |
---|---|---|---|---|---|
Labour | Hannah Stirland | 654 | 48.0% | +7.9 | |
Conservative | Sue Iliffe | 620 | 45.6% | +19.7 | |
Green | James Brooks | 60 | 4.4% | +1.3 | |
Liberal Democrat | John Morrissey | 29 | 2.1% | -0.6 | |
Majority | 34 | ||||
Turnout | 1363 | ||||
Labour hold | Swing | ||||
Party | Candidate | Votes | % | ± | |
---|---|---|---|---|---|
Conservative | Henry Thompson | 669 | 49.8% | +19.5 | |
Labour | Frank Carmichael | 583 | 43.4% | +5.2 | |
Liberal Democrat | Jerry Marler | 92 | 6.8% | +3.8 | |
Majority | 86 | ||||
Turnout | 1344 | ||||
Conservative gain from Labour | Swing | ||||
Party | Candidate | Votes | % | ± | |
---|---|---|---|---|---|
Conservative | Steven Grainger | 698 | 46.7% | +18.3 | |
Labour | Paul Jones | 670 | 44.8% | +2.6 | |
Green | Lian Pizzey | 78 | 5.2% | +2.5 | |
Liberal Democrat | Chris Oakley | 49 | 3.3% | +0.3 | |
Majority | 28 | ||||
Turnout | 1495 | ||||
Conservative gain from Labour | Swing | ||||
Party | Candidate | Votes | % | ± | |
---|---|---|---|---|---|
Labour | Paul Smith | 917 | 54.4% | +14.6 | |
Conservative | Pete Clark | 703 | 41.7% | +1.0 | |
Liberal Democrat | George Turner | 66 | 3.9% | +2.0 | |
Majority | 214 | ||||
Turnout | 1686 | ||||
Labour hold | Swing | ||||
Party | Candidate | Votes | % | ± | |
---|---|---|---|---|---|
Conservative | Trevor Ainsworth | 1345 | 57.4% | +6.9 | |
Labour | Sam Hart | 785 | 33.5% | +3.3 | |
Liberal Democrat | Susan Allen | 113 | 4.8% | +0.9 | |
Green | Steve Kennedy | 99 | 4.2% | -0.3 | |
Majority | 560 | ||||
Turnout | 2342 | ||||
Conservative hold | Swing | ||||
Party | Candidate | Votes | % | ± | |
---|---|---|---|---|---|
Labour | Eileen Hamilton | 535 | 48.7% | +5.2 | |
Conservative | Victoria Stevenson | 488 | 44.4% | +11.9 | |
Liberal Democrat | Joanna Jones | 45 | 4.1% | +2.8 | |
National Front | Timothy Knowles | 30 | 2.7% | +1.4 | |
Majority | 47 | ||||
Turnout | 1098 | ||||
Labour hold | Swing | ||||
Party | Candidate | Votes | % | ± | |
---|---|---|---|---|---|
Conservative | Sean Carter | 1207 | 49.6% | +10.6 | |
Labour | Roland Emmas-Williams | 1061 | 43.6% | +3.5 | |
Liberal Democrat | Richard Smeeton | 89 | 3.7% | +1.7 | |
Green | Will MacFarlane | 75 | 3.1% | +0.6 | |
Majority | 146 | ||||
Turnout | 2432 | ||||
Conservative gain from Labour | Swing | ||||
Party | Candidate | Votes | % | ± | |
---|---|---|---|---|---|
Conservative | Richard Iliffe | 1172 | 64.3% | +12.7 | |
Labour | Christine Venables | 436 | 23.9% | +1.8 | |
Liberal Democrat | Jacob Holt | 117 | 6.4% | +3.3 | |
Green | Tina Pritchard | 97 | 5.3% | +1.6 | |
Majority | 736 | ||||
Turnout | 1822 | ||||
Conservative hold | Swing | ||||
Party | Candidate | Votes | % | ± | |
---|---|---|---|---|---|
Labour | Brian Lyttle | 789 | 66.6% | +8.2 | |
Conservative | Kathy Moss | 358 | 30.2% | +17.1 | |
Liberal Democrat | Colin Thompson | 37 | 3.1% | +0.8 | |
Majority | 431 | ||||
Turnout | 1184 | ||||
Labour hold | Swing | ||||
Party | Candidate | Votes | % | ± | |
---|---|---|---|---|---|
Conservative | David Wilson | 1013 | 59.6% | +7.2 | |
Labour | Charlie Robinson | 457 | 26.9% | -0.7 | |
Liberal Democrat | Joel Hunt | 119 | 7.0% | +5.5 | |
Green | Steve Elliott | 110 | 6.5% | +2.6 | |
Majority | 556 | ||||
Turnout | 1699 | ||||
Conservative hold | Swing | ||||
The 2011 Plymouth City Council election took place on 5 May 2011 to elect members to Plymouth City Council in England. One third of the council was up for election, in addition to a by-election, making twenty seats in total. The previous election produced a majority for the Conservative Party. The election resulted in Labour gaining 5 seats with Conservatives retaining control.
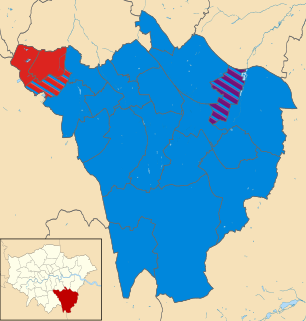
Elections to Bromley Council were held on 22 May 2014.
Elections for the London Borough of Merton were held on 22 May 2014 to elect members of Merton London Borough Council in England. This was on the same day as other local elections in England and an election to the European Parliament.
Elections for the London Borough of Merton were held on 4 May 1978 to elect members of Merton London Borough Council in London, England. This was on the same day as other local elections in England and Scotland.
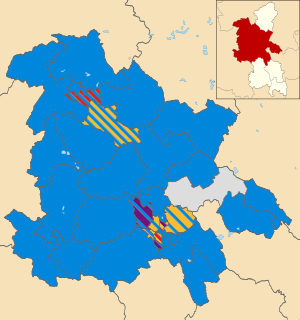
Elections for the London Borough of Merton were held on 6 May 1982 to elect members of Merton London Borough Council in London, England. This was on the same day as other local elections in England and Scotland.
Elections for the London Borough of Merton were held on 8 May 1986 to elect members of Merton London Borough Council in London, England. This was on the same day as other local elections in England and Scotland.
Elections for the London Borough of Merton were held on 3 May 1990 to elect members of Merton London Borough Council in London, England. This was on the same day as other local elections in England and Scotland.
The 2015 Aylesbury Vale District Council election took place on 7 May 2015 to elect members of Aylesbury Vale District Council in Buckinghamshire, England. The whole council was up for election with boundary changes since the last election in 2011. The Conservative party remained in overall control of the council.
An election was held in Swale Borough Council in England as part of the United Kingdom local elections on 7 May 2015. All 47 seats were up for election under new ward boundaries.
The 2015 Wychavon District Council election took place on 7 May 2015 to elect members of Wychavon District Council in Worcestershire, England. The whole council was up for election and the Conservative party stayed in overall control of the council.
A by-thirds Hyndburn Borough Council local election, was held on Thursday 03 May 2018. Approximately one third of the local council's 35 seats fall up for election on that day.
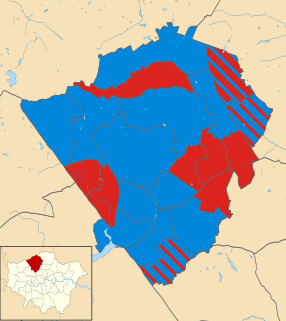
The 2018 Barnet Council election took place on 3 May 2018 to elect members of Barnet Borough Council in England. It took place on the same day as other local elections in 2018. In the last election, the Conservatives won control of the council with 32 seats, compared to 30 for Labour and 1 for the Liberal Democrats. On 15 March 2018, following the resignation of a Conservative councillor, the council was in a state of no overall control. The election on 3 May 2018 saw the Conservatives take back overall control with a majority of 13.
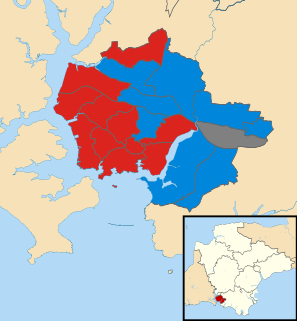
The 2018 Plymouth City Council election took place on 3 May 2018 to elect members of Plymouth City Council in England. The election was won by the Labour Party, who gained enough seats to achieve an overall majority and took control of the council.
The 2018 Oldham Council election took place on 3 May 2018 to elect members of Oldham Council in England. The election took place on the same day as other local elections in England. The election saw the majority Labour Party increase its number of seats by two. The Conservative Party also gained two seats, while the Liberal Democrats lost one seat. UKIP ceased to have representation on the council following this election. The election left Labour with 47 seats, the Liberal Democrats 8 and the Conservatives 4 with the remaining seat being held by an Independent.
The 2018 Havering London Borough Council election was held on 3 May 2018 to elect members of Havering London Borough Council in Greater London. Elections were held for all 53 seats on the council. This was on the same day as other local elections.
The 2018 Wandsworth Council election took place on 3 May 2018 to elect members of Wandsworth Council in England. This was on the same day as other local elections.
The 2018 Wokingham Borough Council election took place on Thursday 3 May 2018. That was the same day as other United Kingdom local elections in order to elect members of Wokingham Unitary Council in Berkshire, England. One third of the council was up for election and the Conservative party stayed comfortably in overall control of the council.
The 2018 Cherwell District Council election was held on 3 May 2018 to elect members of Cherwell District Council in England. This was on the same day as other local elections.
The 2011 South Oxfordshire District Council election was held on 5 May 2011 to elect members of South Oxfordshire District Council in England. This was on the same day as other local elections.