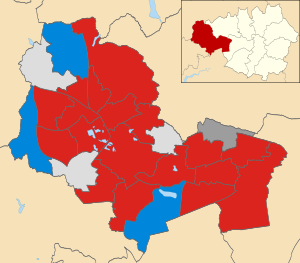
| |||||||||||||||||||||||||
25 of 75 seats to Wigan Metropolitan Borough Council 38 seats needed for a majority | |||||||||||||||||||||||||
---|---|---|---|---|---|---|---|---|---|---|---|---|---|---|---|---|---|---|---|---|---|---|---|---|---|
| |||||||||||||||||||||||||
The 2018 Wigan Metropolitan Borough Council election took place on 3 May 2018 to elect members of Wigan Metropolitan Borough Council in England. [1] This was on the same day as other local elections.
The Wigan Metropolitan Borough Council is the local authority for the Metropolitan Borough of Wigan in the United Kingdom. It consists of 75 Councillors with one-third being elected every three years in four. The borough is separated into 25 wards. Councillors are democratically accountable to the ward they are elected to represent. Each ward is represented on the council by three council members.
Party | Number |
---|---|
Labour Party (UK) | 25 |
Conservative Party (UK) | 25 |
Liberal Democrats (UK) | 14 |
Independent politician | 12 |
UK Independence Party | 6 |
Green Party of England and Wales | 3 |
Shevington Independents | 1 |
Standish Independents | 1 |
Democrats and Veterans | 1 |
Party | Seats won at Election | Total Seats on Council | ± |
---|---|---|---|
Labour Party (UK) | 18 | 60 | |
Conservative Party (UK) | 3 | 7 | |
Independent politician (including IN) | 3 | 6 | |
Standish Independents | 0 | 1 | |
Shevington Independents | 1 | 1 |
Party | Candidate | Votes | % | ± | |
---|---|---|---|---|---|
Independent Network | Stuart Gerrard | 1779 | 53.65 | ||
Labour | Karen Aldred | 1197 | 36.1 | ||
Conservative | Marjorie Clayton | 334 | 10.1 | ||
Rejected ballots | 6 | 0.18 | |||
Majority | 582 | 17.6 | |||
Turnout | 3316 | 30.66 |
Party | Candidate | Votes | % | ± | |
---|---|---|---|---|---|
Labour | Carl Sweeney | 1479 | 68.57 | ||
Conservative | Beverley Bridgwater | 404 | 18.78 | ||
UKIP | Frank Swift | 274 | 12.7 | ||
Rejected ballots | 5 | 0.23 | |||
Majority | 1075 | 49.84 | |||
Turnout | 2157 | 20.74 |
Party | Candidate | Votes | % | ± | |
---|---|---|---|---|---|
Labour | Anthony Sykes | 1112 | 53.13 | ||
Independent | Michael Moulding | 793 | 37.9 | ||
UKIP | Gillian Gibson | 109 | 5.21 | ||
Liberal Democrat | Geoffrey Matthews | 41 | 1.96 | ||
Conservative | Marie Winstanley | 36 | 1.72 | ||
Rejected ballots | 2 | 0.1 | |||
Majority | 319 | 15.24 | |||
Turnout | 2093 | 23.54 |
Party | Candidate | Votes | % | ± | |
---|---|---|---|---|---|
Independent | Andrew Collinson | 1065 | 43.7 | ||
Labour | Vicky Johnson | 973 | 39.9 | ||
Conservative | Judith Anderson | 198 | 8.12 | ||
UKIP | Philip Hayden | 133 | 5.46 | ||
Liberal Democrat | Denise Melling | 67 | 2.75 | ||
Rejected ballots | 2 | 0.08 | |||
Majority | 92 | 3.78 | |||
Turnout | 2438 | 27.58 |
Party | Candidate | Votes | % | ± | |
---|---|---|---|---|---|
Labour | Jim Talbot | 1063 | 45.6 | ||
Independent | Jim Ellis | 905 | 38.8 | ||
Conservative | Margaret Winstanley | 206 | 8.83 | ||
Green | Neil Hancox | 86 | 3.7 | ||
Liberal Democrat | John Skipworth | 58 | 2.5 | ||
Rejected ballots | 14 | 0.6 | |||
Majority | 158 | 6.8 | |||
Turnout | 2332 | 24.13 |
Party | Candidate | Votes | % | ± | |
---|---|---|---|---|---|
Independent | Paul Maiden | 976 | 41.36 | ||
Labour | Gena Merrett | 787 | 33.34 | ||
Liberal Democrat | John Thomason | 305 | 12.92 | ||
Conservative | Jonathan Cartwright | 287 | 12.16 | ||
Rejected ballots | 5 | 0.21 | |||
Majority | 189 | 8.0 | |||
Turnout | 2360 | 27.35 |
Party | Candidate | Votes | % | ± | |
---|---|---|---|---|---|
Conservative | Richard Clayton | 1430 | 46.47 | ||
Labour | Eileen Rigby | 1273 | 41.37 | ||
Liberal Democrat | Denise Capstick | 367 | 11.92 | ||
Rejected ballots | 7 | 0.23 | |||
Majority | 157 | 5.10 | |||
Turnout | 3077 | 32.24 |
Party | Candidate | Votes | % | ± | |
---|---|---|---|---|---|
Labour | Clive Morgan | 1369 | 57.11 | ||
Conservative | Daniel Whitehouse | 509 | 21.23 | ||
Green | Steven Heyes | 195 | 8.14 | ||
UKIP | Daniel Singleton | 177 | 7.38 | ||
Liberal Democrat | Neil Stevenson | 114 | 4.76 | ||
Rejected ballots | 6 | 0.25 | |||
Majority | 887 | 37.0 | |||
Turnout | 2397 | 26.15 |
Party | Candidate | Votes | % | ± | |
---|---|---|---|---|---|
Labour | Patricia Holland | 1449 | 66.46 | ||
UKIP | Maureen McCoy | 327 | 15.0 | ||
Conservative | Paul Chapman | 314 | 14.40 | ||
Liberal Democrat | Joshua Hindle | 90 | 4.13 | ||
Rejected ballots | 2 | 0.09 | |||
Majority | 1122 | 51.46 | |||
Turnout | 2180 | 24.07 |
Party | Candidate | Votes | % | ± | |
---|---|---|---|---|---|
Labour | Barry Taylor | 1349 | 52.43 | ||
Conservative | Richard Short | 1082 | 42.05 | ||
Liberal Democrat | Stuart Thomas | 131 | 5.09 | ||
Rejected ballots | 11 | 0.43 | |||
Majority | 267 | 10.38 | |||
Turnout | 2573 | 27.21 |
Party | Candidate | Votes | % | ± | |
---|---|---|---|---|---|
Labour | Debra Wailes | 938 | 48.03 | ||
Independent Network | Anthony Waite | 550 | 28.16 | ||
Conservative | Paul Fairhurst | 394 | 20.17 | ||
Liberal Democrat | Lorraine Gillon | 68 | 3.48 | ||
Rejected ballots | 3 | 0.15 | |||
Majority | 388 | 19.87 | |||
Turnout | 1953 | 23.44 |
Party | Candidate | Votes | % | ± | |
---|---|---|---|---|---|
Labour | Susan Gambles | 1280 | 57.17 | ||
Independent | William Heaton | 612 | 27.33 | ||
Conservative | Gerard Houlton | 345 | 15.41 | ||
Rejected ballots | 2 | 0.09 | |||
Majority | 668 | 29.83 | |||
Turnout | 2239 | 25.26 |
Party | Candidate | Votes | % | ± | |
---|---|---|---|---|---|
Labour | Frederick Walker | 1189 | 59.21 | ||
Conservative | Denise Young | 518 | 25.8 | ||
Liberal Democrat | John Dowsett | 288 | 14.34 | ||
Rejected ballots | 13 | 0.65 | |||
Majority | 671 | 33.42 | |||
Turnout | 2008 | 22.23 |
Party | Candidate | Votes | % | ± | |
---|---|---|---|---|---|
Labour | Charles Rigby | 1531 | 53.9 | ||
Conservative | Connor Short | 1283 | 45.16 | ||
Rejected ballots | 27 | 0.95 | |||
Majority | 248 | 8.73 | |||
Turnout | 2841 | 27.49 |
Party | Candidate | Votes | % | ± | |
---|---|---|---|---|---|
Labour | Peter Smith, Baron Smith of Leigh | 1308 | 53.92 | ||
Independent | Jayson Lomax-Hargreaves | 578 | 23.83 | ||
Conservative | Richard Houlton | 374 | 15.42 | ||
Liberal Democrat | Natalie Smalley | 158 | 6.51 | ||
Rejected ballots | 8 | 0.33 | |||
Majority | 730 | 30.09 | |||
Turnout | 2426 | 23.11 |
Party | Candidate | Votes | % | ± | |
---|---|---|---|---|---|
Conservative | Edward Houlton | 2099 | 60.49 | ||
Labour | Garry Lloyd | 1346 | 38.79 | ||
Rejected ballots | 25 | 0.72 | |||
Majority | 753 | 21.70 | |||
Turnout | 3470 | 36.05 |
Party | Candidate | Votes | % | ± | |
---|---|---|---|---|---|
Labour | Joanne Marshall | 1,344 | |||
Independent | Julian Marsh | 706 | |||
Conservative | David Stirzaker | 587 | |||
Rejected ballots | |||||
Majority | |||||
Turnout |
Party | Candidate | Votes | % | ± | |
---|---|---|---|---|---|
Labour | Ronald Conway | 1,708 | 61.4 | ||
Conservative | Michael Owens | 764 | 27.5 | ||
Liberal Democrat | Andrew Holland | 308 | 11.1 | ||
Majority | 944 | 33.9 | |||
Turnout | 2,780 | 28.2 | |||
Labour hold | Swing | N/A |
Party | Candidate | Votes | % | ± | |
---|---|---|---|---|---|
Labour | Shirley Dewhurst | 1,551 | 78.6 | ||
Conservative | Margaret Atherton | 422 | 21.4 | ||
Majority | 1,129 | 57.2 | |||
Turnout | 1,973 | 20.8 | |||
Labour hold | Swing | N/A |
Party | Candidate | Votes | % | ± | |
---|---|---|---|---|---|
Labour | James Moodie | 1,273 | 69.2 | ||
Independent | James O'Neill | 379 | 20.6 | ||
Conservative | Yamini Gupta | 188 | 10.2 | ||
Majority | 894 | 48.6 | |||
Turnout | 1,840 | 20.7 | |||
Labour hold | Swing | N/A |
Party | Candidate | Votes | % | ± | |
---|---|---|---|---|---|
Labour | Paul Prescott | 1,472 | 74.4 | ||
Conservative | Susan Atherton | 322 | 16.3 | ||
Liberal Democrat | David Burley | 185 | 9.3 | ||
Majority | 1,150 | 58.1 | |||
Turnout | 1,979 | 20.6 | |||
Labour hold | Swing | N/A |
Party | Candidate | Votes | % | ± | |
---|---|---|---|---|---|
Shevington Independents | Janet Brown | 1,107 | 40.1 | ||
Labour | Mike Crosby | 1,045 | 37.9 | ||
Conservative | Allan Atherton | 487 | 17.7 | ||
Green | Joseph Rylance | 120 | 4.3 | ||
Majority | 62 | 2.2 | N/A | ||
Turnout | 2,759 | 29.6 | |||
Shevington Independents gain from Labour | Swing | ||||
Party | Candidate | Votes | % | ± | |
---|---|---|---|---|---|
Conservative | Adam Marsh | 1,200 | 36.8 | ||
Labour | Debbie Parkinson | 1,185 | 36.4 | ||
Standish Independents | Debbie Fairhurst | 872 | 26.8 | ||
Majority | 15 | 0.4 | N/A | ||
Turnout | 3,257 | 33.3 | |||
Conservative gain from Standish Independents | Swing | ||||
Party | Candidate | Votes | % | ± | |
---|---|---|---|---|---|
Labour | George Davies | 1,518 | 55.5 | ||
Conservative | Lewis Evans | 834 | 30.5 | ||
Liberal Democrat | Caroline Waddicor | 163 | 6.0 | ||
Wigan Independents | Gareth Fairhurst | 130 | 4.8 | ||
Independent | Tony Spencer | 89 | 3.3 | ||
Majority | 684 | 25.0 | |||
Turnout | 2,734 | 29.5 | |||
Labour hold | Swing | N/A |
Party | Candidate | Votes | % | ± | |
---|---|---|---|---|---|
Labour | Phyllis Cullen | 1,746 | 72.0 | ||
Conservative | Jean Peet | 363 | 15.0 | ||
UKIP | Nathan Ryding | 176 | 7.3 | ||
Democrats and Veterans | Ronnie Clark | 140 | 5.8 | ||
Majority | 1,383 | 57.0 | |||
Turnout | 2,425 | 25.4 | |||
Labour hold | Swing |
The Metropolitan Borough of Wirral is a metropolitan borough of Merseyside, in North West England. It has a population of 321,238, and encompasses 60 square miles (160 km2) of the northern part of the Wirral Peninsula. Major settlements include Birkenhead, Wallasey, Bebington, Heswall, Hoylake and West Kirby. The city of Liverpool over the Mersey, faces the northeastern side of Wirral. Bordering is the River Mersey to the east, the Irish Sea to the north and the River Dee to the west; the borough of Cheshire West and Chester occupies the remainder of the Wirral Peninsula and borders the borough of Wirral to the south. The borough of Wirral has greater proportions of rural areas than the Liverpool part of Merseyside.
The Metropolitan Borough of Wigan is a metropolitan borough of Greater Manchester, in North West England. It is named after its largest component town and former county borough, Wigan and includes the towns and villages of Leigh, part of Ashton-in-Makerfield, Ince-in-Makerfield, Hindley, Orrell, Standish, Atherton, Tyldesley, Golborne, Lowton, Billinge, Astley, Haigh and Aspull. The borough was formed in 1974 and is an amalgamation of several former local government districts and parishes. The borough has three civil parishes and lies directly to the west of the City of Salford and southwest of the Metropolitan Borough of Bolton. The local authority is Wigan Metropolitan Borough Council.
One third of Wigan Metropolitan Borough Council in Greater Manchester, England is elected each year, followed by one year without election. Since the last boundary changes in 2004, 75 councillors have been elected from 25 wards.
The 1999 Wirral Metropolitan Borough Council election took place on 6 May 1999 to elect members of Wirral Metropolitan Borough Council in England. This election was held on the same day as other local elections.
The 2002 Wirral Metropolitan Borough Council election took place on 2 May 2002 to elect members of Wirral Metropolitan Borough Council in England. This election was held on the same day as other local elections.
The 2004 Wirral Metropolitan Borough Council election took place on 10 June 2004 to elect members of Wirral Metropolitan Borough Council in England. This election was held on the same day as other local elections.
The 1973 Wigan Council elections for the First Wigan Metropolitan Borough Council were held on 10 May 1973, with the entirety of the 72 seat council - three seats for each of the 24 wards - up for vote. It was the first council election as the newly formed metropolitan borough under a new constitution. The Local Government Act 1972 stipulated that the elected members were to shadow and eventually take over from the predecessor corporation on 1 April 1974. The order in which the councillors were elected dictated their term serving, with third-place candidates serving two years and up for re-election in 1975, second-placed three years expiring in 1976 and 1st-placed five years until 1978.
The 2014 Wigan Metropolitan Borough Council election took place on 22 May 2014 to elect members of Wigan Metropolitan Borough Council in England. This was on the same day as other local elections.
The 2015 Wigan Metropolitan Borough Council election took place on 7 May 2015 to elect members of Wigan Metropolitan Borough Council in England. This was on the same day as other local elections and the general election.
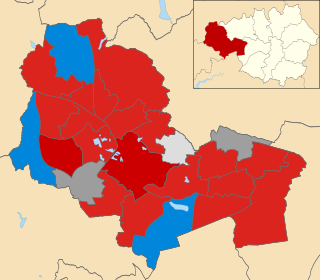
The 2016 Wigan Metropolitan Borough Council election took place on 5 May 2016 to elect members of Wigan Metropolitan Borough Council in England. This was on the same day as other local elections.
Council elections in England were held on Thursday 3 May 2018. Elections were held in all 32 London boroughs, 34 metropolitan boroughs, 67 district and borough councils and 17 unitary authorities. There were also direct elections for the mayoralties of Hackney, Lewisham, Newham, Tower Hamlets and Watford.
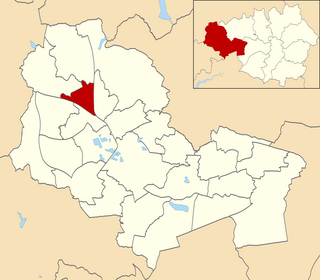
Wigan West is an electoral ward in Wigan, England. It forms part of Wigan Metropolitan Borough Council, as well as the parliamentary constituency of Wigan.
Wigan Central is an electoral ward in Wigan, England. It forms part of Wigan Metropolitan Borough Council, as well as the parliamentary constituency of Wigan.
Douglas is an electoral ward in Wigan, England. It forms part of Wigan Metropolitan Borough Council, as well as the parliamentary constituency of Wigan.
Standish with Langtree is an electoral ward in Wigan, England. It forms part of Wigan Metropolitan Borough Council, as well as the parliamentary constituency of Wigan.
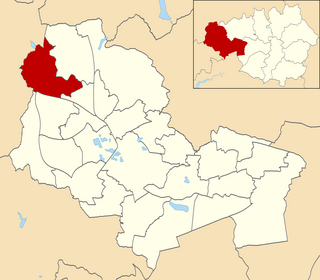
Shevington with Lower Ground is an electoral ward in Wigan, England. It forms part of Wigan Metropolitan Borough Council, as well as the parliamentary constituency of Wigan.
Pemberton is an electoral ward in Wigan, England. It forms part of Wigan Metropolitan Borough Council, as well as the parliamentary constituency of Wigan.
Ince is an electoral ward in Wigan, England. It forms part of Wigan Metropolitan Borough Council, as well as the parliamentary constituency of Wigan.
The 2019 Wigan Metropolitan Borough Council election is scheduled to be held on Thursday 2 May 2019 to elect members of Wigan Metropolitan Borough Council in England. This will be on the same day as other local elections.