Bury Metropolitan Borough Council election, 2004

Last updated

The Metropolitan Borough of Bury shown within England. EnglandBury.png
The Metropolitan Borough of Bury shown within England.

Elections to Bury Metropolitan Borough Council were held on 10 June 2004. The whole council was up for election with boundary changes since the last election in 2003. [1] The number of councillors increased from 48 to 51, with the addition on North Manor Ward, as well as other boundary changes, therefore it is not possible to show seats gained and lost. The top 3 candidates in each ward were elected.

Bury Metropolitan Borough Council Local governement body in England

Bury Metropolitan Borough Council is the local authority of the Metropolitan Borough of Bury in Greater Manchester, England. It is a metropolitan district council, one of ten in Greater Manchester and one of 36 in the metropolitan counties of England. It provides the majority of local government services in Bury.

Contents

The Labour Party retained control of the council.

After the election, the composition of the council was

Election result

Bury Local Election Result 2004
PartySeatsGainsLossesNet gain/lossSeats %Votes %Votes+/−
  Labour 27 +0 35.0 24,884 -5.3
  Conservative 19 +2 37.0 26,215 -2.8
  Liberal Democrat 5 +1 21.7 15,457 +2.9
  BNP 0 0 0 0 0 3.2 2,235 +3.2
  Independent 0 0 0 0 0 3.1 2,241 +2.9%

Ward results

Besses
PartyCandidateVotes%±
Labour Derek Boden 1,724 22.6
Labour Alan Matthews 1,514 19.9
Labour Ken Audin 1,424 18.7
Conservative Mark Roberts 830 10.9
Conservative Julian Kershner 783 10.3
Liberal Democrat Winnifred Rohmann 681 8.9
Conservative Chava Odze 657 8.6
Turnout
Church
PartyCandidateVotes%±
Conservative Roy Walker 2,643 22.4
Conservative Jack Walton 2,161 18.3
Conservative Robert Bibby 1,922 16.3
Labour Andrew McAnulty 1,357 11.5
Labour Leslie Jones 1,182 10.0
Labour Benjamin Shatliff 885 7.5
BNP Thomas Rosser 817 6.9
Liberal Democrat Michael Bell 815 6.9
Turnout
East
PartyCandidateVotes%±
Labour John Byrne 1,597 16.5
Labour Mike Connolly 1,582 16.4
Labour Trevor Holt 1,538 15.9
Conservative Azmat Husain 1,115 11.5
Liberal Democrat Jeanette Tonge 1,083 11.2
Conservative Nawaz Khan 1,051 10.9
Conservative Shahid Haider 757 7.8
Independent Anthony Hill 489 5.1
Independent Thomas Canham 441 4.6
Turnout
Elton
PartyCandidateVotes%±
Conservative Yvonne Creswell 1,639 16.7
Conservative Denise Bigg 1,519 15.5
Labour John Costello 1,468 15.0
Conservative Michael Hankey 1,447 14.7
Labour Evelyn Holt 1,317 13.4
Labour Ray Watts 1,274 13.0
Liberal Democrat Yvonne Eagle 717 7.3
Independent Shaun Fitzsimon 423 4.3
Turnout
Holyrood
PartyCandidateVotes%±
Liberal Democrat Victor D'Albert 2,114 19.6
Liberal Democrat Wilf Davison 1,994 18.5
Liberal Democrat Tim Pickstone 1,980 18.4
Labour Eve Sandler 891 8.3
Labour Darrell Johnson 873 8.1
Labour Lillian Johnston 867 8.1
Conservative Sheila Blaby 721 6.7
Conservative Marilyn Vincent 688 6.4
Conservative Jeanette Chrystal 625 5.8
Turnout
Moorside
PartyCandidateVotes%±
Labour Dot Cassidy 1,608 15.9
Labour Keith Rothwell 1,357 13.4
Labour Warren Flood 1,324 13.1
Conservative Peter Ashworth 1,195 11.8
Conservative Trevor Jones 1,175 11.6
Conservative Beverley Sullivan 1,141 11.3
Liberal Democrat Victor Hagan 794 7.8
Liberal Democrat James Eagle 791 7.8
Liberal Democrat Paul Jenkins 738 7.3
Turnout
North Manor
PartyCandidateVotes%±
Conservative Dorothy Gunther 3,075 25.1
Conservative David Higgin 2,877 23.5
Conservative James Taylor 2,459 20.1
Labour Peter Bury 1,099 9.0
Labour Ian Hargreaves 1,043 8.5
Liberal Democrat Robert Sloss 931 7.6
Labour Zia Ullah 740 6.0
Turnout
Pilkington Park
PartyCandidateVotes%±
Conservative Michelle Wiseman 2,208 21.7
Conservative Peter Redstone 2,012 19.8
Conservative Bernie Vincent 1,800 17.7
Labour Paul Nesbit 1,339 13.2
Labour Alan Quinn 1,045 10.3
Labour Elliot Moss 1,025 10.1
Liberal Democrat Lynn Molloy 736 7.2
Turnout
Radcliffe East
PartyCandidateVotes%±
Labour Lyndsey Campbell 1,626 18.7
Labour Siobhan Costello 1,355 15.6
Labour Steve Perkins 1,299 15.0
Conservative Jeffrey McGilvray 1,115 12.9
Conservative Eric Margieson 1,026 11.8
Liberal Democrat Peter Staley 769 8.9
BNP Janet Lees 755 8.7
Conservative Alison Roberts 725 8.4
Turnout
Radcliffe North
PartyCandidateVotes%±
Labour Tim Chamberlain 1,827 16.9
Labour Barry Briggs 1,788 16.6
Labour Sharron Briggs 1,740 16.1
Conservative Alan Bigg 1,574 14.6
Conservative Stuart Penketh 1,427 13.2
Conservative Anthony Sprason 1,283 11.9
Liberal Democrat Gaynor Clarkson 768 7.1
Independent Bernadette Hargreaves 380 3.5
Turnout
Radcliffe West
PartyCandidateVotes%±
Labour Tony Isherwood 1,652 20.9
Labour Anthony Cummings 1,601 20.3
Labour Wayne Campbell 1,562 19.8
Conservative Kathleen Armour 852 10.8
Conservative Roger Thompson 842 10.7
Conservative Ian Bevan 821 10.4
Liberal Democrat Caroline Gardner 561 7.1
Turnout
Ramsbottom
PartyCandidateVotes%±
Conservative Barry Theckston 2,329 21.7
Conservative Sheila Magnall 2,106 19.6
Conservative Richard Nuttall 1,813 16.9
Labour Jane Lewis 1,406 13.1
Labour Nicole Ivanoff 1,147 10.7
Labour Michael Rae 1,127 10.5
Liberal Democrat Fiona Davison 815 7.6
Turnout
Redvales
PartyCandidateVotes%±
Labour Susan Southworth 1,503 16.6
Labour John Smith 1,410 15.6
Conservative Khalid Hussain 1,178 13.0
Conservative Iona Worthington 1,156 12.8
Labour Farook Chaudhry 1,142 12.6
Conservative Ijaz Ahmed 1,003 11.1
Liberal Democrat Bill Brison 986 10.9
Independent Debbie Pierce 652 7.2
Turnout
St Mary's
PartyCandidateVotes%±
Labour Margaret Gibb 1,597 15.0
Labour Keith Grime 1,550 14.6
Labour Steve Treadgold 1,381 13.0
Conservative Anthony Barlow 1,225 11.5
Conservative David Green 1,171 11.0
Conservative Denise Ormrod 1,141 10.8
Liberal Democrat Mary D'Albert 910 8.6
Liberal Democrat Maureen Davison 905 8.5
Liberal Democrat Michael Halsall 726 6.8
Turnout
Sedgley
PartyCandidateVotes%±
Liberal Democrat Ann Garner 1,692 13.2
Labour Gill Campbell 1,543 12.1
Liberal Democrat Andrew Garner 1,542 12.1
Labour Catherine Evans 1,478 11.6
Labour Peter Timperley 1,471 11.5
Liberal Democrat Donal O'Hanlon 1,465 11.5
Conservative Neville Singer 1,260 9.9
Conservative Henry Kessler 1,229 9.6
Conservative Shneur Odze 1,092 8.5
Turnout
Tottington
PartyCandidateVotes%±
Conservative Roger Brown 1,796 19.5
Conservative Tvonne Wright 1,563 16.6
Conservative Iain Garside 1,479 16.0
Labour Simon Carter 1,111 12.0
Labour Vera McClung 1,044 11.3
Labour Victor McClung 980 10.6
BNP Stewart Clough 663 7.2
Liberal Democrat Emma Davison 580 6.3
Turnout
Unsworth
PartyCandidateVotes%±
Conservative Sam Cohen 1,560 16.8
Labour Gordon Sharkey 1,536 16.5
Labour Joan Grimshaw 1,418 15.3
Labour Stella Smith 1,335 14.4
Conservative Marilyn Green 1,307 14.1
Conservative Jonathan Grosskopf 1,231 13.3
Liberal Democrat Geoffrey Young 505 5.4
Independent Alan Garman 435 16.7
Independent Maurice Konyk 95 1.0
Turnout

Related Research Articles

Croydon London Borough Council elections

Elections for the Council in the London Borough of Croydon are held every four years to elect 70 councillors. At the last elections, which were held in May 2014, 30 Conservative councillors and 40 Labour councillors, providing a Labour majority of ten seats.

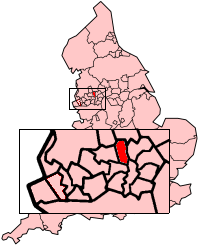
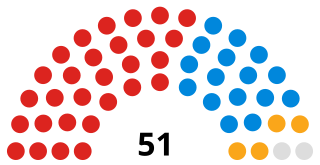
One third of Bury Metropolitan Borough Council in Greater Manchester, England is elected each year, followed by one year without election. Since the last boundary changes in 2004, 51 councillors have been elected from 17 wards.

1976 United Kingdom local elections

Local elections were held in the United Kingdom on 6 May 1976. Elections were for one third of the seats on Metropolitan borough councils and for all seats on Non-Metropolitan district councils in England; and for all seats on the Welsh district councils.

Elections to Hyndburn Borough Council were held on 2 May 2002. The whole council was up for election with boundary changes since the last election in 2000 reducing the number of seats by 12. The Labour party gained overall control of the council from the Conservative party.

The 2004 South Tyneside Metropolitan Borough Council election took place on 10 June 2004 to elect members of South Tyneside Metropolitan Borough Council in Tyne and Wear, England. The whole council was up for election with boundary changes since the last election in 2003 reducing the number of seats by 6. The Labour party stayed in overall control of the council.

Elections to High Peak Borough Council in Derbyshire, England were held on 1 May 2003. All of the council was up for election and the control of the council changed from Labour control to no overall control. Boundary changes since the 1999 local elections reduced the number of seats by 1, and meant that all wards had changed boundaries, with the exception of Whaley Bridge ward.

1979 United Kingdom local elections

Local elections were held in the United Kingdom on 3 May 1979. The results provided some source of comfort to the Labour Party (UK), who recovered some lost ground from local election reversals in previous years, despite losing the general election to the Conservative Party on the same day.

1980 United Kingdom local elections

Local elections were held in the United Kingdom in 1980. These were the first annual local elections for the new Conservative Prime Minister Margaret Thatcher. Though the Conservatives in government lost seats, the projected share of the vote was close: Labour Party 42%, Conservative Party 40%, Liberal Party 13%. Labour were still being led by the former prime minister James Callaghan, who resigned later in the year to be succeeded by Michael Foot.

2003 Redcar and Cleveland Borough Council election

The 2003 Redcar and Cleveland Borough Council election took place on 1 May 2003 to elect members of Redcar and Cleveland Unitary Council in England. The whole council was up for election with boundary changes since the last election in 1999. The Labour party lost overall control of the council to no overall control.

The second elections to the Carmarthenshire County Council were held in May 1999. It was preceded by the 1995 election and followed by the 2004 election. They resulted in a coalition between Independent councillors and Plaid Cymru for the next five years.

Elections to Pembrokeshire County Council were held on 6 May 1999. It was preceded by the 1995 election and followed by the 2004 election. On the same day there were the first elections to the Welsh Assembly and elections to the other 21 local authorities in Wales and community councils in Wales.

The second elections to the City and County of Swansea Council were held in May 1999. It was preceded by the 1995 election and followed by the 2004 election.

Elections to Broxtowe Borough Council were held on 7 May 2015 to elect all 44 members to the Councils 20 electoral wards each electing between 1 and 3 members who will each serve a 4-year term expiring in 2019.

An election to the Carmarthenshire County Council was held in March 1946. The 1940 and 1943 elections were postponed due to the Second World War, therefore the election was preceded by the 1937 election and followed, by the 1949 election.

An election to the Carmarthenshire County Council was held in March 1931. It was preceded by the 1928 election and followed by the 1934 election.

An election to the Carmarthenshire County Council was held in March 1937. It was preceded by the 1934 election. Due to the Second World War no elections were held in 1940 and 1943 therefore the 1937 election was followed by the 1946 election.

An election to the Carmarthenshire County Council was held in April 1952. It was preceded by the 1949 election and followed, by the 1955 election.

The second election to the Powys County Council following local government reorganisation was held in May 1999. It was preceded by the 1995 election and followed by the 2004 election. The election resulted once again in a majority of Independent councillors.

2018 Leeds City Council election

The 2018 Leeds City Council election took place on 3 May 2018 to elect members of Leeds City Council in England. They were held on the same day as other local elections across England and the rest of the UK.

An election for Redbridge London Borough Council took place on 3 May 2018, the same day as for other London Boroughs. All 63 seats were up for election, with new ward boundaries in place. The Labour Party retained control of the council with an increased majority, taking 81% of the seats.

References

  1. "Bury council". BBC News Online . Retrieved 2009-12-16.