Elections to Bury Council were held on 1 May 2008. One third of the council was up for election. The Conservative Party gained overall control of the council, from previous No Overall Control of any party.
The Metropolitan Borough of Bury is a metropolitan borough of Greater Manchester in North West England, just north of Manchester, which consists of six towns: Bury, Ramsbottom, Tottington, Radcliffe, Whitefield and Prestwich. Bury bounds the Lancashire districts of Rossendale and Blackburn with Darwen to the north.
The Conservative Party, officially the Conservative and Unionist Party, is a centre-right political party in the United Kingdom. Presently led by Theresa May, it has been the governing party since 2010. It presently has 314 Members of Parliament in the House of Commons, 249 members of the House of Lords, and 18 members of the European Parliament. It also has 31 Members of the Scottish Parliament, 12 members of the Welsh Assembly, eight members of the London Assembly and 9,008 local councillors. One of the major parties of UK politics, it has formed the government on 45 occasions, more than any other party.
After the election, the composition of the council was
Party | Seats | Gains | Losses | Net gain/loss | Seats % | Votes % | Votes | +/− | |
---|---|---|---|---|---|---|---|---|---|
Conservative | 10 | 3 | 0 | +3 | 58.8 | 45.0 | 25,447 | +3.6 | |
Labour | 4 | 0 | 4 | -4 | 23.5 | 25.6 | 14,469 | -8.3 | |
Liberal Democrat | 3 | 1 | 0 | +1 | 17.6 | 17.9 | 10,121 | -0.5 | |
BNP | 0 | 0 | 0 | 0 | 0 | 8.8 | 4,958 | +2.9 | |
English Democrat | 0 | 0 | 0 | 0 | 0 | 0.2 | 354 | +0.2 | |
UKIP | 0 | 0 | 0 | 0 | 0 | 0.2 | 89 | +0.2 | |
Independent | 0 | 0 | 0 | 0 | 0 | 2.4 | 1,352 | +2.1 | |
Party | Candidate | Votes | % | ± | |
---|---|---|---|---|---|
Labour | Derek Boden | 1084 | 41.1 | -6.4 | |
Liberal Democrat | Julie Baum | 614 | 23.3 | +5.3 | |
Conservative | Adele Douglas | 584 | 22.2 | -12.4 | |
English Democrat | Stephen Morris | 354 | 13.4 | +13.4 | |
Majority | 470 | 17.8 | +4.9 | ||
Turnout | 2,636 | ||||
Labour hold | Swing | ||||
Party | Candidate | Votes | % | ± | |
---|---|---|---|---|---|
Conservative | Roy Walker | 2425 | 63.9 | +8.6 | |
Labour | Linda Chesters | 789 | 20.8 | -3.6 | |
BNP | Julia Kay | 292 | 7.7 | -2.1 | |
Liberal Democrat | Tamsin Thomson | 287 | 7.6 | -2.9 | |
Majority | 1636 | 43.1 | +12.2 | ||
Turnout | 3,793 | ||||
Conservative hold | Swing | ||||
Party | Candidate | Votes | % | ± | |
---|---|---|---|---|---|
Labour | John Byrne | 1148 | 44.9 | -4.8 | |
Conservative | Azmat Hussain | 1023 | 40.0 | +9.2 | |
Liberal Democrat | Emma Davison | 384 | 15.0 | +2.9 | |
Majority | 125 | 4.9 | -14.0 | ||
Turnout | 2,555 | ||||
Labour hold | Swing | ||||
Party | Candidate | Votes | % | ± | |
---|---|---|---|---|---|
Conservative | Yvonne Creswell | 1861 | 61.2 | +8.9 | |
Labour | Simon Carter | 775 | 25.5 | -6.0 | |
Liberal Democrat | Robert Sloss | 405 | 13.3 | -3.0 | |
Majority | 1086 | 35.7 | +14.9 | ||
Turnout | 3,041 | ||||
Conservative hold | Swing | ||||
Party | Candidate | Votes | % | ± | |
---|---|---|---|---|---|
Liberal Democrat | Vic DAlbert | 1632 | 51.8 | -2.8 | |
Conservative | Matthew Hague | 852 | 27.0 | +4.6 | |
Labour | Benjamin Shatliff | 669 | 21.2 | -1.8 | |
Majority | 780 | 24.7 | -7.0 | ||
Turnout | 3,153 | ||||
Liberal Democrat hold | Swing | ||||
Party | Candidate | Votes | % | ± | |
---|---|---|---|---|---|
Labour | Dot Cassidy | 1279 | 40.7 | +1.6 | |
Conservative | Angela Cane | 1197 | 38.0 | +3.8 | |
BNP | Phil Sedman | 317 | 10.1 | -0.6 | |
Liberal Democrat | Nissa Finney | 223 | 7.1 | -8.9 | |
Independent | Victor Hagan | 130 | 4.1 | +4.1 | |
Majority | 82 | 2.6 | -2.3 | ||
Turnout | 3,146 | ||||
Labour hold | Swing | ||||
Party | Candidate | Votes | % | ± | |
---|---|---|---|---|---|
Conservative | Dorothy Gunther | 2694 | 70.2 | +7.5 | |
Labour | Nick Parnell | 577 | 15.0 | -4.6 | |
Liberal Democrat | Ewan Arthur | 338 | 8.8 | -4.1 | |
BNP | Tom Nuttall | 162 | 4.2 | -0.6 | |
Independent | Lynette Mitchell (Male) | 66 | 1.7 | +1.7 | |
Majority | 2117 | 55.2 | +12.1 | ||
Turnout | 3,837 | ||||
Conservative hold | Swing | ||||
Party | Candidate | Votes | % | ± | |
---|---|---|---|---|---|
Conservative | Michelle Wiseman | 1908 | 67.0 | +5.7 | |
Labour | Gill Campbell | 637 | 22.4 | -4.2 | |
Liberal Democrat | Wayne Burrows | 304 | 10.7 | -1.4 | |
Majority | 1271 | 44.6 | +9.9 | ||
Turnout | 2,849 | ||||
Conservative hold | Swing | ||||
Party | Candidate | Votes | % | ± | |
---|---|---|---|---|---|
Conservative | Sam Hurst | 1384 | 45.2 | +12.9 | |
Labour | Daisy Johnston | 907 | 29.6 | -6.2 | |
BNP | Tom Rosser | 466 | 15.2 | -4.3 | |
Liberal Democrat | Mike Halsall | 308 | 10.0 | -2.5 | |
Majority | 477 | 15.6 | |||
Turnout | 3,065 | ||||
Conservative gain from Labour | Swing | ||||
Party | Candidate | Votes | % | ± | |
---|---|---|---|---|---|
Conservative | Jackie Harris | 1656 | 45.8 | +5.0 | |
Labour | Timothy Chamberlain | 1265 | 35.0 | -3.6 | |
BNP | Peter Hallows | 472 | 13.1 | -0.3 | |
Liberal Democrat | Lynn Molloy | 220 | 6.1 | -1.2 | |
Majority | 391 | 10.8 | +8.6 | ||
Turnout | 3,613 | ||||
Conservative gain from Labour | Swing | ||||
Party | Candidate | Votes | % | ± | |
---|---|---|---|---|---|
Labour | Tony Isherwood | 1187 | 44.6 | -5.7 | |
Conservative | Bernard Slingsby | 727 | 27.3 | +4.7 | |
BNP | Stewart Clough | 484 | 18.2 | -1.3 | |
Liberal Democrat | Joanne O'Hanlon | 175 | 6.6 | -1.0 | |
UKIP | Harold Greenhalgh | 89 | 3.3 | +3.3 | |
Majority | 460 | 17.3 | -10.5 | ||
Turnout | 2,662 | ||||
Labour hold | Swing | ||||
Party | Candidate | Votes | % | ± | |
---|---|---|---|---|---|
Conservative | Barry Theckston | 2010 | 62.1 | +6.4 | |
Labour | Val Robinson | 872 | 26.9 | -5.0 | |
Liberal Democrat | Janet Turner | 354 | 10.9 | -1.7 | |
Majority | 1138 | 35.2 | +11.3 | ||
Turnout | 3,236 | ||||
Conservative hold | Swing | ||||
Party | Candidate | Votes | % | ± | |
---|---|---|---|---|---|
Conservative | Ijaz Ahmed | 1465 | 43.4 | +9.4 | |
Labour | Susan Southworth | 1093 | 32.3 | -4.8 | |
BNP | Brian Jepson | 317 | 9.4 | -2.4 | |
Liberal Democrat | Paul Jenkins | 302 | 8.9 | -8.3 | |
Independent | Mike Harling | 104 | 3.1 | +3.1 | |
Independent | Bill Brison | 98 | 2.9 | +2.9 | |
Majority | 372 | 11.0 | |||
Turnout | 3,379 | ||||
Conservative gain from Labour | Swing | ||||
Party | Candidate | Votes | % | ± | |
---|---|---|---|---|---|
Liberal Democrat | Ann Garner | 1488 | 41.0 | +2.8 | |
Conservative | Jonathan Grosskopf | 1238 | 34.1 | +2.6 | |
Labour | Frank Adam | 906 | 24.9 | -5.7 | |
Majority | 250 | 6.9 | -2.8 | ||
Turnout | 3,632 | ||||
Liberal Democrat hold | Swing | ||||
Party | Candidate | Votes | % | ± | |
---|---|---|---|---|---|
Liberal Democrat | Mary DAlbert | 1308 | 43.4 | +0.4 | |
Labour | Kevin Lee | 1013 | 33.6 | +0.4 | |
Conservative | Raymond Soloman | 692 | 23.0 | -0.8 | |
Majority | 295 | 9.8 | -0.1 | ||
Turnout | 3,013 | ||||
Liberal Democrat gain from Labour | Swing | ||||
Party | Candidate | Votes | % | ± | |
---|---|---|---|---|---|
Conservative | Roger Brown | 1700 | 57.0 | +4.7 | |
Labour | Jane Lewis | 614 | 20.6 | -3.7 | |
Liberal Democrat | David Foss | 456 | 15.3 | +3.8 | |
BNP | Reg Norris | 210 | 7.0 | -4.5 | |
Majority | 1086 | 36.4 | +8.3 | ||
Turnout | 2,980 | ||||
Conservative hold | Swing | ||||
Party | Candidate | Votes | % | ± | |
---|---|---|---|---|---|
Conservative | Sam Cohen | 1821 | 56.3 | +9.8 | |
Labour | Ann Audin | 1165 | 36.0 | -10.6 | |
Liberal Democrat | Theo Tymczyna | 248 | 7.7 | +0.7 | |
Majority | 656 | 20.3 | |||
Turnout | 3,234 | ||||
Conservative hold | Swing | ||||
Elections to West Lindsey District Council were held on 4 May 2006. One third of the council was up for election and the Conservative party lost overall control of the council to no overall control. The Liberal Democrat party took overall control of the council two weeks later after a by-election victory in Lea ward.
The 2007 Thurrock Council election took place on 3 May 2007 to elect members of Thurrock Council in Essex, England. One third of the council was up for election and the Conservative party lost overall control of the council to no overall control.
Elections to Rossendale Borough Council were held on 1 May 2008. One third of the council was up for election and the Conservative party gained overall control of the council from no overall control. Overall turnout was up by one per cent from the last election in 2007 at 36.3%.
Elections for Coventry City Council were held on Thursday 1 May 2008. As the council is elected by thirds, one seat in each of the wards was up for election.
Elections to Stevenage Council were held on 1 May 2008. One third of the council was up for election and the Labour party stayed in overall control of the council.
Elections to Redditch Borough Council were held on 1 May 2008. One third of the council was up for election and the Conservative party gained overall control of the council from no overall control. Overall turnout was 33.2%.
Elections to Mole Valley Council were held on 1 May 2008. One third of the council was up for election and the Conservative party stayed in overall control of the council. Overall turnout was 46.5% a drop from the 47.2% seen in the 2007 election.
Elections to Rochford Council were held on 1 May 2008. One third of the council was up for election and the Conservative party stayed in overall control of the council.
Elections to Hyndburn Borough Council were held on 1 May 2008. One third of the council was up for election and the Conservative party stayed in overall control of the council. Overall turnout was 37.9%.
Elections to Burnley Borough Council in Lancashire, England were held on 1 May 2008. One third of the council was up for election and the Liberal Democrat party gained overall control of the council from no overall control.
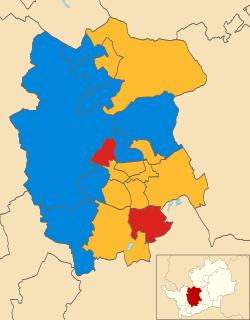
The 2006 St Albans City and District Council election took place on 4 May 2006 to elect members of St Albans District Council in Hertfordshire, England. One third of the council was up for election and the Liberal Democrats gained overall control of the council from no overall control.
Local elections were held in the United Kingdom on 3 May 1979. The results provided some source of comfort to the Labour Party (UK), who recovered some lost ground from local election reversals in previous years, despite losing the general election to the Conservative Party on the same day.
Elections to Broxtowe Borough Council were held on 5 May 2011 to elect all 44 members to the Council.
The 2008 Fareham Council election took place on 1 May 2008 to elect members of Fareham Borough Council in Hampshire, England. Half of the council was up for election and the Conservative party stayed in overall control of the council.
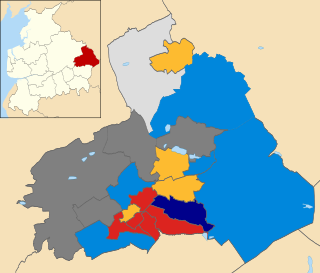
The 2008 Pendle Borough Council election took place on 1 May 2008 to elect members of Pendle Borough Council in Lancashire, England. One third of the council was up for election and the Liberal Democrats lost overall control of the council to no overall control.
The 2008 Sandwell Metropolitan Borough Council election took place on 1 May 2008 to elect members of Sandwell Metropolitan Borough Council in the West Midlands, England. One third of the council was up for election and the Labour party stayed in overall control of the council.
The 2008 Colchester Borough Council election took place on 1 May 2008 to elect members of Colchester Borough Council in Essex, England. One third of the council was up for election and the Conservative party lost overall control of the council to no overall control.
The 2008 Havant Borough Council election took place on 1 May 2008 to elect members of Havant Borough Council in Hampshire, England. One third of the council was up for election and the Conservative party stayed in overall control of the council.
The 2008 Castle Point Borough Council election took place on 1 May 2008 to elect members of Castle Point Borough Council in Essex, England. One third of the council was up for election and the Conservative party stayed in overall control of the council.
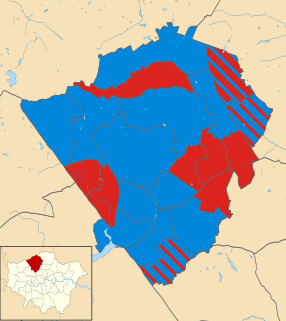
The 2018 Barnet Council election took place on 3 May 2018 to elect members of Barnet Borough Council in England. It took place on the same day as other local elections in 2018. In the last election, the Conservatives won control of the council with 32 seats, compared to 30 for Labour and 1 for the Liberal Democrats. On 15 March 2018, following the resignation of a Conservative councillor, the council was in a state of no overall control. The election on 3 May 2018 saw the Conservatives take back overall control with a majority of 13.