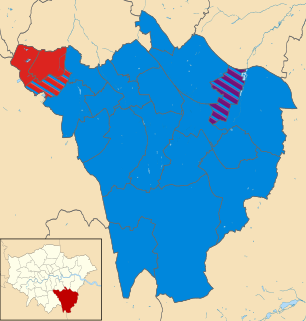
Elections to Bolton Metropolitan Borough Council were held on 22 May 2014, along with the European Parliament elections, 2014. One third of the council was up for election, with each successful candidate to serve a four-year term of office, expiring in 2018.
21 seats were contested, including 2 seats in the Horwich and Blackrod ward following the resignation of Labour councillor Lindsey Kell. The Labour Party won 13 seats, the Conservatives won 5 seats, UKIP won 2 seats and the Liberal Democrats won 1 seat.
The Labour Party is a centre-left political party in the United Kingdom which has been described as an alliance of social democrats, democratic socialists and trade unionists. The party's platform emphasises greater state intervention, social justice and strengthening workers' rights.
After the election, the total composition of the council was as follows:
The Conservative Party, officially the Conservative and Unionist Party, is a centre-right political party in the United Kingdom. Presently led by Theresa May, it has been the governing party since 2010. It presently has 314 Members of Parliament in the House of Commons, 249 members of the House of Lords, and 18 members of the European Parliament. It also has 31 Members of the Scottish Parliament, 12 members of the Welsh Assembly, eight members of the London Assembly and 9,008 local councillors. One of the major parties of UK politics, it has formed the government on 45 occasions, more than any other party.
The UK Independence Party is a hard Eurosceptic, right-wing political party in the United Kingdom. It currently has one representative in the House of Lords and seven Members of the European Parliament (MEPs). It has four Assembly Members (AMs) in the National Assembly for Wales and one member in the London Assembly. The party reached its greatest level of success in the mid-2010s, when it gained two Members of Parliament and was the largest UK party in the European Parliament.
The Liberal Democrats are a liberal political party in the United Kingdom. They presently have 11 Members of Parliament in the House of Commons, 96 members of the House of Lords, and one member of the European Parliament. They also have five Members of the Scottish Parliament and a member each in the Welsh Assembly and London Assembly. The party reached the height of its influence in the early 2010s, forming a junior partner in a coalition government from 2010 to 2015. It is presently led by Vince Cable.
Party | Seats | Gains | Losses | Net gain/loss | Seats % | Votes % | Votes | +/− | |
---|---|---|---|---|---|---|---|---|---|
Labour | 13 | 0 | 1 | -1 | 40.3 | 29,891 | -9.7 | ||
UKIP | 2 | 2 | 0 | +2 | 25.3 | 18,770 | +25.3 | ||
Conservative | 5 | 0 | 1 | -1 | 22.4 | 16,642 | -8.9 | ||
Liberal Democrat | 1 | 0 | 0 | +0 | 7.1 | 5,300 | -5.1 | ||
Green | 0 | 0 | 0 | 0 | 0 | 3.5 | 2,626 | -0.7 | |
English Democrat | 0 | 0 | 0 | 0 | 0 | 0.1 | 97 | -0.7 | |
BNP | 0 | 0 | 0 | 0 | 0 | 0.1 | 109 | -0.3 | |
Independent | 0 | 0 | 0 | 0 | 0 | 1.0 | 743 | -0.1 | |
Prior to the election the composition of the council was:
41 | 16 | 3 |
Labour | Conservative | LD |
After the election the composition of the council was:
40 | 15 | 3 | 2 |
Labour | Conservative | LD | U |
LD - Liberal Democrats
U - UKIP
Party | Candidate | Votes | % | ± | |
---|---|---|---|---|---|
Conservative | John Walsh | 1,481 | 36.3 | -10.2 | |
Labour | Stuart William Murray | 1,279 | 31.4 | -9.5 | |
UKIP | Harry Lamb | 1,039 | 25.5 | +25.5 | |
Green | Ben Deed | 182 | 4.5 | +4.5 | |
Liberal Democrat | Clive Richard Atty | 85 | 2.1 | -1.2 | |
Rejected ballots | 10 | 0.25 | |||
Majority | 202 | 5.0 | -0.6 | ||
Turnout | 4,076 | 40.44 | +5.0 | ||
Conservative hold | Swing | Conservative to UKIP 17.8 | |||
Party | Candidate | Votes | % | ± | |
---|---|---|---|---|---|
Conservative | Mudasir Dean | 1,585 | 43.7 | -13.3 | |
UKIP | Arthur Norris | 932 | 25.7 | +25.7 | |
Labour | Paul Fitzpatrick | 786 | 21.7 | -9.2 | |
Liberal Democrat | Gaby McDowall | 172 | 4.7 | -7.4 | |
Green | Daniel Bolton | 150 | 4.1 | +4.1 | |
Rejected ballots | 0 | 0.00 | |||
Majority | 653 | 18.0 | -8.1 | ||
Turnout | 3,625 | 40.95 | +4.6 | ||
Conservative hold | Swing | Conservative to UKIP 19.5 | |||
Party | Candidate | Votes | % | ± | |
---|---|---|---|---|---|
Labour | Lynda Jean Byrne | 1,490 | 43.0 | -16.8 | |
UKIP | Kathleen Mary Kavanagh | 1,217 | 35.1 | +35.1 | |
Conservative | Clara Heyes | 577 | 16.7 | -13.1 | |
Green | Laura Diggle | 115 | 3.3 | -3.6 | |
Liberal Democrat | Stephen Frederick Howarth | 51 | 1.5 | -2.0 | |
Rejected ballots | 13 | 0.38 | |||
Majority | 273 | 7.9 | -22.1 | ||
Turnout | 3,463 | 37.01 | +4.5 | ||
Labour hold | Swing | Labour to UKIP 29.5 | |||
Party | Candidate | Votes | % | ± | |
---|---|---|---|---|---|
Conservative | David Wells Greenhalgh | 2,312 | 53.6 | -5.4 | |
Labour | Collette Harkin | 957 | 22.2 | -10.3 | |
UKIP | Lynda Rosewell | 878 | 20.3 | +20.3 | |
Liberal Democrat | Chris Atty | 169 | 3.9 | -4.6 | |
Rejected ballots | 0 | 0.00 | |||
Majority | 1,355 | 31.4 | +4.9 | ||
Turnout | 4,316 | 40.75 | +5.1 | ||
Conservative hold | Swing | Labour to UKIP 15.3 | |||
Party | Candidate | Votes | % | ± | |
---|---|---|---|---|---|
Labour | Sufrana Bashir-Ismail | 2,363 | 60.0 | -14.9 | |
UKIP | George Stanley Bown | 826 | 21.0 | +21.0 | |
Conservative | Ryan Patrick Haslam | 456 | 11.6 | -4.9 | |
Liberal Democrat | Anne Sanders Warren | 148 | 3.8 | -4.8 | |
Independent | Pam Humphreys | 121 | 3.1 | +3.1 | |
Rejected ballots | 23 | 0.58 | |||
Majority | 1,537 | 39.3 | -19.1 | ||
Turnout | 3,937 | 39.31 | +7.4 | ||
Labour hold | Swing | Labour to UKIP 17.9 | |||
Party | Candidate | Votes | % | ± | |
---|---|---|---|---|---|
Labour | Noel Spencer | 1,454 | 48.9 | -18.3 | |
UKIP | Jeff Armstrong | 1,108 | 37.3 | +37.3 | |
Conservative | Aidan Meagan | 211 | 7.1 | -6.7 | |
Green | Trevor Bonfield | 115 | 3.9 | -7.4 | |
Liberal Democrat | Doug Bagnall | 73 | 2.5 | -5.2 | |
Rejected ballots | 12 | 0.40 | |||
Majority | 346 | 11.7 | -14.7 | ||
Turnout | 2,973 | 28.14 | +6.5 | ||
Labour hold | Swing | Labour to UKIP 27.8 | |||
Party | Candidate | Votes | % | ± | |
---|---|---|---|---|---|
Labour | Mohammed Ayub | 2,420 | 68.6 | -5.4 | |
UKIP | Dot Sexton | 505 | 14.3 | +14.3 | |
Conservative | Jay Patel | 338 | 9.6 | -0.8 | |
Green | David William Collins | 127 | 3.6 | -7.1 | |
Liberal Democrat | Rebekah Fairhurst | 64 | 1.8 | -3.0 | |
Independent | Joseph Thomas Holt | 54 | 1.5 | +1.5 | |
Rejected ballots | 21 | 0.60 | |||
Majority | 1,915 | 54.6 | -8.7 | ||
Turnout | 3,529 | 36.59 | +5.9 | ||
Labour hold | Swing | Labour to UKIP 9.8 | |||
Party | Candidate | Votes | % | ± | |
---|---|---|---|---|---|
Labour | Akhtar Zaman | 2,260 | 66.1 | -12.3 | |
UKIP | Leo Taylor | 607 | 17.8 | +17.8 | |
Conservative | Jolyon Horton Coombs | 223 | 6.5 | -2.9 | |
Green | Ian David McHugh | 173 | 5.1 | -3.3 | |
Liberal Democrat | Francine Godfrey | 95 | 2.8 | -1.0 | |
Independent | Andrew Mckenzie | 42 | 1.2 | +1.2 | |
Rejected ballots | 17 | 0.50 | |||
Majority | 1,653 | 48.6 | -20.4 | ||
Turnout | 3,417 | 38.32 | +6.8 | ||
Labour hold | Swing | Labour to UKIP 15.0 | |||
Party | Candidate | Votes | % | ± | |
---|---|---|---|---|---|
Labour | Mike Francis | 1,713 | 56.7 | -16.3 | |
UKIP | Geoff Hamlett | 726 | 24.0 | +24.0 | |
Conservative | Rob Tyler | 366 | 12.1 | -5.1 | |
Green | Kathy Sykes | 115 | 3.8 | +3.8 | |
Liberal Democrat | Wendy Connor | 86 | 2.8 | -7.0 | |
Rejected ballots | 13 | 0.43 | |||
Majority | 987 | 32.8 | -23.1 | ||
Turnout | 3,019 | 31.40 | +7.7 | ||
Labour hold | Swing | Labour to UKIP 20.1 | |||
Party | Candidate | Votes | % | ± | |
---|---|---|---|---|---|
Conservative | Colin Shaw | 2,237 | 47.5 | -12.0 | |
Labour Co-op | John William Gillatt | 1,154 | 24.5 | -4.3 | |
UKIP | Stephen Thomas | 933 | 19.8 | +19.8 | |
Liberal Democrat | Christine Joyce Macpherson | 196 | 4.2 | -0.9 | |
Green | Hannah Louise Middleshaw | 179 | 3.8 | -2.8 | |
Rejected ballots | 14 | 0.30 | |||
Majority | 1,083 | 23.0 | -7.7 | ||
Turnout | 4,713 | 44.58 | +5.5 | ||
Conservative hold | Swing | Conservative to UKIP 15.9 | |||
Two seats were up for election. Stephen Pickup will have to stand again for election in 2016 and Alan Bury in 2018.
Party | Candidate | Votes | % | ± | |
---|---|---|---|---|---|
Labour | Alan Bury | 1,313 | 21.5 | ||
Labour | Stephen Pickup | 1,310 | 21.5 | ||
UKIP | Bob Horsefield | 1,147 | 18.8 | ||
Conservative | Carol Ann Forshaw | 850 | 13.9 | ||
Conservative | Daniel Clifford Haslam | 708 | 11.6 | ||
Green | Keith Michael Cocker | 401 | 6.6 | ||
Liberal Democrat | Lynne McCartin | 201 | 3.3 | ||
Liberal Democrat | Lynn Natalie Rock | 159 | 2.6 | ||
Rejected ballots | 8 | 0.13 | |||
Majority | 3 | ||||
Turnout | 3,048 | 31.39 | +0.9 | ||
Labour hold | |||||
Labour hold | |||||
Party | Candidate | Votes | % | ± | |
---|---|---|---|---|---|
Labour | Kevin Peter McKeon | 1,324 | 35.4 | -8.2 | |
UKIP | Peter McGeehan | 888 | 23.7 | +23.7 | |
Conservative | Anne Barbara Galloway | 743 | 19.9 | +1.2 | |
Liberal Democrat | Stephen Michael Rock | 573 | 15.3 | -4.1 | |
Green | Rod Riesco | 203 | 5.4 | -4.5 | |
Rejected ballots | 9 | 0.24 | |||
Majority | 436 | 11.7 | -12.6 | ||
Turnout | 3,740 | 37.93 | +3.0 | ||
Labour hold | Swing | Labour to UKIP 15.9 | |||
Party | Candidate | Votes | % | ± | |
---|---|---|---|---|---|
UKIP | Diane Parkinson | 1,291 | 33.7 | +33.7 | |
Conservative | Andy Morgan | 1,150 | 30.0 | -12.5 | |
Labour | Shafaqat Shaikh | 1,140 | 29.8 | -12.7 | |
Green | James Tomkinson | 162 | 4.2 | -6.6 | |
Liberal Democrat | David Charles Cooper | 69 | 1.8 | -0.3 | |
Rejected ballots | 15 | 0.39 | |||
Majority | 141 | 3.7 | |||
Turnout | 3,827 | 39.24 | +8.5 | ||
UKIP gain from Conservative | Swing | Conservative to UKIP 23.1 | |||
Party | Candidate | Votes | % | ± | |
---|---|---|---|---|---|
Labour | Derek Burrows | 1,139 | 35.7 | -19.4 | |
UKIP | Mark Joseph Cunningham | 1,096 | 34.4 | +34.4 | |
Liberal Democrat | Margaret Patricia Rothwell | 348 | 10.9 | -23.0 | |
Independent | Simon Paul Colley | 309 | 9.7 | +9.7 | |
Conservative | Sandra Macneill | 278 | 8.7 | -2.3 | |
Rejected ballots | 18 | 0.56 | |||
Majority | 43 | 1.3 | -19.8 | ||
Turnout | 3,188 | 30.68 | +4.7 | ||
Labour hold | Swing | Labour to UKIP 26.9 | |||
Party | Candidate | Votes | % | ± | |
---|---|---|---|---|---|
UKIP | Paul Richardson | 1,255 | 33.2 | +33.2 | |
Labour | Maureen Connell | 1,051 | 27.8 | -16.5 | |
Liberal Democrat | Eric John Hyde | 661 | 17.5 | -3.5 | |
Conservative | Rees Gibbon | 657 | 17.4 | -9.1 | |
Green | Alwynne Cartmell | 147 | 3.9 | -4.3 | |
Rejected ballots | 7 | 0.19 | |||
Majority | 204 | 5.4 | |||
Turnout | 3,778 | 39.51 | +3.5 | ||
UKIP gain from Labour | Swing | Labour to UKIP 24.8 | |||
Party | Candidate | Votes | % | ± | |
---|---|---|---|---|---|
Labour | Ismail Ibrahim | 2,876 | 72.5 | -6.0 | |
UKIP | Geoffrey David Kay | 492 | 12.4 | +12.4 | |
Conservative | Jack Heyes | 317 | 8.0 | -1.6 | |
Green | Alan Johnson | 200 | 5.0 | -4.0 | |
Liberal Democrat | Jaleh Salari | 66 | 1.7 | -1.2 | |
Rejected ballots | 16 | 0.40 | |||
Majority | 2,384 | 60.3 | -8.5 | ||
Turnout | 3,967 | 39.77 | +9.0 | ||
Labour hold | Swing | Labour to UKIP 9.2 | |||
Party | Candidate | Votes | % | ± | |
---|---|---|---|---|---|
Liberal Democrat | Andrew Martin | 1,674 | 37.5 | -3.7 | |
Labour | Kevin Patrick Morris | 1,329 | 29.8 | -10.2 | |
UKIP | Aaron Hepworth | 876 | 19.6 | +19.6 | |
Conservative | Christine Flanigan | 429 | 9.6 | -4.3 | |
Green | Richard Alexander Middleshaw | 139 | 3.1 | -1.9 | |
Rejected ballots | 16 | 0.36 | |||
Majority | 345 | 7.7 | +6.5 | ||
Turnout | 4,463 | 45.44 | +6.0 | ||
Liberal Democrat hold | Swing | Labour to UKIP 14.9 | |||
Party | Candidate | Votes | % | ± | |
---|---|---|---|---|---|
Labour | Nick Peel | 1,399 | 43.3 | -19.7 | |
UKIP | Derek Fisher | 1,053 | 32.6 | +32.6 | |
Conservative | Zoe Jennifer Catherine Kirk-Robinson | 486 | 15.1 | -8.1 | |
BNP | Dorothee Sayers | 109 | 3.4 | -6.4 | |
Green | Hafsa Patel | 91 | 2.8 | +2.8 | |
Liberal Democrat | Paul Anthony Harasiwka | 66 | 2.0 | -2.1 | |
Left Unity | Eric Thomas Hyland | 14 | 0.4 | +0.4 | |
Rejected ballots | 10 | 0.31 | |||
Majority | 346 | 10.7 | -29.1 | ||
Turnout | 3,228 | 36.30 | +6.2 | ||
Labour hold | Swing | Labour to UKIP 26.5 | |||
Party | Candidate | Votes | % | ± | |
---|---|---|---|---|---|
Conservative | Martyn Andrew Cox | 1,424 | 34.0 | -1.1 | |
Labour | Anne Graham | 1,278 | 30.5 | -15.9 | |
UKIP | Joan Johnson | 984 | 23.5 | +23.5 | |
Independent | Jack Speight | 203 | 4.8 | -6.8 | |
Liberal Democrat | Derek John Gradwell | 163 | 3.9 | -3.0 | |
Green | Heather Rylance | 127 | 3.0 | +3.0 | |
Rejected ballots | 8 | 0.19 | |||
Majority | 146 | 3.5 | |||
Turnout | 4,187 | 38.24 | +5.2 | ||
Conservative hold | Swing | Labour to UKIP 19.7 | |||
Party | Candidate | Votes | % | ± | |
---|---|---|---|---|---|
Labour | Kevin Jones | 1,268 | 39.3 | -3.1 | |
UKIP | Les Wareing | 917 | 28.4 | +28.4 | |
Conservative | Stephen Wallen | 562 | 17.4 | +4.7 | |
Liberal Democrat | David Arthur Wilkinson | 361 | 11.2 | -23.6 | |
English Democrat | Derek John Bullock | 97 | 3.0 | -7.1 | |
Rejected ballots | 19 | 0.59 | |||
Majority | 351 | 10.9 | +3.3 | ||
Turnout | 3,224 | 33.60 | +2.8 | ||
Labour hold | Swing | Lib Dem to UKIP 26.0 | |||
The 1998 Bolton Metropolitan Borough Council election took place on 7 May 1998 to elect members of Bolton Metropolitan Borough Council in Greater Manchester, England. One third of the council was up for election and the Labour party kept overall control of the council.
Elections to Bolton Metropolitan Borough Council were held on 6 May 1999. One third of the council was up for election and the Labour party kept overall control of the council.
Elections to Bolton Metropolitan Borough Council were held on 4 May 2000. One third of the council was up for election and the Labour party kept overall control of the council.
Elections to Bolton Metropolitan Borough Council were held on 2 May 2002. One third of the council was up for election and the Labour party kept overall control of the council.
Elections to Bolton Metropolitan Borough Council was held on 6 May 2010, on the same day as the General Election which led to a much higher turnout than in recent years. One third of the council was up for election and the council stayed under no overall control.
Elections to Bolton Metropolitan Borough Council were held on 5 May 2011, along with the United Kingdom Alternative Vote referendum, 2011. One third of the council was up for election, with each successful candidate to serve a four-year term of office, expiring in 2015.
Elections to Bolton Metropolitan Borough Council were held on 3 May 2012. One third of the council was up for election, with each successful candidate to serve a four-year term of office, expiring in 2016.
The 1990 Bolton Metropolitan Borough Council election took place on 4 May 1990 to elect members of Bolton Metropolitan Borough Council in Greater Manchester, England. One third of the council was up for election and the Labour party kept overall control of the council
The 1992 Bolton Metropolitan Borough Council election took place on 7 May 1992 to elect members of Bolton Metropolitan Borough Council in Greater Manchester, England. One third of the council was up for election and the Labour party kept overall control of the council.
The 1994 Bolton Metropolitan Borough Council election took place on 5 May 1994 to elect members of Bolton Metropolitan Borough Council in Greater Manchester, England. One third of the council was up for election and the Labour party kept overall control of the council.
Elections to Bromley Council were held on 22 May 2014.
The 2014 Basingstoke and Deane Borough Council election took place on 22 May 2014 to elect members of Basingstoke and Deane Borough Council in England. This was on the same day as other local elections.
The 2014 Havant Borough Council election took place on 22 May 2014 to elect members of Havant Borough Council in Hampshire, England. One third of the council was up for election and the Conservative party stayed in overall control of the council.
The 2015 Bolton Metropolitan Borough Council election were held on 7 May 2015 to elect members of Bolton Metropolitan Borough Council in Greater Manchester, England. This took place on the same day as other local elections
The 2016 Bolton Metropolitan Borough Council election took place on 5 May 2016 to elect members of Bolton Metropolitan Borough Council in Greater Manchester, England. This was on the same day as other local elections.
The 2018 Plymouth City Council election took place on 3 May 2018 to elect members of Plymouth City Council in England. The election was won by the Labour Party, who gained enough seats to achieve an overall majority and took control of the council.
Elections to Cannock Chase District Council took place on 3 May 2018 on the same day as other local elections in England. A third of the council was up for election, meaning a total of 13 councillors were elected from all but two of the council's wards.
The 2018 City of Bradford Metropolitan District Council took place on 3 May 2018 to elect members of Bradford District Council in England. This was on the same day as other local elections. One councillor was elected in each ward for a four-year term so the councillors elected in 2018 last stood for election in 2014. Each ward is represented by three councillors, the election of which is staggered, so only one third of the councillors were elected in this election. Before the election there was a Labour majority and afterwards Labour had increased their majority.
The 2018 Bolton Metropolitan Borough Council election took place on 3 May 2018 to elect members of Bolton Council in Greater Manchester, England. This was on the same day as other local elections. The Labour Party retained overall control of the Council with a majority of 1.
The 2018 Sunderland City Council election took place on 3 May 2018 to elect members of Sunderland City Council in England. The election took place on the same day as other local elections.