| |||||||
| |||||||
2016 local election results in Wigan. Independent |
The 2016 Wigan Metropolitan Borough Council election took place on 5 May 2016 to elect members of Wigan Metropolitan Borough Council in England. [1] This was on the same day as other local elections.
The Wigan Metropolitan Borough Council is the local authority for the Metropolitan Borough of Wigan in the United Kingdom. It consists of 75 Councillors with one-third being elected every three years in four. The borough is separated into 25 wards. Councillors are democratically accountable to the ward they are elected to represent. Each ward is represented on the council by three council members.
Party | Seats won at Election | Total Seats on Council [2] | ± |
---|---|---|---|
Labour Party | 18 | 65 | |
Conservative Party | 3 | 5 | |
Independents | 3 | 5 |
Party | Number |
---|---|
Labour Party (UK) | 25 |
Conservative Party (UK) | 25 |
UK Independence Party | 18 |
Independent politician | 10 |
Green Party of England and Wales | 9 |
Liberal Democrats (UK) | 7 |
TUSC | 1 |
Party | Candidate | Votes | % | ± | |
---|---|---|---|---|---|
Independent Network | Jamie Hodgkinson | 1838 | 51.2 | ||
Labour | Elnur Yusifzade | 969 | 27 | ||
UKIP | Quinton John Smith | 567 | 15.8 | ||
Conservative | Brian Howard Lobell | 209 | 5.82 | ||
Rejected ballots | 8 | 0.18 | |||
Majority | 869 | 24.2 | |||
Turnout | 3590 | 34.19 |
Party | Candidate | Votes | % | ± | |
---|---|---|---|---|---|
Labour | Martyn Smethurst | 1495 | 58.2 | ||
UKIP | Jim Carmichael | 868 | 33.8 | ||
Conservative | Claire Houlton | 201 | 7.82 | ||
Rejected ballots | 5 | 0.19 | |||
Majority | 627 | 24.4 | |||
Turnout | 2569 | 25.5 |
Party | Candidate | Votes | % | ± | |
---|---|---|---|---|---|
Labour | Bill Clarke | 1204 | 46.45 | ||
Independent | Richard Charles Aylett | 616 | 23.77 | ||
UKIP | Stuart Thomas Plimley | 426 | 16.44 | ||
Conservative | Marie Winstanley | 253 | 9.76 | ||
Liberal Democrat | 89 | 3.43 | |||
Rejected ballots | 4 | 0.15 | |||
Majority | 588 | 22.68 | |||
Turnout | 2592 | 29.57 |
Party | Candidate | Votes | % | ± | |
---|---|---|---|---|---|
Independent | Steve Jones | 1200 | 40.94 | ||
Labour | David Hurst | 1123 | 38.31 | ||
UKIP | Thomas Keith Miller | 438 | 14.94 | ||
Conservative | Margaret Mary Winstanley | 161 | 5.49 | ||
Rejected ballots | 9 | 0.3 | |||
Majority | 77 | 2.63 | |||
Turnout | 2931 | 33.56 |
Party | Candidate | Votes | % | ± | |
---|---|---|---|---|---|
Labour | Paul John Blay | 1413 | 51.01 | ||
Independent | Jim Ellis | 1040 | 37.55 | ||
Conservative | David Marcus John Ollerton | 153 | 5.52 | ||
Green | Paul Ravenall | 79 | 2.85 | ||
Liberal Democrat | John Skipworth | 76 | 2.74 | ||
Rejected ballots | 9 | 0.32 | |||
Majority | 373 | 13.47 | |||
Turnout | 2770 | 29.38 |
Party | Candidate | Votes | % | ± | |
---|---|---|---|---|---|
Independent | Bob Brierley | 1480 | 57.08 | ||
Labour | Eileen Winifred Rigby | 820 | 31.62 | ||
Liberal Democrat | John Thomason | 159 | 6.13 | ||
Conservative | Gerard Joseph Houlton | 126 | 4.86 | ||
Rejected ballots | 8 | 0.3 | |||
Majority | 660 | 25.45 | |||
Turnout | 2593 | 27.35 |
Party | Candidate | Votes | % | ± | |
---|---|---|---|---|---|
Conservative | Michael William Winstanley | 1410 | 43 | ||
Labour | Joy Susan Bradley | 1333 | 40.65 | ||
Orrell Independents | Paula Lynn Boyham | 221 | 6.74 | ||
Green | Denise Capstick | 190 | 5.8 | ||
Liberal Democrat | Louise Catherine Bowe | 110 | 3.35 | ||
Rejected ballots | 15 | 0.46 | |||
Majority | 77 | 2.35 | |||
Turnout | 3279 | 34.85 |
Party | Candidate | Votes | % | ± | |
---|---|---|---|---|---|
Labour | Paul Terence Kenny | 1350 | 48 | ||
UKIP | Andrew Francis Collinson | 890 | 31.7 | ||
Conservative | Jean Margaret Peet | 334 | 11.9 | ||
Green | Steven Charles Heyes | 229 | 8.16 | ||
Rejected ballots | 5 | 0.18 | |||
Majority | 460 | 16.4 | |||
Turnout | 2808 | 31.5 |
Party | Candidate | Votes | % | ± | |
---|---|---|---|---|---|
Labour | Philip Myles Kelly | 1449 | 59.8 | ||
UKIP | Maureen McCoy | 699 | 28.84 | ||
Conservative | Susan Atherton | 221 | 9.12 | ||
Rejected ballots | 5 | 0.2 | |||
Majority | 800 | 33 | |||
Turnout | 2424 | 27.65 |
Party | Candidate | Votes | % | ± | |
---|---|---|---|---|---|
Labour | Joanne Marie Platt | 1548 | 51.3 | ||
Conservative | Richard Allan Short | 739 | 24.5 | ||
UKIP | Steve Mills | 731 | 24.2 | ||
Rejected ballots | 0 | 0 | |||
Majority | 809 | 26.8 | |||
Turnout | 3018 | 32.95 |
Party | Candidate | Votes | % | ± | |
---|---|---|---|---|---|
Labour | John Harding | 1067 | 46.17 | ||
Independent (politician) | Stuart Andrew Gerrard | 533 | 23.1 | ||
UKIP | Luke Greenhalgh | 446 | 19.3 | ||
Conservative | Paul Lambert Fairhurst | 207 | 8.96 | ||
Liberal Democrat | Lorraine Gillon | 49 | 2.12 | ||
Rejected ballots | 9 | 0.4 | |||
Majority | 534 | 23.12 | |||
Turnout | 2311 | 28.15 |
Party | Candidate | Votes | % | ± | |
---|---|---|---|---|---|
Labour | Yvonne Marie Klieve | 1675 | 70 | ||
UKIP | Peter Graham Kearns | 540 | 22.5 | ||
Conservative | Toby Joseph Hewitt | 170 | 7.1 | ||
Rejected ballots | 11 | 0.46 | |||
Majority | 1135 | 47.4 | |||
Turnout | 2396 | 27.78 |
Party | Candidate | Votes | % | ± | |
---|---|---|---|---|---|
Labour | Keith Cunliffe | 1513 | 67.18 | ||
Conservative | Richard Byrom Houlton | 446 | 19.8 | ||
Liberal Democrat | John Dowsett | 275 | 12.2change= | ||
Rejected ballots | 18 | 0.8 | |||
Majority | 1067 | 47.4 | |||
Turnout | 2252 | 25.53 |
Party | Candidate | Votes | % | ± | |
---|---|---|---|---|---|
Labour | Charles Rigby | 1773 | 55.48 | ||
UKIP | Russell Eddison | 913 | 28.6 | ||
Conservative | Denise Alison Young | 503 | 15.74 | ||
Rejected ballots | 7 | 0.22 | |||
Majority | 860 | 26.91 | |||
Turnout | 3196 | 31.61 |
Party | Candidate | Votes | % | ± | |
---|---|---|---|---|---|
Labour | Sue Greensmith | 1610 | 60 | ||
UKIP | Jayson Lomax-Hargreaves | 738 | 27.5 | ||
Conservative | Andrew John Oxley | 205 | 7.64 | ||
Green | Neil Hancox | 129 | 4.8 | ||
Rejected ballots | 2 | 0.08 | |||
Majority | 872 | 30.09 | |||
Turnout | 2684 | 26.84 |
Party | Candidate | Votes | % | ± | |
---|---|---|---|---|---|
Conservative | James Nelson Grundy | 2327 | 60.84 | ||
Labour | Garry Lloyd | 1110 | 29 | ||
UKIP | Stephen Thomas Darragh | 278 | 7.27 | ||
Green | Harry John Alderson Snape | 104 | 2.7 | ||
Rejected ballots | 6 | 0.16 | |||
Majority | 1217 | 31.82 | |||
Turnout | 3825 | 40.28 |
Party | Candidate | Votes | % | ± | |
---|---|---|---|---|---|
Labour | Nazia Rehman | 1235 | 38.4 | ||
UKIP | Matthew Robert James | 978 | 30.37 | ||
Independent | Norman Alec Bradbury | 572 | 17.8 | ||
Conservative | David John Stirzaker | 421 | 13.1 | ||
Rejected ballots | 14 | 0.43 | |||
Majority | 257 | 8 | |||
Turnout | 3220 | 31.71 |
Party | Candidate | Votes | % | ± | |
---|---|---|---|---|---|
Labour | John Hilton | 1,805 | 52.8 | ||
UKIP | Mark Andrew Bradley | 985 | 28.8 | ||
Conservative | Allan Atherton | 456 | 13.3 | ||
Liberal Democrat | Freda Janet Graham | 175 | 5.1 | ||
Majority | 820 | 24.0 | |||
Turnout | 3,421 | 35.1 | |||
Labour hold | Swing |
Party | Candidate | Votes | % | ± | |
---|---|---|---|---|---|
Labour | Patricia Draper | 1,803 | 84.1 | ||
Conservative | Margaret Atherton | 340 | 15.9 | ||
Majority | 1,463 | 68.3 | |||
Turnout | 2,143 | 23.3 | |||
Labour hold | Swing |
Party | Candidate | Votes | % | ± | |
---|---|---|---|---|---|
Labour | David Trevor Molyneux | 1,545 | 65.8 | ||
UKIP | Stephen Winstanley | 671 | 28.6 | ||
Conservative | Judith Atherton | 132 | 5.6 | ||
Majority | 874 | 37.2 | |||
Turnout | 2,348 | 27.3 | |||
Labour hold | Swing |
Party | Candidate | Votes | % | ± | |
---|---|---|---|---|---|
Labour | Jeanette Prescott | 1,631 | 69.0 | ||
UKIP | Peter Owen Wheatley-Smith | 502 | 21.2 | ||
Conservative | Daniel Andrew Whitehouse | 137 | 5.8 | ||
Green | Norma Stout | 93 | 3.9 | ||
Majority | 1,129 | 47.7 | |||
Turnout | 2,363 | 24.9 | |||
Labour hold | Swing |
Party | Candidate | Votes | % | ± | |
---|---|---|---|---|---|
Labour | Damian Edwardson | 1,239 | 40.0 | ||
Shevington Independents | Janet Brown | 813 | 26.3 | ||
UKIP | Arnold Jefferson Foster | 584 | 18.9 | ||
Conservative | Jack Joseph Vickery | 349 | 11.3 | ||
Green | Joseph Robert Rylance | 112 | 3.6 | ||
Majority | 426 | 13.8 | |||
Turnout | 3,097 | 34.2 | |||
Labour hold | Swing |
Party | Candidate | Votes | % | ± | |
---|---|---|---|---|---|
Conservative | Raymond Whittingham | 1,276 | 32.4 | ||
Standish Independents | Gareth William Fairhurst | 1,063 | 27.0 | ||
Labour | Debbie Parkinson | 968 | 24.6 | ||
UKIP | Ian Adamczyk | 579 | 14.7 | ||
TUSC | Sharon Holden | 54 | 1.4 | ||
Majority | 213 | 5.4 | |||
Turnout | 3,940 | 41.4 | |||
Conservative gain from Standish Independents | Swing | ||||
Party | Candidate | Votes | % | ± | |
---|---|---|---|---|---|
Labour | Lawrence Hunt | 1,745 | 55.9 | ||
Conservative | Susan Vickery | 845 | 27.1 | ||
Green | William John Patterson | 311 | 10.0 | ||
Liberal Democrat | Stuart David Thomas | 221 | 7.0 | ||
Majority | 900 | 28.8 | |||
Turnout | 3,122 | 34.7 | |||
Labour hold | Swing |
Party | Candidate | Votes | % | ± | |
---|---|---|---|---|---|
Labour | Terence William Halliwell | 2,090 | 80.8 | ||
Conservative | Jamie Vickery | 497 | 19.2 | ||
Majority | 1,593 | 61.6 | |||
Turnout | 2,587 | 27.9 | |||
Labour hold | Swing |
Party | Candidate | Votes | % | ± | |
---|---|---|---|---|---|
Labour | Paula Anne Wakefield | 773 | 45.9 | ||
Conservative | David John Stirzaker | 604 | 35.9 | ||
UKIP | Allan Hogg | 185 | 11.0 | ||
Liberal Democrat | Stuart David Thomas | 73 | 4.3 | ||
Green | Andy Prentice | 46 | 2.7 | ||
Majority | 169 | 10.0 | |||
Turnout | 1,684 | 17.5 | |||
Labour hold | Swing |
Party | Candidate | Votes | % | ± | |
---|---|---|---|---|---|
Labour | Marlaine Teresa Whitham | 765 | 43.4 | ||
Independent | Janet Brown | 552 | 31.3 | ||
Conservative | Callum David Owen Chadwick | 402 | 22.8 | ||
Green | Joseph Robert Rylance | 30 | 1.7 | ||
Liberal Democrat | Joshua Michael Hindle | 15 | 0.9 | ||
Majority | 213 | 12.1 | |||
Turnout | 1,764 | 18.7 | |||
Labour hold | Swing |
The Metropolitan Borough of Wigan is a metropolitan borough of Greater Manchester, in North West England. It is named after its largest component town and former county borough, Wigan and includes the towns and villages of Leigh, part of Ashton-in-Makerfield, Ince-in-Makerfield, Hindley, Orrell, Standish, Atherton, Tyldesley, Golborne, Lowton, Billinge, Astley, Haigh and Aspull. The borough was formed in 1974 and is an amalgamation of several former local government districts and parishes. The borough has three civil parishes and lies directly to the west of the City of Salford and southwest of the Metropolitan Borough of Bolton. The local authority is Wigan Metropolitan Borough Council.
Torbay is a unitary authority in Devon, England. Until 1 April 1998 it was a non-metropolitan district. Since 2005 it has also had a directly elected mayor.
One third of Wigan Metropolitan Borough Council in Greater Manchester, England is elected each year, followed by one year without election. Since the last boundary changes in 2004, 75 councillors have been elected from 25 wards.
Darlington is a unitary authority in County Durham, England. Until 1 April 1997 it was a non-metropolitan district.
One third of Wirral Metropolitan Borough Council in Merseyside, England is elected each year, followed by one year without election. Since the last boundary changes in 2004, 66 councillors have been elected from 22 wards.
Hartlepool is a unitary authority in County Durham, England. Until 1 April 1996 it was a non-metropolitan district in Cleveland. Between 2002 and 2013 it also had a directly elected mayor.
All seats of the Rotherham Metropolitan Borough Council in South Yorkshire, England are elected every four years. Since the last boundary changes in 2004, 63 councillors have been elected from 21 wards.
Redcar and Cleveland is a unitary authority in North Yorkshire, England. Until 1 April 1996 it was a non-metropolitan district in Cleveland.
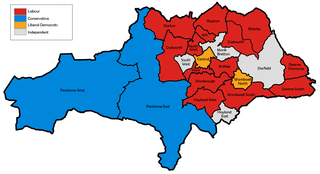
The 2000 Barnsley Metropolitan Borough Council election took place on 4 May 2000 to elect members of Barnsley Metropolitan Borough Council in South Yorkshire, England. Prior to the election, Labour has suffered a by-election loss in South West and two defections to Independent. One third of the council was up for election and the Labour party stayed in overall control of the council.
The 2002 Barnsley Metropolitan Borough Council election took place on 2 May 2002 to elect members of Barnsley Metropolitan Borough Council in South Yorkshire, England. One third of the council was up for election and the Labour party stayed in overall control of the council.
The 2003 Barnsley Metropolitan Borough Council election took place on 1 May 2003 to elect members of Barnsley Metropolitan Borough Council in South Yorkshire, England. One third of the council was up for election and the Labour party stayed in overall control of the council.
The 2014 Wigan Metropolitan Borough Council election took place on 22 May 2014 to elect members of Wigan Metropolitan Borough Council in England. This was on the same day as other local elections.
The 2015 Wigan Metropolitan Borough Council election took place on 7 May 2015 to elect members of Wigan Metropolitan Borough Council in England. This was on the same day as other local elections and the general election.
Council elections in England were held on Thursday 3 May 2018. Elections were held in all 32 London boroughs, 34 metropolitan boroughs, 67 district and borough councils and 17 unitary authorities. There were also direct elections for the mayoralties of Hackney, Lewisham, Newham, Tower Hamlets and Watford.
The 2018 Wigan Metropolitan Borough Council election took place on 3 May 2018 to elect members of Wigan Metropolitan Borough Council in England. This was on the same day as other local elections.
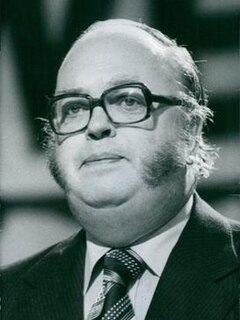
The 1975 Wirral Metropolitan Borough Council election took place on 1 May 1975 to elect members of Wirral Metropolitan Borough Council in England. This election was held on the same day as other local elections.
The 2019 Wigan Metropolitan Borough Council election is scheduled to be held on Thursday 2 May 2019 to elect members of Wigan Metropolitan Borough Council in England. This will be on the same day as other local elections.
The 1982 Wirral Metropolitan Borough Council election took place on 6 May 1982 to elect members of Wirral Metropolitan Borough Council in England. This election was held on the same day as other local elections.
The 1983 Wirral Metropolitan Borough Council election took place on 5 May 1983 to elect members of Wirral Metropolitan Borough Council in England. This election was held on the same day as other local elections.
The 1984 Wirral Metropolitan Borough Council election took place on 3 May 1984 to elect members of Wirral Metropolitan Borough Council in England. This election was held on the same day as other local elections.
This Elections in England related article is a stub. You can help Wikipedia by expanding it. |