Trafford Metropolitan Borough Council election, 2003

Last updated

Elections to Trafford Council were held on 1 May 2003. One third of the council was up for election, with each successful candidate to serve a one-year term of office, expiring in 2004 due to the boundary changes and 'all-out' elections due to take place that year. The Labour Party lost overall control of the council, to no overall control. [1] Overall turnout was 52.3%.

Trafford Metropolitan borough in England

Trafford is a metropolitan borough of Greater Manchester, England, with an estimated population of 235,493 in 2017. It covers 41 square miles (106 km2) and includes the areas of Old Trafford, Stretford, Urmston, Altrincham, Partington and Sale. The borough was formed in 1974 as a merger of the metropolitan boroughs of Altrincham, Sale, and Stretford, the urban districts of Bowdon, Hale and Urmston and part of Bucklow Rural District. The River Mersey flows through the borough, separating North Trafford from South Trafford, and the historic counties of Lancashire and Cheshire.

The Labour Party is a centre-left political party in the United Kingdom which has been described as an alliance of social democrats, democratic socialists and trade unionists. The party's platform emphasises greater state intervention, social justice and strengthening workers' rights.

In the context of local authorities in the United Kingdom, the term no overall control refers to a situation in which no single political group achieves a majority of seats; and is analogous to a hung parliament. Of the 310 councils who had members up for election in the 2007 local elections, 85 resulted in a NOC administration.

Contents

After the election, the composition of the council was as follows:

PartySeats  +/-  
Labour 31 -1
Conservative 29 +1
Liberal Democrat 3 0
Labour lose to NOC

Summary

Trafford Local Election Result 2003
PartySeatsGainsLossesNet gain/lossSeats %Votes %Votes+/−
  Conservative 10 1 0 +1 47.6 45.9 38,792 +0.8%
  Labour 10 0 1 -1 47.6 35.7 30,192 -5.5%
  Liberal Democrat 1 0 0 0 4.8 13.5 11,371 +1.5%
  Green 0 0 0 0 0 4.4 3,688 +3.6%
  Independent 0 0 0 0 0 0.5 398 -0.3%
  Socialist Labour 0 0 0 0 0 0.1 81 -0.1%

Ward results

Altrincham
PartyCandidateVotes%±
Conservative Alexander Williams2,63458.7+4.2
Labour David Armstrong 1,212 27.0 -5.0
Liberal Democrat Roger Legge 641 14.3 +0.8
Majority 1,422 31.7 +9.2
Turnout 4,487 52.0 -0.8
Conservative hold Swing
Bowdon
PartyCandidateVotes%±
Conservative Stephanie Poole*3,47565.7+1.8
Liberal Democrat Christopher Gaskill 870 16.5 +1.9
Labour Helen Walsh 535 10.1 -4.6
Green Bridget Green 408 7.7 +0.8
Majority 2,605 49.2 +0.0
Turnout 5,288 57.1 +0.4
Conservative hold Swing
Broadheath
PartyCandidateVotes%±
Conservative Brenda Houraghan2,27151.5+9.6
Labour Ian Golding 2,137 48.5 -1.4
Majority 134 3.0
Turnout 4,408 51.9 -5.4
Conservative gain from Labour Swing
Brooklands
PartyCandidateVotes%±
Conservative Pamela Dixon*2,24747.6-9.0
Liberal Democrat Kenneth Clarke 1,149 24.3 +6.8
Labour Joanne Bennett 1,083 22.9 -3.0
Green Stephen Parker 245 5.2 +5.2
Majority 1,098 23.3 -7.4
Turnout 4,724 61.3 +7.0
Conservative hold Swing
Bucklow
PartyCandidateVotes%±
Labour Ian Platt*1,74974.7-0.6
Conservative James Davies 592 25.3 +0.6
Majority 1,157 49.4 -1.2
Turnout 2,341 41.3 +0.3
Labour hold Swing
Clifford
PartyCandidateVotes%±
Labour Eunice Stennett*1,71455.3-20.5
Green Anne Power 854 27.6 +17.7
Conservative Roderick Allan 532 17.2 +2.8
Majority 860 27.7 -33.7
Turnout 3,100 41.9 +1.9
Labour hold Swing
Davyhulme East
PartyCandidateVotes%±
Conservative Eric Crosbie*2,33162.1+4.7
Labour Nigel Roberts 1,425 37.9 -4.8
Majority 906 24.2 +9.5
Turnout 3,756 53.8 +1.6
Conservative hold Swing
Davyhulme West
PartyCandidateVotes%±
Conservative John Reilly*2,52560.1+8.4
Labour Dolores O'Sullivan 1,674 39.9 -8.5
Majority 851 20.2 +16.9
Turnout 4,199 55.9 -0.7
Conservative hold Swing
Flixton
PartyCandidateVotes%±
Conservative Jonathan Coupe*2,13051.0-0.5
Labour Karina Carter 1,652 39.5 -9.0
Independent Paul Pickford 398 9.5 +9.5
Majority 478 11.5 +8.5
Turnout 4,180 57.1 +3.3
Conservative hold Swing
Hale
PartyCandidateVotes%±
Conservative Patricia Morris3,07864.5-4.6
Labour Beverly Harrison 794 16.7 -0.5
Liberal Democrat Jane Weightman 676 14.2 +0.4
Green Samuel Little 222 4.7 +4.7
Majority 2,288 47.8 -4.1
Turnout 4,770 57.1 -0.9
Conservative hold Swing
Longford
PartyCandidateVotes%±
Labour David Jarman*1,70849.7-12.6
Conservative Geoffrey Harding 1,233 35.9 -1.8
Green Bernard Kelly 497 14.5 +14.5
Majority 475 13.8 -10.8
Turnout 3,438 48.4 -0.1
Labour hold Swing
Mersey St. Marys
PartyCandidateVotes%±
Conservative John Lamb2,87754.4-1.4
Labour Sophie Taylor 1,548 29.3 -1.7
Liberal Democrat Graham Rogers 779 14.7 +1.5
Socialist Labour James Flannery 81 1.5 +1.5
Majority 1,329 25.1 +0.3
Turnout 5,285 55.8 +1.2
Conservative hold Swing
Park
PartyCandidateVotes%±
Labour Mary Strickland1,60461.5-1.3
Conservative John Schofield 1,006 38.5 +1.3
Majority 598 23.0 -2.6
Turnout 2,610 44.0 -2.8
Labour hold Swing
Priory
PartyCandidateVotes%±
Labour Barbara Keeley* 1,62040.9-7.6
Conservative Daniel Bunting 1,198 30.2 +0.2
Liberal Democrat Michael Riley 907 22.9 +1.4
Green Steven Flower 241 6.1 +6.1
Majority 422 10.7 -7.8
Turnout 3,966 54.6 +3.3
Labour hold Swing
Sale Moor
PartyCandidateVotes%±
Labour Munaver Rasul*1,38536.0-11.5
Conservative Pervez Nakvi 1,247 32.4 -0.3
Liberal Democrat Margaret Clarke 1,212 31.5 +17.4
Majority 138 3.6 -11.2
Turnout 3,844 50.7 -2.5
Labour hold Swing
St. Martins
PartyCandidateVotes%±
Labour David Quayle*2,14851.2-15.2
Conservative Colin Foster 1,461 34.8 +1.2
Liberal Democrat Richard Elliott 584 13.9 +13.9
Majority 687 16.4 -16.4
Turnout 4,193 53.3 +3.5
Labour hold Swing
Stretford
PartyCandidateVotes%±
Labour Bernice Garlick*1,98754.2-4.1
Conservative George Manley 1,331 36.3 -0.5
Green Antony Quinn 350 9.5 +9.5
Majority 656 17.9 -3.6
Turnout 3,668 49.1 -1.7
Labour hold Swing
Talbot
PartyCandidateVotes%±
Labour Pauleen Lane*1,50560.8-16.4
Conservative Colin Levenston 570 23.0 +0.2
Green Angela Hall 401 16.2 +16.2
Majority 935 37.8 -16.6
Turnout 2,476 40.2 +2.3
Labour hold Swing
Timperley
PartyCandidateVotes%±
Conservative Mauline Akins*2,46154.0+0.6
Liberal Democrat Catherine Smith 2,099 46.0 -0.6
Majority 362 8.0 +1.2
Turnout 4,560 52.5 +0.1
Conservative hold Swing
Urmston
PartyCandidateVotes%±
Labour Joyce Acton*1,91245.6-11.2
Conservative Christine Turner 1,808 43.2 +0.0
Green Helen Jocys 470 11.2 +11.2
Majority 104 2.4 -11.2
Turnout 4,190 56.6 +2.6
Labour hold Swing
Village
PartyCandidateVotes%±
Liberal Democrat Jane Brophy2,45448.7-16.4
Conservative David Pate 1,785 35.4 +0.5
Labour Martin Williams 800 15.9 +15.9
Majority 669 13.3 -16.9
Turnout 5,039 54.3 +3.7
Liberal Democrat hold Swing

Related Research Articles

Elections to Trafford Council were held on 2 May 2002. One third of the council was up for election, with each successful candidate to serve a two-year term of office, expiring in 2004, due to the boundary changes and 'all-out' elections due to take place that year. The Labour Party retained overall control of the council. Overall turnout was 52.3%.

Elections to Trafford Council were held on 10 June 2004.

2008 Manchester City Council election

Elections to Manchester City Council took place on 1 May 2008. One third of the council was up for election - every ward of the city returned one councillor at this election out of the three councillors a ward in the city has.

Elections to North Tyneside Metropolitan Council took place on 6 May 2010 on the same day as other council elections in England and the UK general election.

Elections to Trafford Council were held on 2 May 1996. One-third of the council was up for election, with each successful candidate to serve a four-year term of office, expiring in 2000. The Labour Party gained overall control of the council, from no overall control.

Elections to Trafford Council were held on 4 May 1995. One-third of the council was up for election, with each successful candidate to serve a four-year term of office, expiring in 1999. The Conservative party lost overall control of the council, to no overall control.

Elections to Trafford Council were held on 5 May 1988. One-third of the council was up for election, with each successful candidate to serve a four-year term of office, expiring in 1992. The Conservative party gained overall control of the council, from no overall control.

Elections to Trafford Council were held on 3 May 1984. One third of the council was up for election, with each successful candidate to serve a four-year term of office, expiring in 1988. The Conservative Party retained overall control of the council.

2007 St Albans City and District Council election

The 2007 St Albans City and District Council election took place on 3 May 2007 to elect members of St Albans District Council in Hertfordshire, England. One third of the council was up for election and the Liberal Democrats lost overall control of the council to no overall control.

Elections to Manchester Council were held on Thursday, 3 May 1979, on the same day as the 1979 UK General Election. One third of the council was up for election, with each successful candidate to serve a three-year term of office, expiring in 1982, due to the boundary changes and "all-out" elections due to take place that year. The Labour Party retained overall control of the council.

Elections to Manchester Council were held on Thursday, 1 May 1980. One-third of the council was up for election, with each successful candidate to serve a two-year term of office, expiring in 1982, due to the boundary changes and "all-out" elections due to take place that year. The Labour Party retained overall control of the council.

Elections to Manchester Council were held on Thursday, 6 May 1982. Due to demographic changes in the city since the formation of the new City Council in 1973, and in common with some other English councils in 1982, substantial boundary changes to all wards were implemented in time for these elections. The most notable changes were as follows:

2010 Craven District Council election

The 2010 Craven District Council election took place on 6 May 2010 to elect members of Craven District Council in North Yorkshire, England. One third of the council was up for election and the Conservative party gained overall control of the council from no overall control.

Elections to Manchester Council were held on Thursday, 2 May 2002. One third of the council - alongside a vacancy in Moss Side - was up for election, with each successful candidate to serve a two-year term of office, expiring in 2004, due to the boundary changes and 'all-out' elections due to take place in that year. The Independent Labour candidates stood as "Independent Progressive Labour". Overall turnout rose to 24.4% and the Labour Party retained overall control of the Council.

Elections to Manchester Council were held on Thursday, 1 May 2003. One third of the council was up for election as well as a vacancy in Benchill, with each successful candidate to serve a one-year term of office, expiring in 2004, due to the boundary changes and 'all-out' elections due to take place in that year. Turnout was down slightly to 22.2%, with Labour retaining overall control of the council. The election saw the Greens winning their first seat, and half a dozen Liberal Democrat gains resulting in Labour's majority being the lowest in twenty years. The three Independent Labour candidates stood as "Independent Progressive Labour".

Elections to Trafford Council was held on 5 May 2011. One third of the council was up for election, with each successful candidate serving four-year term of office, expiring in 2015. The Conservative Party retained overall control of the council.

2015 United Kingdom local elections

The 2015 United Kingdom local elections were held on Thursday 7 May 2015, the same day as the general election for the House of Commons of the United Kingdom.

2015 Plymouth City Council election

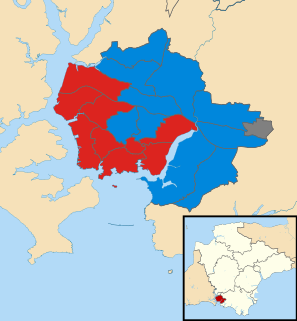
The 2015 Plymouth City Council election took place on 7 May 2015 to elect members of Plymouth City Council in England.

Elections to Herefordshire Council were held on 1 May 2003, along with other local elections in England and Scotland. Due to prior boundary reviews, all 38 wards were contested - with each ward electing either one two or three members to the council, with each successful candidate serving a four-year term of office, expiring in 2007. The council remained in no overall control, with the Conservative party replacing the Liberal Democrats as the largest party on the council, winning 20 out of a total of 56 seats on the council.

2018 Trafford Metropolitan Borough Council election

The 2018 Trafford Metropolitan Borough Council election to elect members of Trafford Metropolitan Borough Council in England took place on 3 May 2018. This was on the same day as other local elections.

References

  1. "Local elections". BBC News Online . Retrieved 2009-12-18.