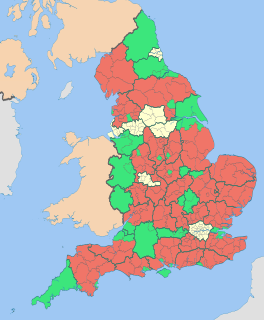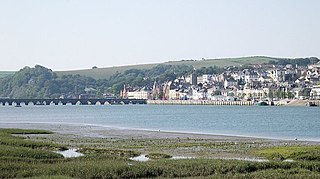
The 2003 Torridge District Council election took place on 1 May 2003 to elect members of Torridge District Council in Devon, England. The whole council was up for election after boundary changes and the council stayed under no overall control. [1] [2]
Non-metropolitan districts, or colloquially "shire districts", are a type of local government district in England. As created, they are sub-divisions of non-metropolitan counties in a two-tier arrangement.
Devon, also known as Devonshire, which was formerly its common and official name, is a county of England, reaching from the Bristol Channel in the north to the English Channel in the south. It is part of South West England, bounded by Cornwall to the west, Somerset to the north east, and Dorset to the east. The city of Exeter is the county town. The county includes the districts of East Devon, Mid Devon, North Devon, South Hams, Teignbridge, Torridge, and West Devon. Plymouth and Torbay are each geographically part of Devon, but are administered as unitary authorities. Combined as a ceremonial county, Devon's area is 6,707 km2 and its population is about 1.1 million.
A newly formed group called the Community Alliance gained 9 seats on the council and they were among 17 new councillors on the council. [3] [4] Among the gains for the Community Alliance were 3 seats in Northam ward, a seat in Bideford South from Labour and a gain from an independent in Westward Ho!. [2] None of the candidates for the Community Alliance were sitting councillors and the group said it aimed to "keep party politics out of local government". [2]
A Councillor is a member of a local government council.
Northam is a small town, civil parish and electoral ward in Devon, England, lying north of Bideford. The civil parish also includes the villages of Westward Ho!, Appledore, West Appledore, Diddywell, Buckleigh and Silford, and the residential areas of Orchard Hill and Raleigh Estate. The population at the 2011 census was 5,427.
The wards and electoral divisions in the United Kingdom are electoral districts at sub-national level represented by one or more councillors. The ward is the primary unit of English electoral geography for civil parishes and borough and district councils, electoral ward is the unit used by Welsh principal councils, while the electoral division is the unit used by English county councils and some unitary authorities. Each ward/division has an average electorate of about 5,500 people, but ward-population counts can vary substantially. As at the end of 2014 there were 9,456 electoral wards/divisions in the UK.
Meanwhile, Labour lost both their 2 seats on the council, while the Conservatives and Greens regained 1 seat each. [2] 8 councillors were elected without facing any opposition, but this was down from 9 at the 1999 election and 13 in 1995. [5] Overall turnout at the election was 38.4%, up from 36.1% in 1999. [6]
The Conservative Party, officially the Conservative and Unionist Party, is a centre-right political party in the United Kingdom. Presently led by Theresa May, it has been the governing party since 2010. It presently has 314 Members of Parliament in the House of Commons, 249 members of the House of Lords, and 18 members of the European Parliament. It also has 31 Members of the Scottish Parliament, 12 members of the Welsh Assembly, eight members of the London Assembly and 9,008 local councillors. One of the major parties of UK politics, it has formed the government on 45 occasions, more than any other party.
The Green Party of England and Wales is a green, left-wing political party in England and Wales. Headquartered in London, since September 2018, its co-leaders are Siân Berry and Jonathan Bartley. The Green Party has one representative in the House of Commons, one in the House of Lords, and three in the European Parliament. In addition, it has various councillors in UK local government and two members of the London Assembly.
Party | Seats | Gains | Losses | Net gain/loss | Seats % | Votes % | Votes | +/− | |
---|---|---|---|---|---|---|---|---|---|
Independent | 17 | 47.2 | 27.3 | 6,849 | -7.7% | ||||
Community Alliance Independent | 9 | +9 | 25.0 | 32.4 | 8,109 | +32.4% | |||
Liberal Democrat | 7 | 19.4 | 25.6 | 6,409 | -11.5% | ||||
Conservative | 1 | +1 | 2.8 | 4.6 | 1,165 | +3.5% | |||
Green | 1 | +1 | 2.8 | 3.4 | 845 | -3.1% | |||
UKIP | 1 | +1 | 2.8 | 1.7 | 427 | +1.7% | |||
Labour | 0 | -2 | 0 | 5.0 | 1,257 | -15.2% | |||
Party | Candidate | Votes | % | ± | |
---|---|---|---|---|---|
Liberal Democrat | Leonard Ford | 506 | |||
UKIP | Andrew Eastman | 427 | |||
Independent | Philip Waters | 421 | |||
Community Alliance Independent | Jeremy Bell | 402 | |||
Liberal Democrat | Colin Langbridge | 141 | |||
Turnout | 1,897 | 47.9 | |||
Party | Candidate | Votes | % | ± | |
---|---|---|---|---|---|
Community Alliance Independent | Stephen Clarke | 653 | |||
Community Alliance Independent | William Isaac | 516 | |||
Independent | Pamela Paddon | 482 | |||
Community Alliance Independent | Andrew Powell | 461 | |||
Liberal Democrat | Noel Deakes | 293 | |||
Liberal Democrat | Christopher Birchmore | 284 | |||
Liberal Democrat | David Nicholson | 161 | |||
Labour | Anne Brenton | 158 | |||
Labour | Lynda Dark | 144 | |||
Labour | Sarah Lovera | 87 | |||
Turnout | 3,239 | 32.2 | |||
Party | Candidate | Votes | % | ± | |
---|---|---|---|---|---|
Green | Peter Christie | 633 | |||
Liberal Democrat | Hugo Barton | 632 | |||
Community Alliance Independent | Alasdair Gould | 488 | |||
Independent | Christopher Leather | 486 | |||
Liberal Democrat | John Hadfield | 426 | |||
Liberal Democrat | Matthew Osborne | 338 | |||
Conservative | Graham Jones | 336 | |||
Turnout | 3,339 | 34.8 | |||
Party | Candidate | Votes | % | ± | |
---|---|---|---|---|---|
Liberal Democrat | Mervyn Lane | 494 | |||
Community Alliance Independent | Sonia Bushby | 424 | |||
Liberal Democrat | David Daniel | 354 | |||
Liberal Democrat | Anthony Inch | 344 | |||
Community Alliance Independent | David Ratcliff | 310 | |||
Labour | David Brenton | 309 | |||
Community Alliance Independent | Elliot Gould | 309 | |||
Labour | Ian Hopkins | 131 | |||
Labour | Walter Hill-Paul | 106 | |||
Turnout | 2,781 | 28.6 | |||
Party | Candidate | Votes | % | ± | |
---|---|---|---|---|---|
Independent | Frank Howard | unopposed | |||
Party | Candidate | Votes | % | ± | |
---|---|---|---|---|---|
Independent | Philip Collins | 228 | 34.2 | ||
Liberal Democrat | Richard Copp | 179 | 26.8 | ||
Conservative | Roy Watts | 179 | 26.8 | ||
Independent | Brian Stacey | 81 | 12.1 | ||
Majority | 49 | 7.3 | |||
Turnout | 667 | 55.1 | |||
Party | Candidate | Votes | % | ± | |
---|---|---|---|---|---|
Independent | Royston Johns | unopposed | |||
Party | Candidate | Votes | % | ± | |
---|---|---|---|---|---|
Conservative | Geoffrey Broyd | 294 | 56.1 | ||
Community Alliance Independent | Richard Deane | 230 | 43.9 | ||
Majority | 64 | 12.2 | |||
Turnout | 524 | 42.6 | |||
Party | Candidate | Votes | % | ± | |
---|---|---|---|---|---|
Independent | Christine March | unopposed | |||
Party | Candidate | Votes | % | ± | |
---|---|---|---|---|---|
Independent | William Pillman | unopposed | |||
Independent | Trevor Sillifant | unopposed | |||
Party | Candidate | Votes | % | ± | |
---|---|---|---|---|---|
Liberal Democrat | Desmond Shadrick | 784 | |||
Independent | John Allen | 581 | |||
Conservative | Coral Broyd | 356 | |||
Turnout | 1,721 | 40.5 | |||
Party | Candidate | Votes | % | ± | |
---|---|---|---|---|---|
Community Alliance Independent | Hugh Bone | 263 | 52.6 | ||
Independent | Anthony Collins | 237 | 47.4 | ||
Majority | 26 | 5.2 | |||
Turnout | 500 | 39.4 | |||
Party | Candidate | Votes | % | ± | |
---|---|---|---|---|---|
Independent | Geoffrey Boundy | unopposed | |||
Party | Candidate | Votes | % | ± | |
---|---|---|---|---|---|
Community Alliance Independent | Alan Eastwood | 941 | |||
Community Alliance Independent | Edward Davies | 926 | |||
Community Alliance Independent | Paul Sturges | 850 | |||
Independent | Richard Bradford | 640 | |||
Independent | Anthony Barnes | 525 | |||
Labour | Sheila Bloomfield | 322 | |||
Turnout | 4,204 | 40.0 | |||
Party | Candidate | Votes | % | ± | |
---|---|---|---|---|---|
Independent | Susan Mounce | 285 | 52.9 | ||
Community Alliance Independent | Matthew Richards | 254 | 47.1 | ||
Majority | 31 | 5.8 | |||
Turnout | 539 | 40.8 | |||
Party | Candidate | Votes | % | ± | |
---|---|---|---|---|---|
Liberal Democrat | Allin Bewes | 389 | 63.3 | ||
Community Alliance Independent | Richard Clark | 226 | 36.7 | ||
Majority | 163 | 26.5 | |||
Turnout | 615 | 47.6 | |||
Party | Candidate | Votes | % | ± | |
---|---|---|---|---|---|
Independent | Richard Broad | unopposed | |||
Party | Candidate | Votes | % | ± | |
---|---|---|---|---|---|
Independent | Patricia Ferguson | unopposed | |||
Party | Candidate | Votes | % | ± | |
---|---|---|---|---|---|
Independent | Margaret Brown | 645 | |||
Independent | Richard Bond | 424 | |||
Liberal Democrat | John Rawlinson | 376 | |||
Liberal Democrat | William Brook | 364 | |||
Independent | Richard Rumbold | 254 | |||
Liberal Democrat | Adrian Freeland | 243 | |||
Green | Cathrine Simmons | 212 | |||
Turnout | 2,518 | 27.8 | |||
Party | Candidate | Votes | % | ± | |
---|---|---|---|---|---|
Independent | James Morrish | 253 | 43.5 | ||
Independent | William Tanton | 154 | 26.5 | ||
Liberal Democrat | Maurice Ridd | 101 | 17.4 | ||
Community Alliance Independent | Patrick Adams | 74 | 12.7 | ||
Majority | 99 | 17.0 | |||
Turnout | 582 | 46.9 | |||
Party | Candidate | Votes | % | ± | |
---|---|---|---|---|---|
Independent | Robert Hicks | 332 | 69.3 | ||
Community Alliance Independent | Roger Vanstone | 147 | 30.7 | ||
Majority | 185 | 38.6 | |||
Turnout | 479 | 39.1 | |||
Party | Candidate | Votes | % | ± | |
---|---|---|---|---|---|
Community Alliance Independent | Timothy Williams | 428 | 57.6 | ||
Independent | Thomas Barclay | 315 | 42.4 | ||
Majority | 113 | 15.2 | |||
Turnout | 743 | 45.6 | |||
Party | Candidate | Votes | % | ± | |
---|---|---|---|---|---|
Independent | John Cowle | 506 | 71.0 | ||
Community Alliance Independent | Paul Camilleri | 207 | 29.0 | ||
Majority | 299 | 41.9 | |||
Turnout | 713 | 47.9 | |||
A by-election was held in Bideford South on 4 December 2003 after the former leader of the council, Liberal Democrat Mervyn Lane, resigned from the council due to ill health. [8]
By-elections, also spelled bye-elections, are used to fill elected offices that have become vacant between general elections.
The Liberal Democrats are a liberal political party in the United Kingdom. They presently have 11 Members of Parliament in the House of Commons, 96 members of the House of Lords, and one member of the European Parliament. They also have five Members of the Scottish Parliament and a member each in the Welsh Assembly and London Assembly. The party reached the height of its influence in the early 2010s, forming a junior partner in a coalition government from 2010 to 2015. It is presently led by Vince Cable.
Party | Candidate | Votes | % | ± | |
---|---|---|---|---|---|
Liberal Democrat | Anthony Inch | 244 | 44.4 | +4.1 | |
Independent | Chris Leather | 177 | 32.2 | +32.2 | |
Community Alliance | Shirley Hagley | 128 | 23.3 | -11.3 | |
Majority | 67 | 12.2 | |||
Turnout | 549 | 15.2 | -13.4 | ||
Liberal Democrat hold | Swing | ||||
Party | Candidate | Votes | % | ± | |
---|---|---|---|---|---|
Independent | Roger Tisdale | 257 | 37.1 | -5.3 | |
Liberal Democrat | John Hadfield | 226 | 32.6 | +32.6 | |
Conservative | Anthony Collins | 149 | 21.5 | +21.5 | |
Independent | Hugh Brading | 61 | 8.8 | +8.8 | |
Majority | 31 | 4.5 | |||
Turnout | 693 | 41.2 | -4.4 | ||
Independent gain from Independent | Swing | ||||
Independent Kenneth James won a by-election in Tamarside on 14 July 2005 after the death of councillor Richard Broad. [12]
Party | Candidate | Votes | % | ± | |
---|---|---|---|---|---|
Independent | Kenneth James | 167 | 45.2 | ||
Conservative | Coral Broyd | 143 | 38.7 | ||
Independent | Arthur Stewart | 59 | 16.0 | ||
Majority | 24 | 6.5 | |||
Turnout | 369 | 29.6 | |||
Independent hold | Swing | ||||
Conservative Sam Robinson won a by-election in Northam on 23 November 2006 after the resignation of councillor Alan Eastwood. [14]
Party | Candidate | Votes | % | ± | |
---|---|---|---|---|---|
Conservative | Samuel Robinson | 556 | 57.3 | +57.3 | |
Green | Miranda Cox | 414 | 42.7 | +42.7 | |
Majority | 142 | 14.6 | |||
Turnout | 970 | 21.6 | -18.4 | ||
Conservative gain from Independent | Swing | ||||
Bideford is a historic port town on the estuary of the River Torridge in north Devon, south-west England. It is the main town of the Torridge local government district.
West Devon is a local government district and borough in Devon, England. Towns in the district include Chagford, Okehampton, Princetown, and Tavistock, where the council is based.
Appledore is a village at the mouth of the River Torridge, about 6 miles (10 km) west of Barnstaple and about 3 miles (5 km) north of Bideford in the county of Devon, England. It is home to Appledore Shipbuilders, a lifeboat slipway and Hocking's Ice Cream, a brand of ice cream only sold in North Devon. The local football club is Appledore F.C. The ward population at the 2011 census increased to 2,814
Torridge and West Devon is a constituency represented in the House of Commons of the UK Parliament since 2005 by Geoffrey Cox, a Conservative.
Mid Devon District Council in Devon, England is elected every four years. Since the last boundary changes in 2003, 42 councillors have been elected from 24 wards.
West Devon Borough Council in Devon, England is elected every four years. Since the last boundary changes in 2003, 31 councillors have been elected from 22 wards.
The 2000 Harlow District Council election took place on 4 May 2000 to elect members of Harlow District Council in Essex, England. One third of the council was up for election and the Labour party stayed in overall control of the council.
The 2003 Harlow District Council election took place on 1 May 2003 to elect members of Harlow District Council in Essex, England. One third of the council was up for election and the council stayed under no overall control.
Torridge District Council in Devon, England is elected every four years. Since the last boundary changes in 2003, 36 councillors have been elected from 23 wards.
Plymouth City Council is the unitary authority for Plymouth, Devon. It has traditionally been controlled by Labour or the Conservatives, with Liberal Democrats rarely winning seats.
The 2003 Colchester Borough Council election took place on 1 May 2003 to elect members of Colchester Borough Council in Essex, England. This was the same day as the other 2003 United Kingdom local elections. One third of the seats were up for election and the council stayed under no overall control.
The 1999 Torridge District Council election took place on 6 May 1999 to elect members of Torridge District Council in Devon, England. The whole council was up for election and independents gained overall control of the council from no overall control.
The 2007 Torridge District Council election took place on 3 May 2007 to elect members of Torridge District Council in Devon, England. The whole council was up for election and independents lost overall control of the council to no overall control.
The 2011 Torridge District Council election took place on 5 May 2011 to elect members of Torridge District Council in Devon, England. The whole council was up for election and the council stayed under no overall control.
The 2012 Huntingdonshire District Council election took place on 3 May 2012 to elect members of Huntingdonshire District Council in Cambridgeshire, England. One third of the council was up for election and the Conservative party stayed in overall control of the council.
The 2015 Torridge District Council election took place on 7 May 2015 to elect members of Torridge District Council in England. This was on the same day as other local elections and the 2015 UK General Election hence turnout was much higher than usual Local Elections.
The 2015 Wyre Forest District Council election took place on 7 May 2015 to elect members of Wyre Forest District Council in Worcestershire, England. The whole council was up for election after boundary changes reduced the number of seats by nine. The Conservative party gained overall control of the council from no overall control.