Devon County Council election, 2013

Last updated

Devon County Council election, 2013
Flag of England.svg
  2009 2 May 2013 2017  

All 62 seats to Devon County Council
32 seats needed for a majority

 First partySecond party
 
Party Conservative Liberal Democrat
Seats won389
Seat changeDecrease2.svg3Decrease2.svg4

 Third partyFourth party
 
Party Labour UKIP
Seats won74
Seat changeIncrease2.svg1Increase2.svg4

Devon County Council election 2013 map.svg
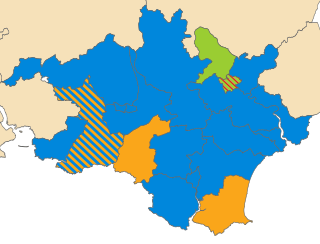
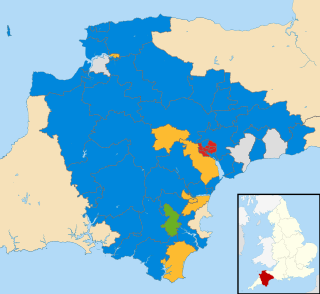
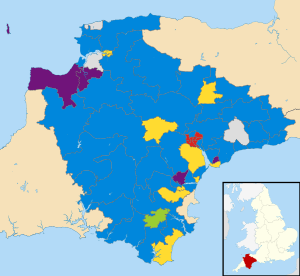
Map showing the results of the 2013 Devon County Council elections.

Council control before election

Conservative

Council control after election

Conservative

An election to Devon County Council took place on 2 May 2013 as part of the United Kingdom local elections, 2013. 62 councillors were elected from electoral divisions which returned one county councillor each by first-past-the-post voting for a four-year term of office. The electoral divisions were the same as those used at the previous election in 2009. No elections were held in Plymouth and Torbay, which are unitary authorities outside the area covered by the County Council.

Devon County Council British administrative authority

Devon County Council is the county council administering the English county of Devon. Based in the city of Exeter, the council covers the non-metropolitan county area of Devon. Members of the council (councillors) are elected every four years to represent the electorate of each county division, almost all being nominated by the major national political parties.

First-past-the-post voting voting system in which voters select one candidate, and the candidate who receives more votes than any other candidate wins

A first-past-the-post electoral system is one in which voters indicate on a ballot the candidate of their choice, and the candidate who receives the most votes wins. This is sometimes described as winner takes all. First-past-the-post voting is a plurality voting method. FPTP is a common, but not universal, feature of electoral systems with single-member electoral divisions, and is practiced in close to one third of countries. Notable examples include Canada, India, the United Kingdom, and the United States, as well as most of their current or former colonies and protectorates.

Contents

All locally registered electors (British, Irish, Commonwealth and European Union citizens) who were aged 18 or over on Thursday 2 May 2013 were entitled to vote in the local elections. Those who were temporarily away from their ordinary address (for example, away working, on holiday, in student accommodation or in hospital) were also entitled to vote in the local elections, [1] although those who had moved abroad and registered as overseas electors cannot vote in the local elections. It is possible to register to vote at more than one address (such as a university student who had a term-time address and lives at home during holidays) at the discretion of the local Electoral Register Office, but it remains an offence to vote more than once in the same local government election. [2]

In general, a Commonwealth citizen is a citizen of a member state of the Commonwealth of Nations. This designation is given legal effect in the nationality laws of some Commonwealth countries, and Commonwealth citizens may enjoy some privileges in the United Kingdom and, less commonly, other member states. Each Commonwealth country determines what special rights, if any, are accorded to citizens of other Commonwealth countries. The status is most significant in British law and has little effect in many other Commonwealth countries, such as Canada.

European Union Economic and poitical union of states located in Europe

The European Union (EU) is a political and economic union of 28 member states that are located primarily in Europe. It has an area of 4,475,757 km2 (1,728,099 sq mi) and an estimated population of about 513 million. The EU has developed an internal single market through a standardised system of laws that apply in all member states in those matters, and only those matters, where members have agreed to act as one. EU policies aim to ensure the free movement of people, goods, services and capital within the internal market, enact legislation in justice and home affairs and maintain common policies on trade, agriculture, fisheries and regional development. For travel within the Schengen Area, passport controls have been abolished. A monetary union was established in 1999 and came into full force in 2002 and is composed of 19 EU member states which use the euro currency.

Summary

The election saw the Conservative Party maintain overall control with a reduced majority of fourteen seats. The Liberal Democrats remained the council's largest single opposition party, while the Labour Party made a net gain of one seat. UKIP took its first seats on the council, winning four. The Green Party regained its seat (Totnes Rural) following an interim defection to the Labour Party. The election also saw three independent councillors elected.

Conservative Party (UK) Political party in the United Kingdom

The Conservative Party, officially the Conservative and Unionist Party, is a centre-right political party in the United Kingdom. Presently led by Theresa May, it has been the governing party since 2010. It presently has 314 Members of Parliament in the House of Commons, 249 members of the House of Lords, and 18 members of the European Parliament. It also has 31 Members of the Scottish Parliament, 12 members of the Welsh Assembly, eight members of the London Assembly and 9,008 local councillors. One of the major parties of UK politics, it has formed the government on 45 occasions, more than any other party.

Liberal Democrats (UK) Political party in the United Kingdom

The Liberal Democrats are a liberal political party in the United Kingdom. They presently have 11 Members of Parliament in the House of Commons, 96 members of the House of Lords, and one member of the European Parliament. They also have five Members of the Scottish Parliament and a member each in the Welsh Assembly and London Assembly. The party reached the height of its influence in the early 2010s, forming a junior partner in a coalition government from 2010 to 2015. It is presently led by Vince Cable.

The Labour Party is a centre-left political party in the United Kingdom which has been described as an alliance of social democrats, democratic socialists and trade unionists. The party's platform emphasises greater state intervention, social justice and strengthening workers' rights.

Results

Devon County Council election, 2013 [3] [4]
PartySeatsGainsLossesNet gain/lossSeats %Votes %Votes+/−
  Conservative 3825-361.335.369,825Decrease2.svg6.6
  Liberal Democrat 926-414.516.031,683Decrease2.svg13.9
  Labour 721+111.313.226,044Increase2.svg7.1
  UKIP 440+46.523.045,550Increase2.svg9.0
  Independent 310+14.85.611,148Increase2.svg1.0
  Green 110+11.66.512,785Decrease2.svg0.3
  Other parties 000000.2447
  Liberal 000000.2422Decrease2.svg0.8
  BNP 000000.028Decrease2.svg0.5

Note: seat changes reflect the council composition immediately before the election, taking into account the defection of the Liberal Democrat councillor for Exwick & St Thomas to the Labour Party, and the June 2012 defection of the Green Party councillor for Totnes Rural to the Labour Party.

Election result by division

Alphington and Cowick

Alphington and Cowick [5]
PartyCandidateVotes%±
Labour Roy Hill1,29134.9
Liberal Democrat Vanessa Newcombe97626.4
UKIP Dutch Dudgeon75020.3
Conservative Louis Ten-Holter49913.5
Green Diana Frances Moore1754.7
Majority3158.5
Turnout 3,69532.5
Labour gain from Liberal Democrat Swing

Ashburton and Buckfastleigh

Ashburton and Buckfastleigh [6]
PartyCandidateVotes%±
Conservative Stuart Denis Barker1,31436.6
UKIP Alan Derek Whitton73420.4
Green Anna Clarke67418.8
Labour Michael Harriott45112.6
Liberal Democrat John Nutley40811.4
Majority58016.2
Turnout 3,59133.5
Conservative hold Swing

Axminster

Axminster [7]
PartyCandidateVotes%±
Conservative Andrew T Moulding1,74147.1
Independent Paul G Hayward1,06031.1
Liberal Democrat Rob Jordan3028.9
Labour Jerry Walden2196.4
Majority74021.7
Turnout 3,40436.2
Conservative hold Swing

Barnstaple North

Barnstaple North [8]
PartyCandidateVotes%±
Liberal Democrat Brian Carol Greenslade95930.5
Conservative Simon Peter Harvey67221.4
UKIP Michael Edward Pagram60319.2
Green Ricky Knight52616.7
Labour Mark Michael Robert Cann2628.3
Independent Tom Prideaux591.9
Communist Gerrard Anthony Sables531.7
Majority2879.1
Turnout 3,14328.9
Liberal Democrat hold Swing

Barnstaple South

Barnstaple South [9]
PartyCandidateVotes%±
Conservative John Vincent Mathews95531.6
Liberal Democrat Chris Haywood82427.3
UKIP Christopher Frederick William Turner75925.1
Labour Geoff Moody2859.4
Green Rosemary Haworth-Booth1846.1
Majority1314.3
Turnout 3,01929.4
Conservative gain from Liberal Democrat Swing

Bickleigh and Wembury

Bickleigh and Wembury [10]
PartyCandidateVotes%±
Conservative John Hart1,69159.6
UKIP Hugh Martyn Williams80528.4
Liberal Democrat Sue Bridgwater31511.1
Majority88631.2
Turnout 2,83829.7
Conservative hold Swing

Bideford East

Bideford East [11]
PartyCandidateVotes%±
UKIP Gaston Amedee Dezart86230.5
Conservative Sam Robinson82729.3
Labour David George Brenton55719.7
Liberal Democrat Trevor John Johns39313.9
Green John Paul Hextall1756.2
Majority351.2
Turnout 2,82426.9
UKIP gain from Conservative Swing

Bideford South and Hartland

Bideford South and Hartland [12]
PartyCandidateVotes%±
UKIP Robin Julian94431.0
Conservative Alison Jane Boyle79426.1
Independent Adam James Symons77425.4
Labour Anne Brenton2618.6
Liberal Democrat Bob Wootton1384.5
Green Colin David Jones1284.2
Majority1504.9
Turnout 3,04531.4
UKIP gain from Conservative Swing

Bovey Tracey Rural

Bovey Tracey Rural [13]
PartyCandidateVotes%±
Conservative George Gribble1,65846.9
UKIP Bruce Andrew Meechan78122.1
Liberal Democrat Sally Angela Morgan50614.3
Labour Lisa Collette Robillard Webb40111.4
Green Anna Murray Preece1825.2
Majority87724.8
Turnout 3,53239.4
Conservative hold Swing

Braunton Rural

Braunton Rural [14]
PartyCandidateVotes%±
Conservative Caroline Jean Chugg1,07336.1
UKIP Stephen James Crowther74224.9
Liberal Democrat Elizabeth Mary Spear68022.9
Labour Valerie Jean Cann30510.3
Green Jooley Fowles-Smith1655.5
Majority33111.1
Turnout 2,97531.3
Conservative hold Swing

Broadclyst and Whimple

Broadclyst and Whimple [15]
PartyCandidateVotes%±
Conservative Peter N Bowden1,15936.3
UKIP Sylvia M Brownlee69121.6
Liberal Democrat Derek G Button65220.4
Green Henry F Gent45514.2
Labour Gillian Nicholls2357.4
Majority46814.6
Turnout 3,19534.6
Conservative hold Swing

Budleigh

Budleigh [16]
PartyCandidateVotes%±
Conservative Christine Channon1,37342.2
UKIP Graham A Hooker93928.8
Liberal Democrat Lesley Miszewska42513.1
Green Roger P Saunders2918.9
Labour Tony Badcott2216.8
Majority43413.3
Turnout 3,25537.4
Conservative hold Swing

Chudleigh Rural

Chudleigh Rural [17]
PartyCandidateVotes%±
Conservative Jerry Brook1,15334.7
UKIP Geoffrey Raymond Trezise80824.3
Independent Stephen John Kinross Purser50915.3
Liberal Democrat Stephen Barnes3089.3
Green Patricia Langman2738.2
Labour Chris Raybould-Gooding2668.0
Majority34510.4
Turnout 3,32533.7
Conservative hold Swing

Chulmleigh and Swimbridge

Chulmleigh and Swimbridge [18]
PartyCandidateVotes%±
Conservative Richard Colin Edgell1,48242.3
Liberal Democrat David John Worden84624.1
UKIP John Baglow73120.8
Green Mark Haworth-Booth2286.5
Labour Marion Elizabeth Mason2126.0
Majority63618.1
Turnout 3,50736.9
Conservative hold Swing

Combe Martin Rural

Combe Martin Rural [19]
PartyCandidateVotes%±
Conservative Andrea Vivienne Davis1,45252.6
UKIP Andy Norden71826.0
Liberal Democrat Rodney Hillman Hawes2749.9
Green Scott Lawley Burrows1746.3
Labour Heathcliffe Guy Pettifer1385.0
Majority73426.6
Turnout 2,76233.3
Conservative hold Swing

Crediton Rural

Crediton Rural [20]
PartyCandidateVotes%±
Liberal Democrat Nick Way1,36735.7
Conservative Derek Roy Coren1,33634.9
UKIP Mike Szabo65617.1
Labour Lynne Richards45711.9
Majority310.8
Turnout 3,82838.4
Liberal Democrat hold Swing

Cullompton Rural

Cullompton Rural [21]
PartyCandidateVotes%±
Conservative John Berry1,42244.7
UKIP Lloyd Knight65320.5
Liberal Jenny Roach42213.3
Liberal Democrat Luke Daniel Taylor3159.9
Labour Paul Jason Stone2417.6
Green Colin Matthews1183.7
Majority76924.2
Turnout 3,18030.2
Conservative hold Swing

Dartmouth and Kingswear

Dartmouth and Kingswear [22]
PartyCandidateVotes%±
Conservative Jonathan Hawkins1,17046.4
Labour Ben Cooper67526.8
UKIP Martyn Brian Cocks50720.1
Liberal Democrat Janice Claire Henshall1636.5
Majority49519.6
Turnout 2,52235.6
Conservative hold Swing

Dawlish

Dawlish [23]
PartyCandidateVotes%±
Conservative John Clatworthy1,57943.8
UKIP Martin Heath1,09430.4
Labour Bernard Mills37110.3
Liberal Democrat Mike James2948.2
Green Gilly Robinson2597.2
Majority48513.5
Turnout 3,60232.4
Conservative hold Swing

Duryard and Pennsylvania

Duryard and Pennsylvania [24]
PartyCandidateVotes%±
Conservative Percy Prowse1,05742.8
Labour Hannah Packham54121.9
UKIP Colin Stewart36114.6
Liberal Democrat Kevin Martin Chun28811.7
Green Chris Barnett2168.7
Majority51620.9
Turnout 2,46926.8
Conservative hold Swing

Exminster and Kenton

Exminster and Kenton [25]
PartyCandidateVotes%±
Liberal Democrat Alan Michael Connett1,50849.3
Conservative Kevin Andrew Lake93030.4
UKIP Elizabeth Mary Burton35511.6
Green Andy Bragg1504.9
Labour Paul David Bull1133.7
Majority57818.9
Turnout 3,06141.6
Liberal Democrat hold Swing

Exmouth Brixington and Withycombe

Exmouth Brixington and Withycombe [26]
PartyCandidateVotes%±
UKIP John A Hone92633.3
Liberal Democrat Brenda O Taylor74226.7
Conservative Jill Elson69024.8
Labour Stuart Fegan28010.1
Green Oliver Davey1385.0
Majority1846.6
Turnout 2,78027.4
UKIP gain from Liberal Democrat Swing

Exmouth Halsdon and Woodbury

Exmouth Halsdon and Woodbury [27]
PartyCandidateVotes%±
Conservative Bernard C Hughes1,21042.5
UKIP Patrick C McAndrew70724.9
Liberal Democrat Tim Dumper64222.6
Labour Lesley Johnson2749.6
Majority50317.7
Turnout 2,84532.5
Conservative hold Swing

Exmouth Littleham and Town

Exmouth Littleham and Town [28]
PartyCandidateVotes%±
Liberal Democrat Eileen E Wragg1,00931.7
Conservative John T Humphreys93429.3
UKIP Ann Prior79524.9
Labour Ray Davison3099.7
Green Ben Jones1314.1
Majority752.4
Turnout 3,18730.7
Liberal Democrat hold Swing

Exwick and St. Thomas

Exwick and St. Thomas [29]
PartyCandidateVotes%±
Labour Rob Hannaford1,59349.9
UKIP Brian Jeffery75523.6
Conservative Lizzie Roberts34010.6
Liberal Democrat Sally Elizabeth Willcox2447.6
Green Audaye Khalid Elesedy1474.6
Independent Lee Matthew Gillett1103.4
Majority83826.2
Turnout 3,19327.4
Labour hold Swing

Fremington Rural

Fremington Rural [30]
PartyCandidateVotes%±
Independent Frank Biederman1,52645.6
Independent Rodney Sheridan Cann90427.0
UKIP Caroline Susan Crowther51415.4
Conservative John Himan2036.1
No labelJoanne Bell732.2
Labour Danny James Neary722.2
Green Liz Wood501.5
Majority62218.6
Turnout 3,34639.0
Independent gain from Independent Swing

Hatherleigh and Chagford

Hatherleigh and Chagford [31]
PartyCandidateVotes%±
Conservative James Raymond McInnes1,98149.9
UKIP Alan Gross1,19530.1
Labour Irene S Wareing40110.1
Green William Douglas-Mann3839.6
Majority78619.8
Turnout 3,96937.3
Conservative hold Swing

Heavitree and Whipton Barton

Heavitree and Whipton Barton [32]
PartyCandidateVotes%±
Labour Olwen Foggin1,65548.1
Conservative Peter Geoffrey Holland80323.3
UKIP Richard Timmis60517.6
Liberal Democrat Ditch Townsend1905.5
Green Rouben Scott Freeman1865.4
Majority85224.7
Turnout 3,44433.6
Labour hold Swing

Holsworthy Rural

Holsworthy Rural [33]
PartyCandidateVotes%±
Conservative Barry Parsons1,91247.0
UKIP Penny Mills1,54838.0
Green Keith Stuart Funnell2035.0
Independent Sandra Louise Willetts2014.9
Labour Viv Gale1974.8
Majority3648.9
Turnout 4,06938.7
Conservative hold Swing

Honiton St. Michael's

Honiton St. Michael's [34]
PartyCandidateVotes%±
Conservative Sara M Randall Johnson1,03435.9
UKIP Brian J Smith79827.7
Green Sharon D Pavey70924.6
Labour Michael J Teare1816.3
Liberal Democrat Jonathan W Underwood1595.5
Majority2368.2
Turnout 2,88332.4
Conservative hold Swing

Honiton St. Paul's

Honiton St. Paul's [35]
PartyCandidateVotes%±
Conservative Paul A Diviani1,13038.3
UKIP Peter C Townsend79026.8
Independent Cathy Gardner35211.9
Labour Sally Broom31710.7
Liberal Democrat Paul Newman1766.0
Green Martin R Paine1695.7
Majority34011.5
Turnout 2,95332.5
Conservative hold Swing

Ilfracombe

Ilfracombe [36]
PartyCandidateVotes%±
Independent Mike Edmunds85136.4
Conservative Paul Edwards Crabb74731.9
UKIP Alan Roy Whittle48220.6
Labour Marianna Holdsworth25310.8
Majority1044.4
Turnout 2,33925.2
Independent gain from Liberal Democrat Swing

Ivybridge

Ivybridge [37]
PartyCandidateVotes%±
Conservative Roger Frederick Croad1,02840.6
UKIP Edward James Lally71428.2
Green Katie Anne Reville60123.7
Liberal Democrat Jon May1857.3
Majority31412.4
Turnout 2,53427.1
Conservative hold Swing

Kingsbridge and Stokenham

Kingsbridge and Stokenham [38]
PartyCandidateVotes%±
Liberal Democrat Julian Charles Brazil1,41840.4
Conservative Keith Robert Henry Wingate1,15332.8
UKIP Joshua John Alexander Gardner77222.0
Labour Louise Lewis1594.5
Majority2657.5
Turnout 3,51342.9
Liberal Democrat hold Swing

Kingsteignton

Kingsteignton [39]
PartyCandidateVotes%±
UKIP Tony Dempster90836.5
Conservative Mike Walters75330.2
Liberal Democrat Michael John Hocking45818.4
Labour Robert Alexander Kennedy28611.5
Green David Philip Bailey783.1
Majority1556.2
Turnout 2,49027.5
UKIP gain from Conservative Swing

Newton Abbot North

Newton Abbot North [40]
PartyCandidateVotes%±
Conservative Eve Louise Barisic70028.3
Liberal Democrat Jackie Brodie62025.1
UKIP Will Forrow50020.2
Independent Anne Fry34714.0
Labour Mary Brenda Kennedy2118.5
Green Julie Anne Boultby873.5
Majority803.2
Turnout 2,47225.9
Conservative gain from Liberal Democrat Swing

Newton Abbot South

Newton Abbot South [41]
PartyCandidateVotes%±
Liberal Democrat Gordon Nicholas Hook1,45047.4
Conservative John Gadie66921.8
UKIP Rod Peers66221.6
Labour Paula Joan Black2688.8
Majority78125.5
Turnout 3,06230.8
Liberal Democrat hold Swing

Newton St. Cyres and Sandford

Newton St. Cyres and Sandford [42]
PartyCandidateVotes%±
Conservative Margaret Edith Squires1,73546.4
UKIP Bob Edwards85522.9
Labour Charlie Werner59115.8
Liberal Democrat John Downes3088.2
Green Keith Povey2466.6
Majority88023.5
Turnout 3,74140.1
Conservative hold Swing

Newtown and Polsloe

Newtown and Polsloe [43]
PartyCandidateVotes%±
Labour Richard Westlake1,31456.5
Conservative Rob Newby36315.6
UKIP Jacqueline Holdstock29712.8
Green Tom Milburn2109.0
Liberal Democrat Alan Williamson1064.6
TUSC Carlos Hudson291.2
Majority95140.9
Turnout 2,32429.1
Labour hold Swing

Northam

Northam [44]
PartyCandidateVotes%±
Conservative Andrew John Eastman1,61640.5
UKIP Chris Leather1,47536.9
Green Peter Graham Hames3298.2
Labour James Andrew Craigie3037.6
Liberal Democrat David Berryman2586.5
Majority1413.5
Turnout 3,99239.4
Conservative hold Swing

Okehampton Rural

Okehampton Rural [45]
PartyCandidateVotes%±
Conservative Kevin Ball1,47740.9
UKIP Daniel Pledger1,15632.0
Labour Terry Cummings52014.4
Liberal Democrat Christopher John Bones43812.1
Majority3218.9
Turnout 3,60731.8
Conservative hold Swing

Ottery St. Mary Rural

Ottery St. Mary Rural [46]
PartyCandidateVotes%±
Independent Claire L Wright2,97074.1
Conservative Chris Wale52213.0
UKIP John Kelly3829.5
Labour Andrew V Blackwell1243.1
Majority2,44861.1
Turnout 4,00743.4
Independent hold Swing

Pinhoe and Mincinglake

Pinhoe and Mincinglake [47]
PartyCandidateVotes%±
Labour Emma Morse1,35443.1
UKIP Keith Crawford80925.7
Conservative Cynthia Thompson78224.9
Liberal Democrat John Robert Orm Ashton973.1
Green Isaac Micah Euan Price-Sosner922.9
Majority54517.3
Turnout 3,14234.1
Labour hold Swing

Priory and St. Leonard's

Priory and St. Leonard's [48]
PartyCandidateVotes%±
Labour Andy Hannan1,71144.1
Conservative Stephanie Warner1,12929.1
UKIP Jacalyn Warwick48112.4
Green Alison Harcourt2436.3
Liberal Democrat Joel Mason1433.7
Your Decision To Keep Lights OnNicola Guagliardo1333.4
BNP Christopher Stone280.7
Majority58215.0
Turnout 3,87935.7
Labour hold Swing

Seaton Coastal

Seaton Coastal [49]
PartyCandidateVotes%±
Conservative Jim Knight1,31238.8
UKIP Warwick J Knowles95628.3
Liberal Democrat Peter W Burrows71321.1
Labour Stephen R Williams37211.0
Majority35610.5
Turnout 3,37935.4
Labour hold Swing

Sidmouth Sidford

Sidmouth Sidford [50]
PartyCandidateVotes%±
Conservative Stuart Hughes1,92347.2
UKIP Lawrie Brownlee1,50536.9
Labour Judy Blackwell3618.9
Liberal Democrat Martin Gammell2786.8
Majority41810.3
Turnout 4,07837.5
Conservative hold Swing

South Brent and Dartington

South Brent and Dartington [51]
PartyCandidateVotes%±
Conservative Rosemary Rowe1,11434.1
Green Jacqi Hodgson94028.8
UKIP Ray Harrington59418.2
Labour Tony Whitty37511.5
Liberal Democrat David Allan Robinson2387.3
Majority1745.3
Turnout 3,26736.7
Conservative hold Swing

South Molton

South Molton Rural [52]
PartyCandidateVotes%±
Conservative Jeremy Owen Yabsley1,41942.8
Liberal Democrat Matthew Thomas Bushell93328.2
UKIP Brian David Hockin69621.0
Labour Hilary Kathryn Greenfield1675.0
Green L'Anne Knight902.7
Majority48614.7
Turnout 3,31434.9
Conservative hold Swing

St. Davids and St. James

St. Davids and St. James [53]
PartyCandidateVotes%±
Labour Jill Owen73234.3
Liberal Democrat Philip John Brock67131.4
Green Andrew Wallace Bell29413.8
UKIP Ralph Gay2079.7
Conservative James Roberts1888.8
TUSC Luke Christopher Pilling341.6
Majority612.9
Turnout 2,13622.5
Labour gain from Liberal Democrat Swing

St. Loyes and Topsham

St. Loyes and Topsham [54]
PartyCandidateVotes%±
Conservative Andrew Robert Leadbetter1,48749.8
Labour Elliot Wright73124.5
UKIP Valerie Angus48216.2
Green Mark Stephen Cox1444.8
Liberal Democrat Christine Vince1334.5
Majority75625.3
Turnout 2,98331.0
Conservative hold Swing

Tavistock

Tavistock [55]
PartyCandidateVotes%±
Conservative Debo Sellis1,54440.7
UKIP George Edward Mudge80421.2
Liberal Democrat Alison Clish-Green79520.9
Labour Moira Brown39210.3
Green Judy Sara Maciejowska2496.6
Majority74019.5
Turnout 3,79634.1
Conservative hold Swing

Teign Estuary

Teign Estuary [56]
PartyCandidateVotes%±
Conservative Christopher Stuart Clarance1,17837.2
Liberal Democrat David Nicholas Cox1,12135.4
UKIP Richard Stanton61319.4
Labour Anthony Ronald Randall2528.0
Majority571.8
Turnout 3,16635.9
Conservative hold Swing

Teignbridge South

Teignbridge South [57]
PartyCandidateVotes%±
Liberal Democrat Alistair Dewhirst1,39641.3
Conservative Dennis Esmond Smith1,00129.6
UKIP Sue Doidge68320.2
Labour Jacqueline Anne Stewart1614.8
Green Keith Clements1394.1
Majority39511.7
Turnout 3,38337.1
Liberal Democrat gain from Conservative Swing

Teignmouth

Teignmouth [58]
PartyCandidateVotes%±
Liberal Democrat Richard Younger-Ross 1,18537.2
Conservative James Robert McMurray91328.7
UKIP Mike Smith74923.5
Labour Niall Thomas Duffy2487.8
TUSC Sean Brogan782.5
Majority2728.5
Turnout 3,18239.4
Liberal Democrat gain from Conservative Swing

Thurlestone, Salcombe and Allington

Thurlestone, Salcombe and Allington [59]
PartyCandidateVotes%±
Conservative Rufus Gilbert1,44747.8
UKIP Dennis Hobday1,00933.3
Labour Michael Connelly1966.5
Liberal Democrat Laurel Lawford1956.4
Green Daniel Forster1745.7
Majority43814.5
Turnout 3,02838.9
Conservative hold Swing

Tiverton East

Tiverton East [60]
PartyCandidateVotes%±
Liberal Democrat Des Hannon1,09337.4
Conservative Neal Vincent Davey72624.8
UKIP George Birch64422.0
Labour Christopher James Chesney2729.3
Green Robert Harper Rickey1384.7
TUSC Steve Bush471.6
Majority36712.5
Turnout 2,92628.7
Liberal Democrat hold Swing

Tiverton West

Tiverton West [61]
PartyCandidateVotes%±
Conservative Polly Colthorpe1,03235.4
UKIP Tony McIntyre79827.4
Labour Anne Kilshaw36612.6
Liberal Democrat Henry George Edwin Oliver2639.0
Independent Steve Flaws1886.5
Independent Clive McIntyre1394.8
Green Catherine Povey1204.1
Majority2348.0
Turnout 2,91329.5
Conservative hold Swing

Torrington Rural

Torrington Rural [62]
PartyCandidateVotes%±
Conservative Andy Boyd1,28438.4
UKIP James Conabere95528.6
Liberal Democrat Adrian Stuart Freeland53115.9
Green Catherine Hannah Simmons2998.9
Labour Gillian Tesh2647.9
Majority3299.8
Turnout 3,34131.1
Conservative hold Swing

Totnes Rural

Totnes Rural [63]
PartyCandidateVotes%±
Green Robert Vint98431.9
Conservative Colin Edward Hair76124.7
Labour Carole Whitty58118.9
UKIP Ian Campbell Keir46215.0
Liberal Democrat Andrew Bridgwater2909.4
Majority2237.2
Turnout 3,08235.8
Green gain from Labour Swing

Willand and Uffculme

Willand and Uffculme [64]
PartyCandidateVotes%±
Conservative Ray Radford1,24339.1
UKIP David Ewart Graham75923.9
Independent David Follett Pugsley49915.7
Labour Jocelyn Anne Pritchard32510.2
Liberal Democrat Richard John Foord1725.4
Green Hugh Meller1685.3
Majority48415.2
Turnout 3,17530.7
Conservative hold Swing

Yealmpton

Yealmpton [65]
PartyCandidateVotes%±
Conservative Will Mumford1,65551.1
UKIP Stuart Edward Munnery61118.9
Liberal Democrat Brian Samuel Blake57417.7
Green Janet Elsie Chapman38812.0
Majority1,04432.2
Turnout 3,24035.8
Conservative hold Swing

Yelverton Rural

Yelverton Rural [66]
PartyCandidateVotes%±
Conservative Philip Richard Sanders1,29137.6
UKIP Andrew George James Mudge96328.0
Liberal Democrat Gail Bones51815.1
Labour Samantha Louise Loveridge37410.9
Green Lynton Jon Wells North2838.2
Majority3289.5
Turnout 3,43633.5
Conservative hold Swing

Related Research Articles

East Devon Non-metropolitan district in England

East Devon is a local government district in Devon, England. Its council has been based in Honiton since February 2019, and the largest town is Exmouth.

East Devon (UK Parliament constituency) Parliamentary constituency in the United Kingdom

East Devon is a constituency represented in the House of Commons of the UK Parliament since 2001 by Hugo Swire of the Conservative Party.

2005 United Kingdom local elections

Elections for local government were held in the England and Northern Ireland on 5 May 2005 along with the 2005 general election across the entire United Kingdom. In addition, the Isle of Wight held a local referendum on the issue of a directly elected mayor.

South Hams District Council elections

South Hams District Council in Devon, England is elected every four years. Since the last boundary changes in 2015, 31 councillors have been elected from 20 wards: eleven of which elect one councillor, seven elect two councillors and two elect three counillors. Between 1999 and 2014, 40 councillors were elected from 30 wards.

Honiton (UK Parliament constituency) former UK Parliament constituency

Honiton was a parliamentary constituency centred on the town of Honiton in east Devon, formerly represented in the House of Commons of the Parliament of the United Kingdom. It sent members intermittently from 1300, consistently from 1640. It elected two Members of Parliament (MPs) until it was abolished in 1868. It was recreated in 1885 as a single-member constituency.

2001 United Kingdom local elections

Local elections took place in some parts of the UK on 7 June 2001. Elections took place for all of the English shire counties, some English unitary authorities and all of the Northern Ireland districts. The elections were delayed from the usual date of the first Thursday in May due to the 2001 UK foot and mouth crisis and were held on the same day as the general election.

Plymouth City Council

Plymouth City Council is the unitary authority for Plymouth, Devon. It has traditionally been controlled by Labour or the Conservatives, with Liberal Democrats rarely winning seats.

2013 West Sussex County Council election

The West Sussex County Council election, 2013 took place on 2 May 2013, as part of the United Kingdom local elections, 2013. All 71 electoral divisions were up for election, which returned one county councillor each by first-past-the-post voting for a four-year term of office. At this election, the Conservative Party was seeking to retain overall control of the council, and the Liberal Democrats to maintain their position as the main opposition party.

2013 Northamptonshire County Council election

An election to Northamptonshire County Council took place on 2 May 2013 as part of the United Kingdom local elections, 2013. Following a boundary review, the number of county councillors was reduced from 73 to 57 from this election. All members were elected by first-past-the-post voting from single-member electoral divisions for a four-year term of office. The Conservative Party held on to their overall majority, having held overall control of the council since 2005.

2017 Scottish local elections

The 2017 Scottish local elections were held on Thursday 4 May, in all 32 local authorities. The SNP retained its position as the largest party in terms of votes and councillors, despite suffering minor losses. The Conservatives made gains and displaced Labour as the second largest party, while the Liberal Democrats suffered a net loss of councillors despite increasing their share of the vote. Minor parties and independents polled well; and independent councillors retained majority control over the 3 island councils. For the first time since the local government reforms in 1995, all councils fell under no overall control.

2011 Torridge District Council election

The 2011 Torridge District Council election took place on 5 May 2011 to elect members of Torridge District Council in Devon, England. The whole council was up for election and the council stayed under no overall control.

The 2015 Torridge District Council election took place on 7 May 2015 to elect members of Torridge District Council in England. This was on the same day as other local elections and the 2015 UK General Election hence turnout was much higher than usual Local Elections.

2016 Exeter City Council election

The 2016 Exeter City Council election took place on 5 May 2016, to elect members of Exeter City Council in England. Following boundary changes, the entire council was up for election, and all 13 wards were contested, each electing three councillors. The election was held concurrently with other local elections held in England on the 5 May.

2017 United Kingdom local elections

The 2017 United Kingdom local elections were held on Thursday 4 May 2017. Local elections were held across Great Britain, with elections to 35 English local authorities and all councils in Scotland and Wales.

2017 Devon County Council election

The 2017 Devon County Council election took place on 4 May 2017 as part of the 2017 local elections in the United Kingdom. All 60 councillors were elected from 58 electoral divisions, which returned either one or two county councillors each by first-past-the-post voting for a four-year term of office.

2017 Gloucestershire County Council election

The 2017 Gloucestershire County Council election took place on 4 May 2017 as part of the 2017 local elections in the United Kingdom. All 53 councillors were elected from electoral divisions which returned one county councillor each by first-past-the-post voting for a four-year term of office. Control of the council went from a Conservative Party minority to a majority administration.

2017 Cornwall Council election

The 2017 Cornwall Council election was held on 4 May 2017 as part of the 2017 local elections in the United Kingdom. 122 councillors were elected from the 121 electoral divisions of Cornwall Council, which returned either one or two councillors each by first-past-the-post voting for a four-year term of office. Although originally scheduled to take place on the same day, the election in the Bodmin St Petroc ward was countermanded following the death of Liberal Democrat candidate Steve Rogerson and was held on 8 June.

2017 Welsh local elections

Local elections were held in Wales on Thursday 4 May 2017 to elect members of all 22 local authorities, including the Isle of Anglesey, which was last up for election in 2013 due to having its elections delayed for a year. These local elections were held alongside local elections in Scotland and parts of England.

References

  1. "The Representation of the People (Form of Canvass) (England and Wales) Regulations 2006, Schedule Part 1". Legislation.gov.uk. 13 October 2011. Retrieved 18 April 2012.
  2. "I have two homes. Can I register at both addresses?". The Electoral Commission. Retrieved 5 January 2011.
  3. "Devon County Council Elections 2009". Devon County Council. Retrieved 2013-05-04.
  4. "Election 2013 – Results | Democracy in Devon". Devon County Council. Retrieved 2013-05-04.
  5. "Election 2013 results – Alphington & Cowick". Devon County Council . Retrieved 7 May 2017.
  6. "Election 2013 results – Ashburton & Buckfastleigh". Devon County Council . Retrieved 7 May 2017.
  7. "Election 2013 results – Axminster". Devon County Council . Retrieved 7 May 2017.
  8. "Election 2013 results – Barnstaple North". Devon County Council . Retrieved 7 May 2017.
  9. "Election 2013 results – Barnstaple South". Devon County Council . Retrieved 7 May 2017.
  10. "Election 2017 results – Bickleigh & Wembury". Devon County Council . Retrieved 7 May 2017.
  11. "Election 2013 results – Bideford East". Devon County Council . Retrieved 7 May 2017.
  12. "Election 2013 results – Bideford South & Hartland". Devon County Council . Retrieved 7 May 2017.
  13. "Election 2013 results – Bovey Tracey Rural". Devon County Council . Retrieved 7 May 2017.
  14. "Election 2013 results – Braunton Rural". Devon County Council . Retrieved 7 May 2017.
  15. "Election 2013 results – Broadclyst & Whimple". Devon County Council . Retrieved 7 May 2017.
  16. "Election 2013 results – Budleigh". Devon County Council . Retrieved 7 May 2017.
  17. "Election 2013 results – Chudleigh Rural". Devon County Council . Retrieved 7 May 2017.
  18. "Election 2013 results – Chulmleigh & Swimbridge". Devon County Council . Retrieved 7 May 2017.
  19. "Election 2013 results – Combe Martin Rural". Devon County Council . Retrieved 7 May 2017.
  20. "Election 2013 results – Crediton Rural". Devon County Council . Retrieved 7 May 2017.
  21. "Election 2013 results – Cullompton Rural". Devon County Council . Retrieved 7 May 2017.
  22. "Election 2013 results – Dartmouth & Kingswear". Devon County Council . Retrieved 7 May 2017.
  23. "Election 2013 results – Dawlish". Devon County Council . Retrieved 7 May 2017.
  24. "Election 2013 results – Duryard & Pennsylvania". Devon County Council . Retrieved 7 May 2017.
  25. "Election 2013 results – Exminster & Kenton". Devon County Council . Retrieved 7 May 2017.
  26. "Election 2013 results – Exmouth Brixington & Withycombe". Devon County Council . Retrieved 7 May 2017.
  27. "Election 2013 results – Exmouth Halsdon & Woodbury". Devon County Council . Retrieved 7 May 2017.
  28. "Election 2013 results – Exmouth Littleham and Town". Devon County Council . Retrieved 7 May 2017.
  29. "Election 2013 results – Exwick & St Thomas". Devon County Council . Retrieved 7 May 2017.
  30. "Election 2013 results – Fremington Rural". Devon County Council . Retrieved 7 May 2017.
  31. "Election 2013 results – Hatherleigh and Chagford". Devon County Council . Retrieved 7 May 2017.
  32. "Election 2013 results – Heavitree & Whipton Barton". Devon County Council . Retrieved 7 May 2017.
  33. "Election 2013 results – Holsworthy Rural". Devon County Council . Retrieved 7 May 2017.
  34. "Election 2013 results – Honiton St Michael's". Devon County Council . Retrieved 7 May 2017.
  35. "Election 2013 results – Honiton St Paul's". Devon County Council . Retrieved 7 May 2017.
  36. "Election 2013 results – Ilfracombe". Devon County Council . Retrieved 7 May 2017.
  37. "Election 2013 results – Ivybridge". Devon County Council . Retrieved 7 May 2017.
  38. "Election 2013 results – Kingsbridge & Stokenham". Devon County Council . Retrieved 7 May 2017.
  39. "Election 2013 results – Kingsteignton". Devon County Council . Retrieved 7 May 2017.
  40. "Election 2013 results – Newton Abbot North". Devon County Council . Retrieved 7 May 2017.
  41. "Election 2013 results – Newton Abbot South". Devon County Council . Retrieved 7 May 2017.
  42. "Election 2013 results – Newton St Cyres & Sandford". Devon County Council . Retrieved 7 May 2017.
  43. "Election 2013 results – Newtown & Polsloe". Devon County Council . Retrieved 7 May 2017.
  44. "Election 2013 results – Northam". Devon County Council . Retrieved 7 May 2017.
  45. "Election 2013 results – Okehampton Rural". Devon County Council . Retrieved 7 May 2017.
  46. "Election 2013 results – Ottery St Mary Rural". Devon County Council . Retrieved 7 May 2017.
  47. "Election 2013 results – Pinhoe & Mincinglake". Devon County Council . Retrieved 7 May 2017.
  48. "Election 2013 results – Priory & St Leonard's". Devon County Council . Retrieved 7 May 2017.
  49. "Election 2013 results – Seaton Coastal". Devon County Council . Retrieved 7 May 2017.
  50. "Election 2013 results – Sidmouth Sidford". Devon County Council . Retrieved 7 May 2017.
  51. "Election 2013 results – South Brent & Dartington". Devon County Council . Retrieved 7 May 2017.
  52. "Election 2013 results – South Molton Rural". Devon County Council . Retrieved 7 May 2017.
  53. "Election 2013 results – St David's & St James". Devon County Council . Retrieved 7 May 2017.
  54. "Election 2013 results – St Loyes & Topsham". Devon County Council . Retrieved 7 May 2017.
  55. "Election 2013 results – Tavistock". Devon County Council . Retrieved 7 May 2017.
  56. "Election 2013 results – Teign Estuary". Devon County Council . Retrieved 7 May 2017.
  57. "Election 2013 results – Teignbridge South". Devon County Council . Retrieved 7 May 2017.
  58. "Election 2013 results – Teignmouth". Devon County Council . Retrieved 7 May 2017.
  59. "Election 2013 results – Thurlestone, Salcombe & Allington". Devon County Council . Retrieved 7 May 2017.
  60. "Election 2013 results – Tiverton East". Devon County Council . Retrieved 7 May 2017.
  61. "Election 2013 results – Tiverton West". Devon County Council . Retrieved 7 May 2017.
  62. "Election 2013 results – Andy Boyd". Devon County Council . Retrieved 7 May 2017.
  63. "Election 2013 results – Totnes Rural". Devon County Council . Retrieved 7 May 2017.
  64. "Election 2013 results – Willand & Uffculme". Devon County Council . Retrieved 7 May 2017.
  65. "Election 2013 results – Yealmpton". Devon County Council . Retrieved 7 May 2017.
  66. "Election 2013 results – Yelverton Rural". Devon County Council . Retrieved 7 May 2017.