Surrey County Council election, 2013

Last updated

Surrey County Council election, 2013
Flag of England.svg
  2009 2 May 2013 2017  

All 81 seats to Surrey County Council
41 seats needed for a majority

 First partySecond party
 
Party Conservative Liberal Democrat
Seats won589
Seat changeIncrease2.svg2Decrease2.svg4

 Third partyFourth party
 
Party RA UKIP
Seats won83
Seat changeDecrease2.svg1Increase2.svg3

Surrey UK local election 2013 map.svg
Map showing the results of the 2013 Surrey County Council elections.

Council control before election


Conservative

Council control after election


Conservative

The Surrey County Council election, 2013 took place on 2 May 2013 as part of the United Kingdom local elections, 2013. [1] 81 electoral divisions returned one county councillor each by first-past-the-post voting for a four-year term of office. Following a review, new electoral division boundaries were introduced for this election, increasing the number of councillors from 80 to 81.

Surrey County Council British administrative authority

Surrey County Council is the county council administering certain services in the non-metropolitan county of Surrey in England. The council is composed of 81 elected Councillors, the majority of whom are members of the Conservative party. The leader of the council is Tim Oliver.

First-past-the-post voting voting system in which voters select one candidate, and the candidate who receives more votes than any other candidate wins

A first-past-the-post electoral system is one in which voters indicate on a ballot the candidate of their choice, and the candidate who receives the most votes wins. This is sometimes described as winner takes all. First-past-the-post voting is a plurality voting method. FPTP is a common, but not universal, feature of electoral systems with single-member electoral divisions, and is practiced in close to one third of countries. Notable examples include Canada, India, the United Kingdom, and the United States, as well as most of their current or former colonies and protectorates.

Contents

All locally registered electors (British, Irish, Commonwealth and European Union citizens) who were aged 18 or over on Thursday 2 May 2013 were entitled to vote in the local elections. Those who were temporarily away from their ordinary address (for example, away working, on holiday, in student accommodation or in hospital) were also entitled to vote in the local elections, [2] although those who had moved abroad and registered as overseas electors cannot vote in the local elections. It is possible to register to vote at more than one address (such as a university student who had a term-time address and lives at home during holidays) at the discretion of the local Electoral Register Office, but it remains an offence to vote more than once in the same local government election. [3] The next election is scheduled for 4 May 2017.

In general, a Commonwealth citizen is a citizen of a member state of the Commonwealth of Nations. This designation is given legal effect in the nationality laws of some Commonwealth countries, and Commonwealth citizens may enjoy some privileges in the United Kingdom and, less commonly, other member states. Each Commonwealth country determines what special rights, if any, are accorded to citizens of other Commonwealth countries. The status is most significant in British law and has little effect in many other Commonwealth countries, such as Australia.

European Union Economic and poitical union of states located in Europe

The European Union (EU) is a political and economic union of 28 member states that are located primarily in Europe. It has an area of 4,475,757 km2 (1,728,099 sq mi) and an estimated population of about 513 million. The EU has developed an internal single market through a standardised system of laws that apply in all member states in those matters, and only those matters, where members have agreed to act as one. EU policies aim to ensure the free movement of people, goods, services and capital within the internal market, enact legislation in justice and home affairs and maintain common policies on trade, agriculture, fisheries and regional development. For travel within the Schengen Area, passport controls have been abolished. A monetary union was established in 1999 and came into full force in 2002 and is composed of 19 EU member states which use the euro currency.

Summary

Despite suffering the loss of 335 of 1451 councillors in simultaneous elections across England, [4] the Conservative Party increased their majority on the council by two seats. Independent candidates and local residents' association groups won ten seats between them. The Liberal Democrats won 9 seats, losing four seats to the Conservatives). UKIP and the Green Party gained three seats and one seat respectively from the Conservatives to win their first representation on the council at this election. The Labour Party retained their only seat on the council.

Conservative Party (UK) Political party in the United Kingdom

The Conservative Party, officially the Conservative and Unionist Party, is a centre-right political party in the United Kingdom. Presently led by Theresa May, it has been the governing party since 2010. It presently has 314 Members of Parliament in the House of Commons, 249 members of the House of Lords, and 18 members of the European Parliament. It also has 31 Members of the Scottish Parliament, 12 members of the Welsh Assembly, eight members of the London Assembly and 9,008 local councillors. One of the major parties of UK politics, it has formed the government on 45 occasions, more than any other party.

Liberal Democrats (UK) Political party in the United Kingdom

The Liberal Democrats are a liberal, centrist political party in the United Kingdom. They presently have 11 Members of Parliament in the House of Commons, 96 members of the House of Lords, and one member of the European Parliament. They also have five Members of the Scottish Parliament and a member each in the Welsh Assembly and London Assembly. The party reached the height of its influence in the early 2010s, forming a junior partner in a coalition government from 2010 to 2015. It is presently led by Vince Cable.

Green Party of England and Wales Political party in England and Wales

The Green Party of England and Wales is a green, left-wing political party in England and Wales. Headquartered in London, since September 2018, its Co-Leaders are Siân Berry and Jonathan Bartley. The Green Party has one Member of Parliament in the House of Commons, one representative in the House of Lords, and three Members of the European Parliament. It has various councillors in UK local government and two members of the London Assembly.

Electoral Review

For these elections the number of seats in the Council increased from 80 to 81 implementing, with a minor change, recommendations of the 2010 review by the Local Government Boundary Commission for England. [5] During the consultation the Council in November 2010 recommended no change to the number of councillors and most submissions recommended a reduction in the number of councillors, including a representation from Surrey Heath District Council to reduce the number of councillors to 60. However, when the Council drafted its boundary proposals it realised that allocation of 8 members to Waverley District would mean:

Waverley’s average division size would become 12,015 [electors], over 8% larger than the target size for the County. Given this and Waverley’s geographical nature, it would be extremely difficult to meet the Commission’s criteria regarding electoral equality whilst also meeting the other two criteria of community identity and convenient and effective local government.

[6]

Therefore, although the threshold for electoral inequality is 10% variation from the average, which must be reached in 33% of divisions to trigger a boundary commission review, the Council relied in evidence on the fact that Waverley's projected electorate in 2016 would be the most disparate above the quota. Others were over-represented falling below the quota and opponents argued for instead, their removal. Determined to keep a minimum of 80 councillors, Surrey County Council stated that Waverley would be, in its view, unacceptably under-represented and so advocated 81 seats in its final, modified size submission of March 2011. [6] The LGBCE accepted this argument. [5]

The boundary review resulted generally to minor revisions all of which were only to a minority of divisions, with consequential name changes in a few instances. [5]

Candidates

The only party which nominated candidates in all 81 divisions were UKIP, followed by the Conservative Party, who contested 80 divisions. The Labour Party stood in 78 divisions and the Liberal Democrats contested 76 divisions. [7] None of the other parties fielded candidates in a majority of divisions, with the Green Party and Residents Associations both standing in 12 divisions. Eleven candidates stood as independents.

Results [7]

The distribution of seats after the 2013 Surrey County Council Election Surrey County Council 2013 Distrubution.png
The distribution of seats after the 2013 Surrey County Council Election
Surrey County Council election, 2013
PartySeatsGainsLossesNet gain/lossSeats %Votes %Votes+/−
  Conservative 5864+27239.6102,121-54,107
  Liberal Democrat 904-41115.740,609-51,059
  Residents 801-1106.418,660-1,390
  UKIP 330+3422.357,59823,671
  Labour 100±0110.827,7828,389
  Independent 100±013.356,051-2,454
  Green 110+111.64,090-2,321
  Peace 000±000.1297150
  Monster Raving Loony 000±000.05127
  BNP 000±000.0498-1,520
 UK Community Issues Party000±000.0243
  English Democrat 000±000.0239

Results by district [7]

Surrey County Council is split into 81 single-member electoral divisions. These are grouped into 11 districts, each of which has between 6 and 10 divisions. [6]

Elmbridge

Cobham [8]
PartyCandidateVotes%±
Conservative Mary Lewis1,52457-12.8
UKIP Richard Atkins65124
Liberal Democrat David Bellchamber29511-12.7
Labour Carolyn Gray19771.6
Majority
Turnout 2,66725.85-10.65
Conservative hold Swing
East Molesey & Esher [9]
PartyCandidateVotes%±
Residents Stuart Selleck1,13441-4
Conservative Steve Bax1,11041-2.1
UKIP Trevor Marshall29111
Labour Irene Threlkeld10741.1
Liberal Democrat Paul Nagle632-6.7
Monster Raving Loony Chinners341
Majority
Turnout 2,73928.61-14.29
Residents hold Swing
Hersham [10]
PartyCandidateVotes%±
Conservative Margaret Hicks1,32340-1.7
Hersham Village SocietyRoy Green1,15335
UKIP Richard Newbold45914
Labour Irene Hamilton24570.1
Liberal Democrat Simon Lumb1204-7.1
Majority170
Turnout 3,30032.80-8.8
Conservative hold Swing
Hinchley Wood, Claygate & Oxshott [11]
PartyCandidateVotes%±
Conservative Mike Bennison1,94350
Liberal Democrat Keya Ashraf1,15330
UKIP Bernard Collignon56915
Labour Sheila Francis2206
Majority
Turnout 3,88532.48-13.12
Conservative hold Swing
The Dittons [12]
PartyCandidateVotes%±
Residents Peter Hickman1,86155
Conservative Robert Stead62418
UKIP Susannah Cunningham48314
Labour Francis Eldergill2196
Liberal Democrat Mike Smith2036
Majority
Turnout 3,39029.01
Residents hold Swing
Walton [13]
PartyCandidateVotes%±
Conservative Rachael Lake1,04537
The Walton SocietyMike Collins90432
UKIP Anita Wooldridge44516
Labour Peter Hawkes31611
Liberal Democrat Sereena Davey973
Majority
Turnout 2,80725.25
Conservative gain from Residents Swing 3.4
Walton South & Oatlands [14]
PartyCandidateVotes%±
Conservative Tony Samuels1,68257
UKIP Gillian Grant58420
Labour Margaret Hawkes35012
Liberal Democrat John Smith32211
Majority
Turnout 2,93826.99
Conservative hold Swing
West Molesey [15]
PartyCandidateVotes%±
Residents Ernest Mallett1,94771
UKIP Steve Clements353<13
Conservative Christine Elmer26510
Liberal Democrat Alastair Sturgis733
Labour Matt Willey572
Monster Raving Loony Crazy Dave411
Majority
Turnout 2,73627.16
Residents hold Swing
Weybridge [16]
PartyCandidateVotes%±
Conservative Christian Mahne99132
Independent Peter Harman79225
Liberal Democrat Andrew Davis65021
UKIP Ian Lake52417
Labour Martin Lister1585
Majority
Turnout 3,11527.95
Conservative hold Swing

Epsom and Ewell

Epsom Town & Downs
PartyCandidateVotes%±
Conservative Tina Mountain1,44839
Residents Neil Dallen1,06028
UKIP Iain Bonner-Fomes50213
Liberal Democrat Alison Kelly42311
Labour Kate Chinn2898
Majority
Turnout 33
Conservative gain from Residents Swing
Epsom West
PartyCandidateVotes%±
Liberal Democrat Stella Lallement85428
Residents Paul Ardern-Jones69323
Labour Steve Dyke61620
UKIP Davi Crawford49416
Conservative Mhairi Fraser38913
Majority
Turnout 29
Liberal Democrat hold Swing
Ewell
PartyCandidateVotes%±
Residents John Beckett2,06563
UKIP David Hunt53916
Conservative Alison Chatterton35911
Labour Rosemary Taylor1485
Liberal Democrat Jim Dapre843
Green Donna O'Brien762
Majority
Turnout 27
Residents hold Swing
Ewell Court, Auriol & Cuddington
PartyCandidateVotes%±
Residents Eber Kington2,23364
UKIP Roger Kemp62418
Conservative Carole Edwards3109
Labour Colin Luxton2066
Liberal Democrat Rusmat Ahmed903
Majority
Turnout 28
Residents hold Swing
West Ewell
PartyCandidateVotes%±
Residents Jan Mason1,37349
UKIP Bob Cane49518
Conservative Stephen Pontin41915
Labour Rob Geleit37013
Liberal Democrat Julia Kirkland1455
Majority
Turnout 24
Residents hold Swing

Guildford

Ash
PartyCandidateVotes%±
Conservative Marsha Molesey1,31247
UKIP Mazhar Manzoor57321
Liberal Democrat Alan Hilliar56820
Labour Joan O'Bryne32912
Majority
Turnout 28
Conservative hold Swing
Guildford East
PartyCandidateVotes%±
Conservative Graham Ellwood1,87450
Liberal Democrat Ted Mayne93125
UKIP Colin Reardon56815
Labour Malcolm Hill38410
Majority
Turnout 36
Conservative hold Swing
Guildford North
PartyCandidateVotes%±
Liberal Democrat Pauline Searle1,11535
Conservative Sharon Stokes77524
UKIP David Sheppard65921
Labour Michael Hassell64820
Majority
Turnout 27
Liberal Democrat hold Swing
Guildford South-East
PartyCandidateVotes%±
Conservative Mark Brett-Warburton1,86553
Liberal Democrat Kelly-Maire Blundell90526
UKIP Nyree Wadman42612
Labour Rajanathan Rajasingham3079
Majority
Turnout 33
Conservative hold Swing
Guildford South-West
PartyCandidateVotes%±
Liberal Democrat David Goodwin1,18938
Conservative Nils Christiansen1,03933
Labour Mary Davies41113
UKIP Laura McEvoy40913
Peace Tom May1174
Majority
Turnout 29
Liberal Democrat hold Swing
Guildford West
PartyCandidateVotes%±
Liberal Democrat Fiona White73235
Labour Brian Walter49424
UKIP Laurence Hodge43521
Conservative Chris Varveris32516
Peace John Morris1055
Majority
Turnout 20
Liberal Democrat hold Swing
Horsleys
PartyCandidateVotes%±
Conservative Bill Barker2,17760
UKIP Garreth Evans75021
Liberal Democrat Arnold Pindar42912
Labour Carolyn Fiddes2587
Majority
Turnout 36
Conservative hold Swing
Shalford
PartyCandidateVotes%±
UKIP George Johnson1,41151
Liberal Democrat George Potter1,02337
Labour Rose Seber34712
Majority
Turnout 27
UKIP gain from Conservative Swing
Shere
PartyCandidateVotes%±
Conservative Keith Taylor1,90757
UKIP Donna Walker77823
Liberal Democrat Marilyn Merryweather36111
Labour Robin Woof3099
Majority
Turnout 34
Conservative hold Swing
Worplesdon
PartyCandidateVotes%±
Conservative Keith Witham1,81651
UKIP Terry Wadman77722
Liberal Democrat Paul Cragg60917
Labour Michael Jeram3329
Majority
Turnout 32
Conservative hold Swing

Mole Valley

Ashtead [17]
PartyCandidateVotes%±
Independent Christopher Townsend2,28353
Conservative Tim Ashton1,33231
UKIP Adrian Daniels46511
Labour Susan Gilchrist1664
Liberal Democrat Penelope Becker952
Majority
Turnout 4,34138.51
Independent hold Swing
Bookham and Fetcham West
PartyCandidateVotes%±
Conservative Clare Curran2,11546
Liberal Democrat Andrew Freeman1,21826
UKIP Mike Heelas1,10423
Labour Keith Davis2595
Majority
Turnout 39
Conservative hold Swing
Dorking Hills
PartyCandidateVotes%±
Liberal Democrat Hazel Watson2,04346
Conservative Lynne Hack1,18927
UKIP Apolinario Afonso84719
Green Jacquetta Fewster2005
Labour Jonathan Orde1513
Majority
Turnout 41
Liberal Democrat hold Swing
Dorking Rural
PartyCandidateVotes%±
Conservative Helyn Clack1,81040
Liberal Democrat Michael Ward1,52734
UKIP Leigh Jones93521
Labour Malcolm Ward2616
Majority
Turnout 41
Conservative hold Swing
Dorking South and the Holmwoods
PartyCandidateVotes%±
Liberal Democrat Stephen Cooksey1,53242
Conservative James Morton97427
UKIP Michael Foulston77421
Labour Frank Pemberton3289
Turnout 38
Liberal Democrat hold Swing
Leatherhead and Fetcham East
PartyCandidateVotes%±
Conservative Tim Hall1,56442
UKIP Roger Bird1,04828
Liberal Democrat Bridget Lewis-Carr78221
Labour Robert Mallon2978
Majority
Turnout 31.5
Conservative hold Swing

Reigate and Banstead

Banstead, Woodmansterne & Chipstead
PartyCandidateVotes%±
Conservative Ken Gulati1497
UKIP Chris Byrne994
Green Phil Wilson272
Liberal Democrat Helen Kulka233
Majority50316.8
Turnout 2,99626
Conservative hold Swing
Earlswood and Reigate South [18]
PartyCandidateVotes%±
Conservative Barbara Thomas95533
UKIP Joseph Fox89931
Labour Graham Wildridge61521
Green Katie Smith2358
Liberal Democrat Anthony Lambell2197
Majority
Turnout 2,92328.41
Conservative hold Swing
Horley East [19]
PartyCandidateVotes%±
Conservative Dorothy Ross-Tomlin1,06947
UKIP Christian Stevens71631
Labour Linda Mabbett25311
Liberal Democrat Tim Deevoy2159
Majority
Turnout 2,28124.72
Conservative hold Swing
Horley West, Salfords and Sidlow [20]
PartyCandidateVotes%±
Conservative Kay Hammond1,03842
UKIP Timothy Brooke-Harte88936
Labour Rosie Norgrove33514
Liberal Democrat Barry Hamilton2159
Majority
Turnout 2,47725.72
Conservative hold Swing
Merstham and Banstead South [21]
PartyCandidateVotes%±
Conservative Bob Gardner1,09544
UKIP Bob Cambridge69828
Labour Julie Halford45018
Liberal Democrat Christopher Howell27111
Turnout 2,51425.33
Conservative hold Swing
Nork and Tattenhams [22]
PartyCandidateVotes%±
Residents AssociationNick Harrison1,95454
UKIP Andre Grant58318
Conservative Patsy Shillinglaw51716
Labour Clive Scott1113
Liberal Democrat Stephen Gee913
Green Derek Smith532
Turnout 3,30928.08
Residents' Association hold Swing
Redhill East [23]
PartyCandidateVotes%±
Green Jonathan Essex1,45750
Conservative Richard Coad64522
UKIP Colin Stiff37913
Labour Stewart Dack34512
Liberal Democrat Andrew Cressy1034
Turnout 2,92928.91
Green gain from Conservative Swing
Redhill West and Meadvale [24]
PartyCandidateVotes%±
Conservative Natalie Bramhall99530
Green Sarah Finch70021
UKIP Tim Pearson63319
Liberal Democrat Peter Lambell58718
Labour John Berge36411
Turnout 3,27932.23
Conservative hold Swing
Reigate [25]
PartyCandidateVotes%±
Conservative Zully Grant-Duff1,58849
Liberal Democrat William Dyer57918
UKIP Stephen Russell51516
Labour Andrew Saunders2819
Green Bryn Truscott2688
Turnout 3,23131.01
Conservative gain from Liberal Democrat Swing
Tadworth, Walton and Kingswood [26]
PartyCandidateVotes%±
Conservative Michael Gosling1,50053
UKIP Robert Leach90132
Green Alistair Morten2308
Liberal Democrat Judith Briony2017
Turnout 2,83226.73
Conservative hold Swing

Runnymede

Addlestone
PartyCandidateVotes%±
Conservative John Furey1,14639.6
UKIP Toby Micklethwait92231.9
Labour Arran Neathey58920.4
Liberal Democrat Andrew Falconer1826
Monster Raving Loony Crazy Crab522
Majority
Turnout 26
Conservative hold Swing
Chertsey
PartyCandidateVotes%±
Conservative Chris Norman128441.9
UKIP Adam Shire96231.4
Labour Lee Godfrey81926.7
Majority
Turnout 28
Conservative hold Swing
Egham
PartyCandidateVotes%±
Conservative Yvonna Lay73042.4
UKIP Gwendoline Cornell48127.9
Labour David Bell34119.8
Liberal Democrat Dorian Mead16910
Majority
Turnout 21
Conservative hold Swing
Englefield Green
PartyCandidateVotes%±
Conservative Marisa Heath95042.7
UKIP John Gynn54124.3
Labour Jack Killian34915.7
Green Rustam Majainah22410
Liberal Democrat Andy Watson1597
Majority
Turnout 19.5
Conservative hold Swing
Foxhills, Thorpe and Virginia Water
PartyCandidateVotes%±
Conservative Mel Few1,54053.0
UKIP Graham Wood83228.6
Labour John Gurney36212.4
Liberal Democrat Ian Heath1746
Majority
Turnout 27
Conservative hold Swing
Woodham and New Haw
PartyCandidateVotes%±
Conservative Mary Angell1,30147.3
UKIP David Roe85030.9
Labour Anne Emerson35713.0
Liberal Democrat Jennifer Coulon2429
Majority
Turnout 28
Conservative hold Swing

Spelthorne

Ashford [27]
PartyCandidateVotes%±
Conservative Carol Ann Coleman1,29944
UKIP Robert Bromley96433
Labour Joe Miller51117
Liberal Democrat Kelvin Gardiner1555
Turnout 2,92927.43
Conservative hold Swing
Laleham and Shepperton
PartyCandidateVotes%±
Conservative Richard Walsh1,70153
UKIP Linda Thatcher90228
Labour John Went37412
Liberal Democrat Richard Dunn2468
Majority
Turnout 31
Conservative hold Swing
Lower Sunbury & Halliford
PartyCandidateVotes%±
Conservative Tim Evans1,11737
Liberal Democrat Sandra Dunn1,02334
UKIP Nick Wood87729
Majority
Turnout 29
Conservative gain from Liberal Democrat Swing
Staines
PartyCandidateVotes%±
Conservative Denise Saliagopoulos1,30747
UKIP Marlon Kincses62222
Labour Imtiaz Khan37113
Liberal Democrat Susan Vincent2399
Independent Jacqueline Stanton2318
Majority
Turnout 26
Conservative hold Swing
Staines South & Ashford West
PartyCandidateVotes%±
UKIP Daniel Jenkins1,17538
Conservative Denise Turner-Stewart1,17138
Labour John Johnston63020
Liberal Democrat Jon Edwards1194
Majority
Turnout 28
UKIP gain from Conservative Swing
Stanwell & Stanwell Moor
PartyCandidateVotes%±
Labour Robert Evans84735
Conservative Colin Davis59925
UKIP Geoff Cox58824
Independent Kevin Flurry25311
Liberal Democrat Fares Georges1175
Majority
Turnout 24
Labour hold Swing {{{swing}}}
Sunbury Common & Ashford Common
PartyCandidateVotes%±
Liberal Democrat Ian Beardsmore102540
UKIP Mark Fowler65825
Conservative Chris Frazer54921
Labour Sarah Wrightson35814
Majority
Turnout 22
Liberal Democrat hold Swing

Surrey Heath

Bagshot, Windlesham and Chobham
PartyCandidateVotes%±
Conservative Mike Goodman1,67454
UKIP Robert Shatwell69022
Labour Richard Wilson42614
Liberal Democrat Ruth Hutchinson33311
Majority98432
Turnout 3,12328
Conservative hold Swing
Camberley East
PartyCandidateVotes%±
Conservative Bill Chapman1,32352-4.3
UKIP John Bevan7533014.6
Labour Linda Philippson454188.4
Majority57022-18.6
Turnout 2,53023-10.7
Conservative hold Swing -4.3
Camberley West
PartyCandidateVotes%±
Conservative Denis Fuller1,46845-5.5
Labour Rodney Bates9913121.3
UKIP Alexander Remfry788248.4
Majority47714-18.2
Turnout 3,24728-7.5
Conservative hold Swing -5.5
Frimley Green and Mytchett
PartyCandidateVotes%±
Conservative Chris Pitt96236-7.1
UKIP Paul Chapman8673321.4
Liberal Democrat Cindy Ferguson48118-24.2
Labour Jacques Olmo326129
Majority9532.1
Turnout 2,63625-18
Conservative hold Swing -7.1
Heatherside and Parkside
PartyCandidateVotes%±
Conservative David Ivison1,43852-0.6
UKIP Andrew Thomas7012512
Liberal Democrat Graham Tapper43115-16
Labour Paul Tonks21484
Majority737275.1
Turnout 2,78426-15
Conservative hold Swing -0.6
Lightwater, West End and Bisley
PartyCandidateVotes%±
Conservative Adrian Page1,56252
UKIP Richard Squire84528
Labour Mick Sheehan32811
Liberal Democrat Fran Bennie2869
Majority71714
Turnout 3,02126
Conservative hold Swing

Tandridge

Caterham Hill
PartyCandidateVotes%±
Liberal Democrat John Orrick1,62546.2
Conservative Eithne Webster1,00828.7
UKIP Tony Baker68819.6
Labour Etna Houldsworth1966
Majority
Turnout 33
Liberal Democrat hold Swing
Caterham Valley
PartyCandidateVotes%±
Conservative Sally Marks 1,09040.5
Liberal Democrat David Lee69425.8
UKIP Jeffrey Bolter56721.1
Labour John Burgess2098
Green Les Adams1295
Majority
Turnout 30
Conservative hold Swing
Godstone
PartyCandidateVotes%±
UKIP Helena Windsor1,62539.9
Conservative Graham Knight1,17138.5
Liberal Democrat Richard Fowler35911.8
Labour Linda Baharier2578
English Democrat Daniel Beddoes391
Majority
Turnout 33
UKIP gain from Conservative Swing
Lingfield
PartyCandidateVotes%±
Conservative Michael Sydney1,48855.2
Independent Christopher D'Avray1,17130
UKIP Graham Bailey95225
Labour Stephen Case-Green2577
Majority
Turnout 33
Conservative hold Swing
Oxted
PartyCandidateVotes%±
Conservative Nick Skellett1,89444.6
UKIP Christopher Dean1,24529.3
Labour Terry Philpot47811.3
Liberal Democrat Peter Roberts3819
Green James Thompson-Stewart2466
Majority
Turnout 36
Conservative hold Swing
Warlingham
PartyCandidateVotes%±
Conservative David Hodge 1,44442.4
UKIP Martin Arthur1,07531.5
Liberal Democrat Simon Morrow74321.8
Labour Sarah MacDonnell1464
Majority
Turnout 34
Conservative hold Swing

Waverley

Cranleigh & Ewhurst
PartyCandidateVotes%±
Conservative Alan Young1,84251
UKIP Simon Brind93526
Liberal Democrat Ken Reed52314
Labour Lynda MacDermott3349
Majority
Turnout 33
Conservative hold Swing
Farnham Central
PartyCandidateVotes%±
Conservative Pat Frost1,035
UKIP Bob Nockels69722
Independent Mike Bryan583
Liberal Democrat Stewart Edge56218
Labour Hadleigh Roberts2368
Majority
Turnout 30
Conservative hold Swing
Farnham North
PartyCandidateVotes%±
Conservative Denise LeGal1,00532
UKIP Alexandra Swann96231
Independent Jerry Hyman57518
Liberal Democrat Mark Norris34911
Labour Janet Fearnley2317
Majority
Turnout 31
Conservative hold Swing
Farnham South
PartyCandidateVotes%±
Conservative David Munro 1,67750
UKIP Ivo Weck54216
Independent Mark Westcott54216
Independent David Beaman34410
Labour Joan Anniballi2337
Majority
Turnout 34
Conservative hold Swing
Godalming North
PartyCandidateVotes%±
Conservative Steve Cosser1,54144
Liberal Democrat Patrick Haveron73121
UKIP Jon Swainson65919
Labour Robert Park56316
Majority
Turnout 31
Conservative hold Swing
Godalming South, Milford & Witley
PartyCandidateVotes%±
Conservative Peter Martin2,06257
UKIP Tim Clark79322
Liberal Democrat Paul Farthing42912
Labour Michael Williams3279
Majority
Turnout 33
Conservative hold Swing
Haslemere
PartyCandidateVotes%±
Independent Nikki Barton1,20835
Conservative Stephen Mulliner1,18835
UKIP Patricia Culligan57317
Labour Nick Scales1545
Liberal Democrat Peter Nicholson2858
Majority
Turnout 35
Independent gain from Conservative Swing

Template:Election box win new seat

Waverley Eastern Villages
PartyCandidateVotes%±
Conservative Victoria Young2,03959
UKIP Hugo Alexander74422
Liberal Democrat Richard Cole36611
Labour Tony Johnson3119
Majority
Turnout 32
Waverley Western Villages
PartyCandidateVotes%±
Conservative David Harmer1,88061
UKIP Gail Weingartner69322
Liberal Democrat Geoffrey Whitby29910
Labour Andrew Desmond2317
Majority
Turnout 32
Conservative hold Swing

Woking

Goldsworth East and Horsell Village [28]
PartyCandidateVotes%±
Conservative Colin Kemp1,34336
Liberal Democrat Ann-Marie Barker1,24934
UKIP Howard Earl68118
Labour Akhil Viren44112
Majority
Turnout 3,72833.01
Conservative gain from Liberal Democrat Swing
Knaphill and Goldsworth West [28]
PartyCandidateVotes%±
Conservative Saj Hussain1,77149
Liberal Democrat Tina Liddington71620
UKIP Matthew Davies53715
Independent Martin Dunham35210
Labour Paul Brown2557
Majority
Turnout 3,64233.05
Conservative gain from Liberal Democrat Swing
The Byfleets [28]
PartyCandidateVotes%±
Conservative Richard Wilson1,47650-2.1
UKIP Terry Knight59720
Liberal Democrat Andy Grimshaw53318
Labour Anthony William Mullins2318
BNP Chris Jones983
Majority
Turnout 2,94529.40
Conservative hold Swing -2.1
Woking North [28]
PartyCandidateVotes%±
Conservative Ben Carasco1,45636
Labour Mohammad Raja1,30532
Liberal Democrat Muhammed Imran67217
UKIP Timothy Shaw56514
UK Community Issues PartyMichael Osman431
Majority
Turnout 4,06236.87
Conservative hold Swing
Woking South [28]
PartyCandidateVotes%±
Liberal Democrat Will Forster1,44943-3.6
Conservative Simon Bellord96329
UKIP Rob Burberry57517
Labour Stephen William Tudhope2708
Peace Julie Roxburgh752
Majority
Turnout 3,33630.79
Liberal Democrat hold Swing -3.6
Woking South East [28]
PartyCandidateVotes%±
Conservative Liz Bowes1,84358
UKIP Robin Milner61819
Liberal Democrat Liam Lyons40713
Labour Alex Denning31810
Majority
Turnout 3,19831.42
Conservative hold Swing
Woking South West
PartyCandidateVotes%±
Conservative Linda Kemeny1,33948
UKIP Marcia Taylor58921
Liberal Democrat Ken Howard56420
Labour Tom Willis29311
Majority
Turnout 2,79629.24
Conservative hold Swing

Related Research Articles

East Surrey (UK Parliament constituency) Parliamentary constituency in the United Kingdom

East Surrey is a constituency represented in the House of Commons of the UK Parliament since 2010 by Sam Gyimah of the Conservative Party. Its record is that of a Conservative safe seat based on time and opposition. It has elected a Conservative Party MP on an absolute majority since the seat's establishment, in 1918, and its greatest share of the vote for any opposition candidate was 33.75% in February 1974.

Surrey County Council is elected every four years and was made in 1889 under the Local Government Act 1888. Since 1965 this Council has had one of two statuses as to its body of councillors: no overall political control, or overall Conservative party control.

One third of Reigate and Banstead Borough Council in Surrey, England is elected each year, followed by one year without election. Since the last boundary changes in 2000, 51 councillors have been elected from 19 wards.

2009 Somerset County Council election

An election to Somerset County Council took place on 4 June 2009 as part of the United Kingdom local elections, 2009, having been delayed from 7 May, to coincide with elections to the European Parliament. The result brought to an end 16 years of Liberal Democrat rule to a Conservative controlled administration. 58 councillors were elected from various electoral divisions, which returned one county councillor each. Members were elected by the first-past-the-post voting system for a four-year term of office. This was the last election before the number of seats was cut to 55 for the 2013 election. With a total of 58 seats being reduced to 55 for the next election.

2009 Surrey County Council election

Elections to Surrey County Council took place on 4 June 2009 as part of the United Kingdom local elections, 2009, having been delayed from 7 May, in order to coincide with elections to the European Parliament.

2013 Derbyshire County Council election

An election to Derbyshire County Council took place on 2 May 2013 as part of the United Kingdom local elections, 2013. Following the final draft of the 2012 electoral review, 64 councillors were elected from 61 electoral divisions which returned either one or two county councillors each by first-past-the-post voting for a four-year term of office. No elections were held in the City of Derby, which is a unitary authority outside the area covered by the County Council. The Labour Party won back control of the council by a landslide victory, taking forty-two of the authority's sixty-four seats.

2013 Cumbria County Council election

An election to Cumbria County Council took place on 2 May013 as part of the United Kingdom local elections, 2013. All 84 councillors were elected from electoral divisions which returned one county councillor each by first-past-the-post voting for a four-year term of office. Following an electoral review carried out by the Local Government Boundary Commission for England, newly drawn electoral divisions were used without change in the number of county councillors.

2013 Leicestershire County Council election

An election to Leicestershire County Council took place on 2 May 2013 as part of the United Kingdom local elections, 2013. 55 councillors were elected from 52 electoral divisions, which returned either one or two county councillors each by first-past-the-post voting for a four-year term of office. The Conservatives held control of the council with a reduced majority of 5 seats. Despite a strong challenge from UKIP, the party only gained 2 seats whilst the Liberal Democrats lost one seat and Labour recouped some of their 2009 losses, gaining 6 seats.

2013 Hampshire County Council election

An election to Hampshire County Council took place on 2 May 2013 as part of the United Kingdom local elections, 2013. 78 councillors were elected from 75 electoral divisions, which returned either one or two county councillors each by first-past-the-post voting for a four-year term of office. The electoral divisions were the same as those of the previous election in 2009. No elections were held in Portsmouth and Southampton, which are unitary authorities outside the area covered by the County Council. The election saw the Conservative Party retain overall control of the council, with a reduced majority of five councillors.

2013 Durham County Council election

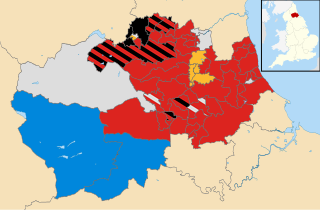
An election to Durham County Council took place on 2 May 2013 as part of the United Kingdom local elections, 2013. Following a boundary review, 126 councillors were elected from 63 electoral divisions which returned either one, two or three councillors each by first-past-the-post voting for a four-year term of office. The previous election took place in 2008 in advance of the council becoming a unitary authority after the 2009 changes to local government. The election saw the Labour Party increase their majority on the council.

2013 Gloucestershire County Council election

Elections to Gloucestershire County Council took place on 2 May 2013 as part of the United Kingdom local elections, 2013. 53 electoral divisions elected one county councillor each by first-past-the-post voting for a four-year term of office. No elections were held in South Gloucestershire, which is a unitary authority outside the area covered by the County Council.

2013 Essex County Council election

An election to Essex County Council took place on 2 May 2013 as part of the United Kingdom local elections, 2013. 75 councillors were elected from 70 electoral divisions, which returned either one or two county councillors each by first-past-the-post voting for a four-year term of office. The electoral divisions were the same as those used at the previous election in 2009. No elections were held in Thurrock or Southend-on-Sea, which are unitary authorities outside the area covered by the County Council.

2013 Staffordshire County Council election

An election to Staffordshire County Council took place on 2 May 2013 as part of the United Kingdom local elections, 2013. 62 electoral divisions returned one county councillor each by first-past-the-post voting for a four-year term of office. Following a boundary review, new electoral division boundaries were established for this election. No elections were held in Stoke-on-Trent, which is a unitary authority outside the area covered by the County Council. The council continues to be administered on the Leader and Cabinet model.

2013 Buckinghamshire County Council election

An election to Buckinghamshire County Council took place on 2 May 2013 as part of the United Kingdom local elections, 2013. 49 councillors were elected from electoral divisions which returned one county councillor each by first-past-the-post voting for a four-year term of office. Following a boundary review, the size of the council was reduced from 57 to 49 members for this election. No elections were held in Milton Keynes, which is a unitary authority outside the area covered by the County Council. The council continues to be administered on the Leader and Cabinet model. The Conservative Party won a reduced majority on the council.

2013 Northamptonshire County Council election

An election to Northamptonshire County Council took place on 2 May 2013 as part of the United Kingdom local elections, 2013. Following a boundary review, the number of county councillors was reduced from 73 to 57 from this election. All members were elected by first-past-the-post voting from single-member electoral divisions for a four-year term of office. The Conservative Party held on to their overall majority, having held overall control of the council since 2005.

The by-thirds 2015 Elmbridge Borough Council election took place on 7 May 2015 to elect members of Elmbridge Borough Council in England. This was on the same day as other local elections.

2017 United Kingdom local elections

The 2017 United Kingdom local elections were held on Thursday 4 May 2017. Local elections were held across Great Britain, with elections to 35 English local authorities and all councils in Scotland and Wales.

2017 Derbyshire County Council election

An election to Derbyshire County Council took place on 4 May 2017 as part of the United Kingdom local elections, 2017. 64 councillors were elected from 61 electoral divisions which returned either one or two county councillors each by first-past-the-post voting for a four-year term of office. No elections were held in the City of Derby, which is a unitary authority outside the area covered by the County Council. The Conservative Party won back control of the council, taking thirty-seven of the authority's sixty-four seats.

2017 Kent County Council election

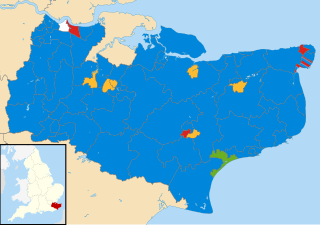
The 2017 Kent County Council election was held on 4 May 2017 as part of the 2017 local elections in the United Kingdom. All 81 councillors were elected, from 72 electoral divisions, each of which returned either one or two county councillors by first-past-the-post voting for a four-year term of office.

2017 Surrey County Council election

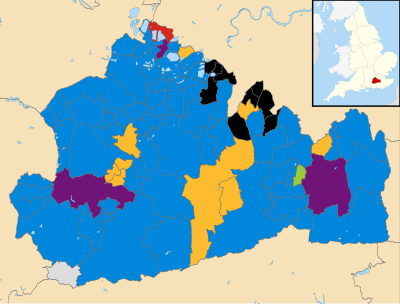
The 2017 Surrey County Council election took place as part of the 2017 local elections in the UK. All 81 councillors were elected for single-member electoral divisions for a four-year term. The electoral system used is first-past-the-post voting.

References

  1. "County council elections 2013". Surrey County Council. 12 April 2013. Retrieved 14 April 2013.
  2. "The Representation of the People (Form of Canvass) (England and Wales) Regulations 2006, Schedule Part 1". Legislation.gov.uk. 13 October 2011. Retrieved 18 April 2012.
  3. "I have two homes. Can I register at both addresses?". The Electoral Commission. Retrieved 5 January 2011.
  4. BBC News Vote 2013. Retrieved 2013-05-05
  5. 1 2 3 lgbce.org All reviews: South East: Surrey. Retrieved 2013-05-05
  6. 1 2 3 lgbce.org "Surrey Council size submissions." Retrieved 2013-05-05
  7. 1 2 3 Surrey County Council County Council Election Results. Retrieved 2013-5-5
  8. Election results for Cobham, Surrey County Council website
  9. Election results for East Molesey and Esher, Surrey County Council website
  10. Election results for Hersham, Surrey County Council website
  11. Election results for Hinchley Wood, Claygate and Oxshott, Surrey County Council Website
  12. Election results for The Dittons, Surrey County Council website
  13. Election results for Walton, Surrey County Council website
  14. Election results for Walton South & Oatlands, Surrey County Council website
  15. Election results for West Molesey, Surrey County Council website
  16. Election results for Weybridge, Surrey County Council website
  17. Election results for Ashtead
  18. Election results for Earlswood and Reigate South, Surrey County Council website
  19. Election results for Horley East, Surrey County Council website
  20. Election results for Horley West, Salfords & Sidlow, Surrey County Council website
  21. Election results for Merstham & Banstead South, Surrey County Council website
  22. Election results for Nork & Tattenhams, Surrey County Council website
  23. Election results for Redhill East, Surrey County Council website
  24. Election results for Redhill West & Meadvale, Surrey County Council website
  25. Election results for Reigate, Surrey County Council website
  26. Election results for Tadworth, Walton & Kingswood, Surrey County Council website
  27. Election results for Ashford, Surrey County Council website
  28. 1 2 3 4 5 6 Election of Councillors for the Electoral Divisions of Surrey County Council Summary of Results: Thursday 2 May 2013 (PDF)